. 2015 Jan 12;32(1):82-96.
doi: 10.1016/j.devcel.2014.11.016.

The endothelial transcription factor ERG promotes vascular stability and growth through Wnt/β-catenin signaling

Affiliations

The endothelial transcription factor ERG promotes vascular stability and growth through Wnt/β-catenin signaling

Graeme M Birdsey et al. Dev Cell. .

Abstract

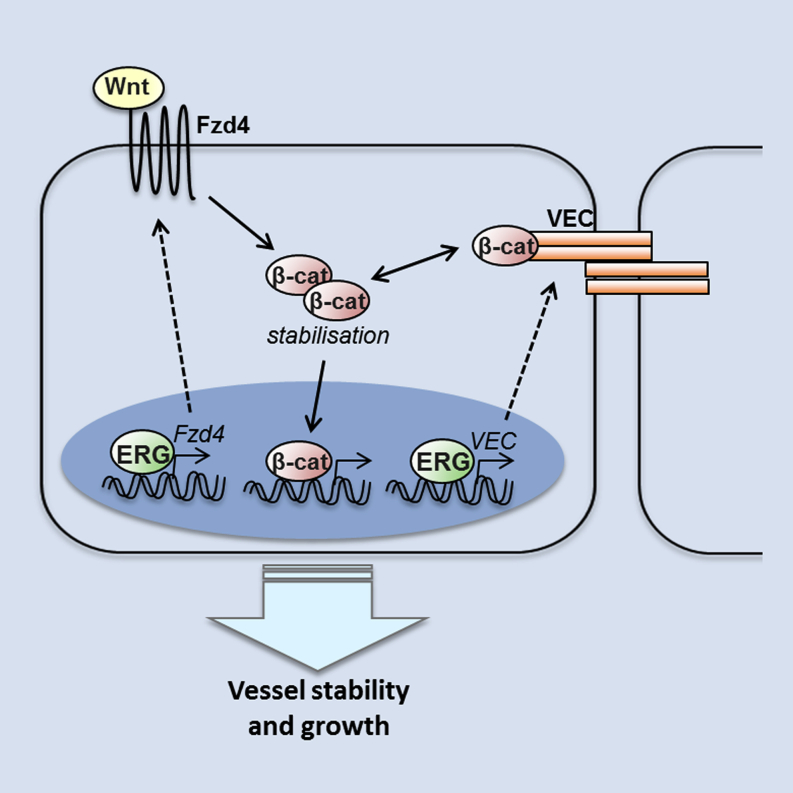
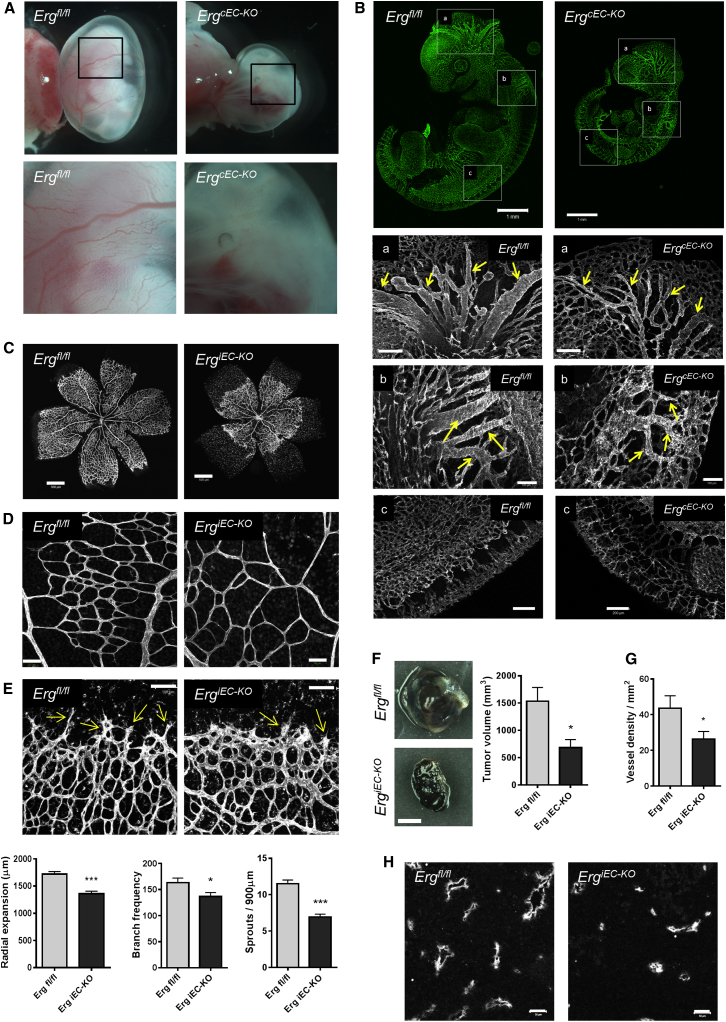
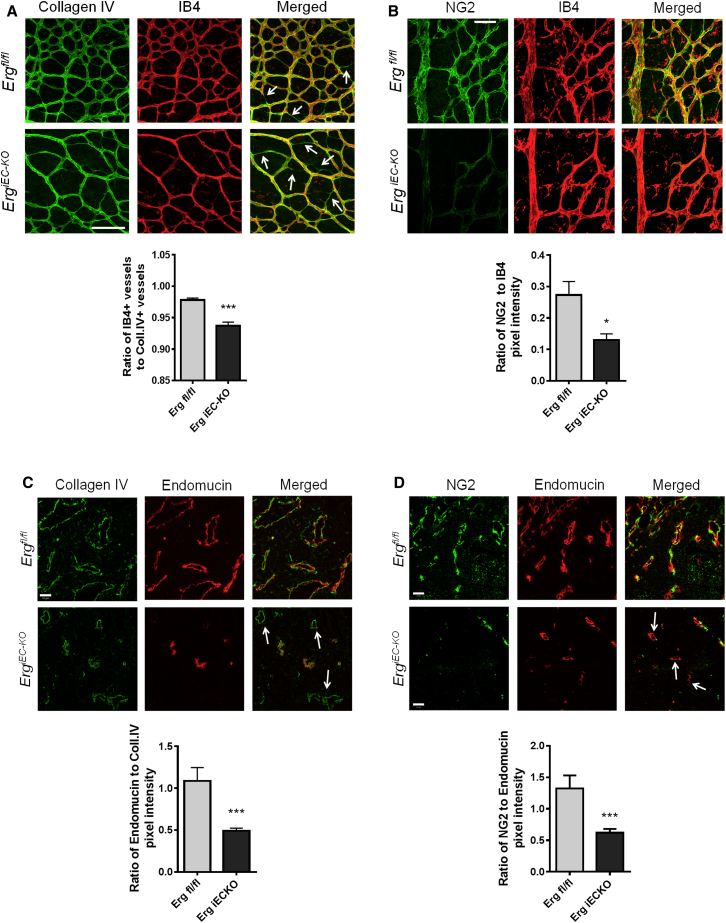
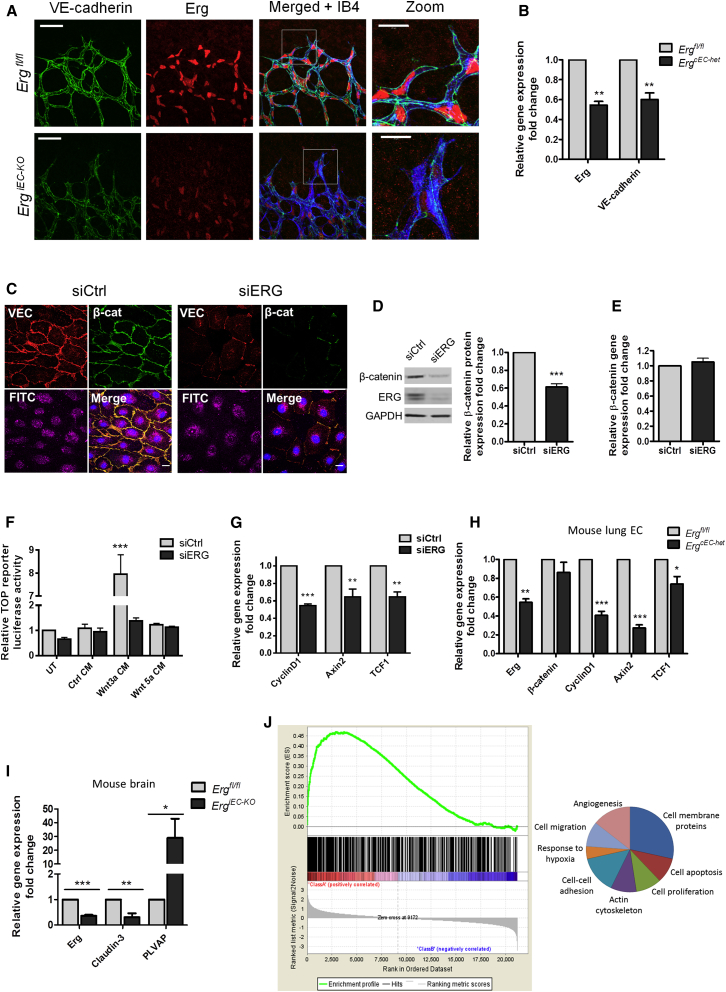
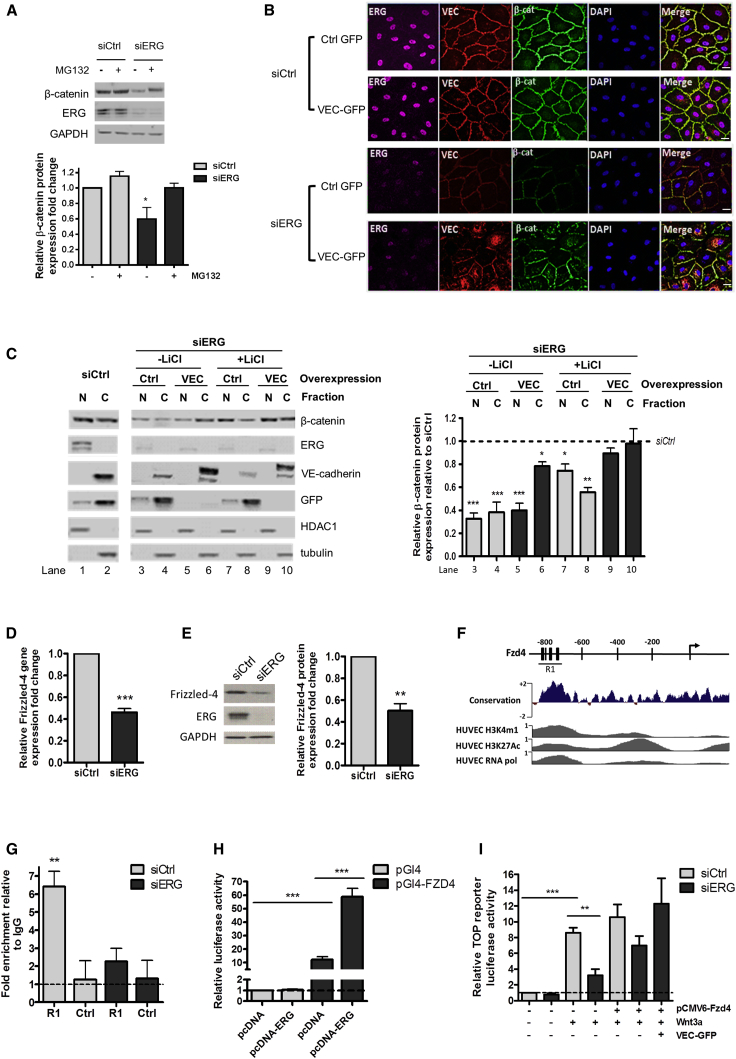
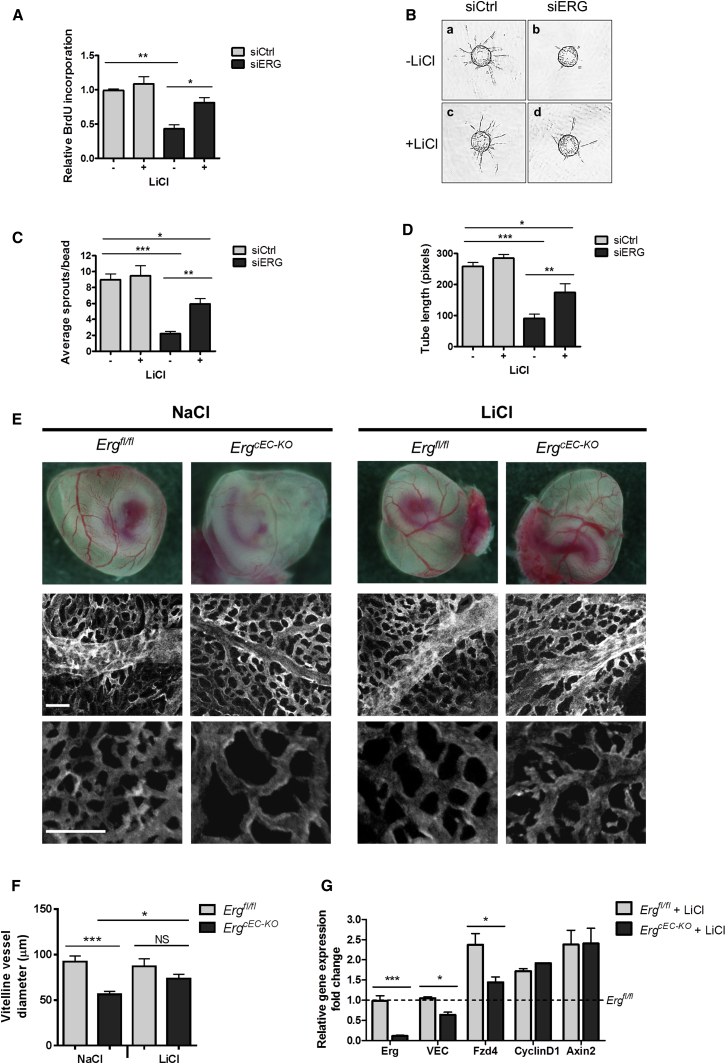
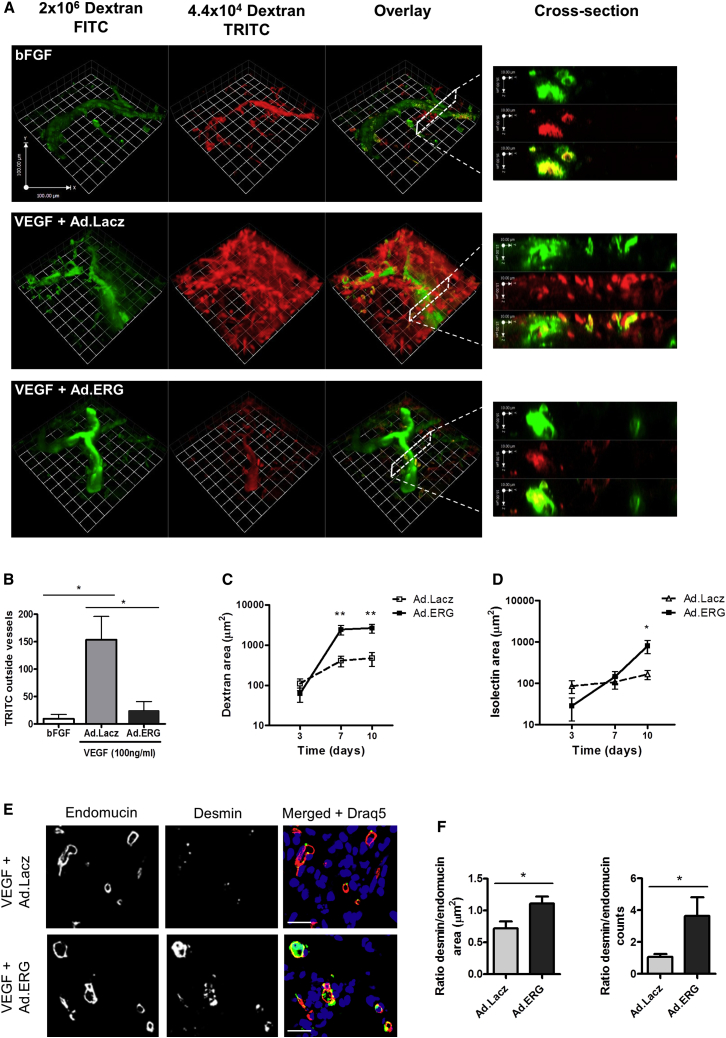
Blood vessel stability is essential for embryonic development; in the adult, many diseases are associated with loss of vascular integrity. The ETS transcription factor ERG drives expression of VE-cadherin and controls junctional integrity. We show that constitutive endothelial deletion of ERG (Erg(cEC-KO)) in mice causes embryonic lethality with vascular defects. Inducible endothelial deletion of ERG (Erg(iEC-KO)) results in defective physiological and pathological angiogenesis in the postnatal retina and tumors, with decreased vascular stability. ERG controls the Wnt/β-catenin pathway by promoting β-catenin stability, through signals mediated by VE-cadherin and the Wnt receptor Frizzled-4. Wnt signaling is decreased in ERG-deficient endothelial cells; activation of Wnt signaling with lithium chloride, which stabilizes β-catenin levels, corrects vascular defects in Erg(cEC-KO) embryos. Finally, overexpression of ERG in vivo reduces permeability and increases stability of VEGF-induced blood vessels. These data demonstrate that ERG is an essential regulator of angiogenesis and vascular stability through Wnt signaling.


Figures

None
Graphical abstract
Figure 1
Figure 1
ERG Is Required for Vascular Development, Physiological Postnatal Angiogenesis, and Pathological Tumor Angiogenesis (A) Representative whole mount images of E10.5 Ergfl/fl and ErgcEC-KO embryo yolk sacs (magnification × 0.7). Bottom panel shows higher magnification of yolk sacs (magnification × 2). (B) Endomucin staining of blood vessels in E10.5 Ergfl/fl and ErgcEC-KO embryos; scale bars, 1 mm. Higher magnification of embryos shows vessel detail in the head region (panels a and b; scale bars, a, 200 μm and scale bars, b, 100 μm) and the trunk (panel c, scale bar, 200 μm). (C) Isolectin B4 staining of postnatal day 6 retinas from Ergfl/fl and ErgiEC-KO mice, showing vascular progression, scale bar, 500 μm; quantification (n = 6). (D) Vascular density of isolectin B4 stained branches in the central plexus, scale bar, 50 μm; quantification (n = 6). (E) EC sprouts at the angiogenic front (arrows), scale bar, 100 μm; quantification (n = 6). (F) Representative images of B16F0 tumors which were grown for 14 days on adult ErgiEC-KO and Ergfl/fl mice, scale bar, 2 mm; tumor volume was quantified (n = 6). (G and H) Panels show endomucin staining of blood vessels in B16F0 tumors and the quantification of the number of endomucin-positive vessels, (n = 6), scale bar, 50 μm. All graphical data are ± SEM, p < 0.05, and ∗∗∗p < 0.001. See also Figure S1.
Figure 2
Figure 2
ERG Controls Vascular Remodeling (A) Collagen IV (green) and isolectin B4 (IB4, red) staining of ErgiEC-KO and Ergfl/fl P6 retinal vessels. Arrows show empty collagen IV sleeves, quantification of number of vessels, (n = 4). (B) NG2-positive pericytes (green) associated with isolectin B4 labeled retinal vessels (red) from ErgiEC-KO and Ergfl/fl mice; quantification of pixel intensity, (n = 4). (C) Sections from B16F0 tumors grown on adult ErgiEC-KO and Ergfl/fl mice were stained for collagen IV (green) and endomucin (red); quantification of pixel intensity, (n = 3). Arrows show empty collagen IV sleeves. (D) Tumor sections from ErgiEC-KO and Ergfl/fl mice were stained for NG2 (green) and endomucin (red); quantification of pixel intensity, (n = 3). Arrows show NG2-negative, endomucin-positive vessels. Scale bars, 100 μm (A), scale bars, 50 μm (B–D). All graphical data are ± SEM, p < 0.05, and ∗∗∗p < 0.001. See also Figure S2.
Figure 3
Figure 3
Endothelial Canonical Wnt Signaling and β-Catenin Stability Are Regulated by ERG (A) Staining for VE-cadherin (green), ERG (red), and isolectin B4 (IB4, blue) in ErgiEC-KO and Ergfl/fl P6 retinas. Scale bar, 50 μm; zoom, 20 μm. (B) Relative mRNA expression of Erg and VE-cadherin in primary ErgcEC-het mouse lung EC compared to control (n = 6). (C) β-catenin (β-cat; green) and VE-cadherin (VEC; red) staining of FITC-conjugated siCtrl and siERG (FITC; purple) treated HUVEC (n = 3). Scale bar, 20 μm. (D and E) (D) Western blot and (E) qPCR analysis of β-catenin expression in control (siCtrl) and ERG-deficient (siERG) HUVEC (n = 4). (F) TCF reporter activity (TOP) in control and ERG-deficient cells treated with control (Ctrl), Wnt3a, or Wnt5a conditioned medium (CM); (n = 3). (G) qPCR of downstream β-catenin target gene expression in control and ERG-deficient HUVEC: Cyclin D1, Axin-2, and TCF-1 (n = 4). (H) mRNA expression of Erg, β-catenin, and its target genes Cyclin D1, Axin-2, and TCF-1 in primary ErgcEC-het mouse lung EC compared to control (n = 6). (I) qPCR analysis of total brain mRNA from control and ErgiEC-KO mice for Erg, Claudin-3, and PLVAP. (J) GSEA shows enrichment and significant correlation (normalized enrichment score, 2.46; p < 0.001) between genes downregulated in β-catenin siRNA-treated HPAEC (green curve) (Alastalo et al., 2011) and the ranked list of genes downregulated by ERG inhibition in HUVEC (Birdsey et al., 2012). Functional classification of the shared genes identified by GSEA was carried out using DAVID analysis (right). The functional categories shown displayed significant enrichment scores (p < 0.01). All graphical data are ± SEM, p < 0.05, ∗∗p < 0.01, and ∗∗∗p < 0.001. See also Figure S3.
Figure 4
Figure 4
ERG Controls β-Catenin Stability through VE-Cadherin- and Wnt-Dependent Mechanisms (A) Western blot of β-catenin expression in control and ERG-deficient cells treated in presence or absence of MG132 (n = 4). (B) ERG (magenta), VEC (red), β-cat (green), and DAPI (blue) staining of control and ERG-deficient HUVEC transduced with GFP-tagged control (Ctrl-GFP) or VE-cadherin (VEC-GFP) adenovirus. Scale bar, 20 μm. (C) Western blot (left) and quantification (right) of β-catenin expression in nuclear/cytoplasmic fractions of ERG-deficient HUVEC transduced with GFP or VEC-GFP adenovirus in presence or absence of LiCl. For normalization, tubulin was used as a cytoplasmic control and HDAC1 as a nuclear marker (n = 3). (D and E) (D) qPCR and (E) western blot analysis of Fzd4 expression in control and ERG-deficient cells (n = 3). (F) There are three putative ERG binding sites (black bars) located within the Fzd4 locus upstream of the transcription start site (arrow); sequence conservation between 100 vertebrates is shown across this region. ENCODE ChIP-seq data profiles for H3K4me1, H3K27Ac, and RNA polymerase II indicate open chromatin and active transcription. Location of qPCR amplicon covering region R1 is indicated. (G) ChIP-qPCR using primers to region R1 on ERG-bound chromatin from HUVEC treated with siCtrl or siERG. Primers for a downstream region within the Fzd4 gene were used as a negative control. Data are shown as fold change over IgG (n = 3). (H) Luciferase reporter assay, an ERG cDNA expression plasmid (pcDNA-ERG), or an empty expression plasmid (pcDNA) were cotransfected with a Fzd4 promoter-luciferase construct (pGl4-Fzd4) in HUVEC and luciferase activity was measured. Values are represented as the fold change in relative luciferase activity over the empty pGL4 vector alone. (I) TCF reporter (TOP) activity in control and ERG-deficient HUVEC treated with rWnt3a. Cells were transfected with control pCMV6 or pCMV6-Fzd4 plasmids and transduced with VEC-GFP adenovirus (n = 3). All graphical data are ± SEM, p < 0.05, ∗∗p < 0.01, and ∗∗∗p < 0.001. See also Figure S4.
Figure 5
Figure 5
ERG Regulates Angiogenesis through Wnt/β-Catenin Signaling (A) In vitro Brdu incorporation in control and ERG-deficient HUVEC treated in presence or absence of LiCl (n = 4). (B–D) (B) Representative images of EC sprouts on fibrin gel beads using siCtrl or siERG-treated HUVEC in the presence or absence of LiCl; (C) quantification of numbers of sprouts; and (D) tube length (n = 20). (E) (Top) Representative whole mount images of E10.5 Ergfl/fl and ErgcEC-KO embryo yolk sacs from pregnant female mice treated with either NaCl (left) or LiCl (right) at E8.5 and E9.5. Scale bar, 1 mm (n = 5). (Middle and bottom panels) Endomucin staining of yolk sac vasculature; scale bar, 100 μm. (F) Quantification of yolk sac vitelline vessel diameter. (G) qPCR analysis of LiCl-treated Ergfl/fl and ErgcEC-KO embryo yolk sacs. Data are expressed as fold change versus NaCl-treated Ergfl/fl and are ± SEM from at least three mice per group. All graphical data are ± SEM, p < 0.05, ∗∗p < 0.01, and ∗∗∗p < 0.001. See also Figure S5.
Figure 6
Figure 6
ERG Stabilizes Angiogenesis In Vivo Matrigel containing bFGF or VEGF with adenovirus expressing either Lacz (Ad.Lacz) or ERG (Ad.ERG) was injected into C57BL6 mice. There were two labeled dextran molecules of different molecular weights, 2×10⁶MW (FITC, green) and 4.4×10⁴ MW (TRITC, red), that were injected intravenously 15 min prior to harvesting plugs. (A) 3D rendering of confocal microscopy images of whole-mount Matrigel plugs perfused with the dextran tracers. Cross sectioning through neovessels (right) shows localization of the tracers. (B) Vessel permeability was quantified by measuring the amount of dextran-TRITC present outside of the dextran-FITC positive vessels, arbitrary units (n = 3). (C) Perfused vessels were quantified by measuring the area of dextran-FITC within the Matrigel plug after 3, 7, and 10 days (n = 4). (D) Vessel density was quantified by measuring the area of isolectin B4 within the Matrigel plug after 3, 7, and 10 days (n = 4). (E) Endomucin (red), desmin-positive pericytes (green), and Draq5 (blue) staining of cryosections from Matrigel plugs implanted for 7 days; scale bar, 20 μm. (F) Quantification of pericyte coverage, pixel intensity (n = 8). All graphical data are ± SEM, p < 0.05, and ∗∗p < 0.01. See also Figure S6.

References

    1. Alastalo T.P., Li M., Perez Vde.J., Pham D., Sawada H., Wang J.K., Koskenvuo M., Wang L., Freeman B.A., Chang H.Y., Rabinovitch M. Disruption of PPARγ/β-catenin-mediated regulation of apelin impairs BMP-induced mouse and human pulmonary arterial EC survival. J. Clin. Invest. 2011;121:3735–3746. - PMC - PubMed
    1. Baltzinger M., Mager-Heckel A.M., Remy P. Xl erg: expression pattern and overexpression during development plead for a role in endothelial cell differentiation. Dev. Dyn. 1999;216:420–433. - PubMed
    1. Birdsey G.M., Dryden N.H., Amsellem V., Gebhardt F., Sahnan K., Haskard D.O., Dejana E., Mason J.C., Randi A.M. Transcription factor Erg regulates angiogenesis and endothelial apoptosis through VE-cadherin. Blood. 2008;111:3498–3506. - PMC - PubMed
    1. Birdsey G.M., Dryden N.H., Shah A.V., Hannah R., Hall M.D., Haskard D.O., Parsons M., Mason J.C., Zvelebil M., Gottgens B. The transcription factor Erg regulates expression of histone deacetylase 6 and multiple pathways involved in endothelial cell migration and angiogenesis. Blood. 2012;119:894–903. - PubMed
    1. Birney E., Stamatoyannopoulos J.A., Dutta A., Guigó R., Gingeras T.R., Margulies E.H., Weng Z., Snyder M., Dermitzakis E.T., Thurman R.E., ENCODE Project Consortium. NISC Comparative Sequencing Program. Baylor College of Medicine Human Genome Sequencing Center. Washington University Genome Sequencing Center. Broad Institute. Children’s Hospital Oakland Research Institute Identification and analysis of functional elements in 1% of the human genome by the ENCODE pilot project. Nature. 2007;447:799–816. - PMC - PubMed

Publication types

MeSH terms