. 2015 Mar:108:460-75.
doi: 10.1016/j.neuroimage.2014.12.081. Epub 2015 Jan 10.

A DCM study of spectral asymmetries in feedforward and feedback connections between visual areas V1 and V4 in the monkey

Affiliations

A DCM study of spectral asymmetries in feedforward and feedback connections between visual areas V1 and V4 in the monkey

A M Bastos et al. Neuroimage. 2015 Mar.

Abstract

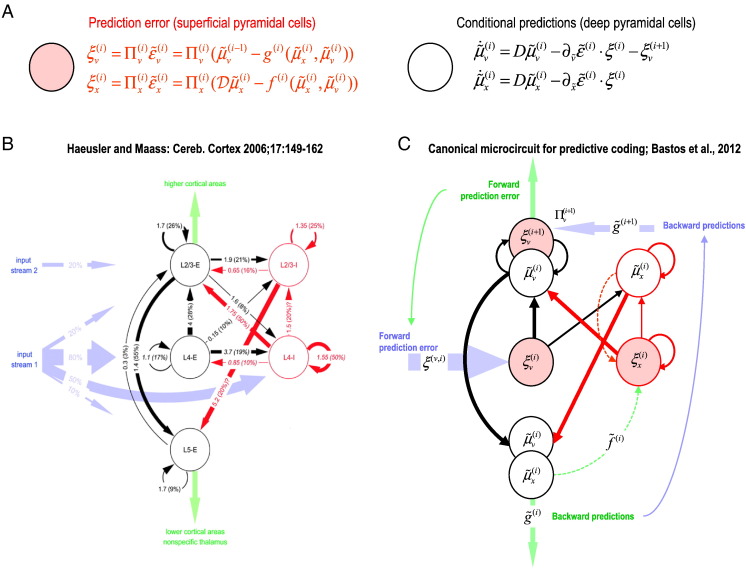
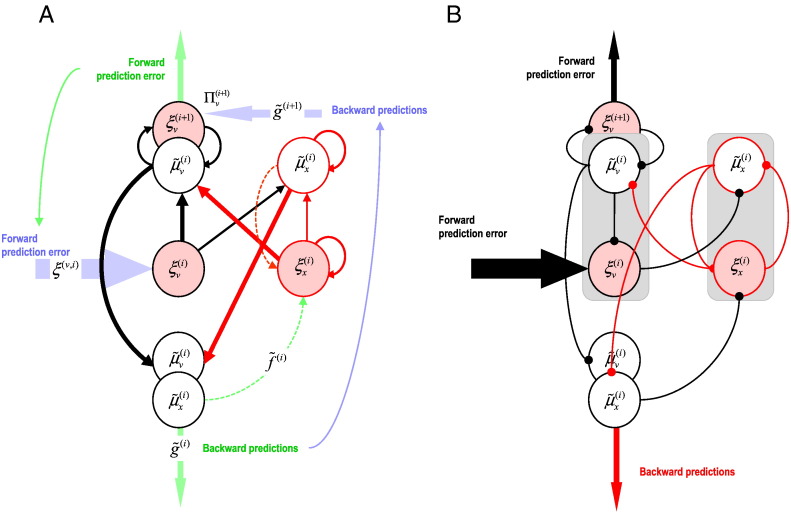
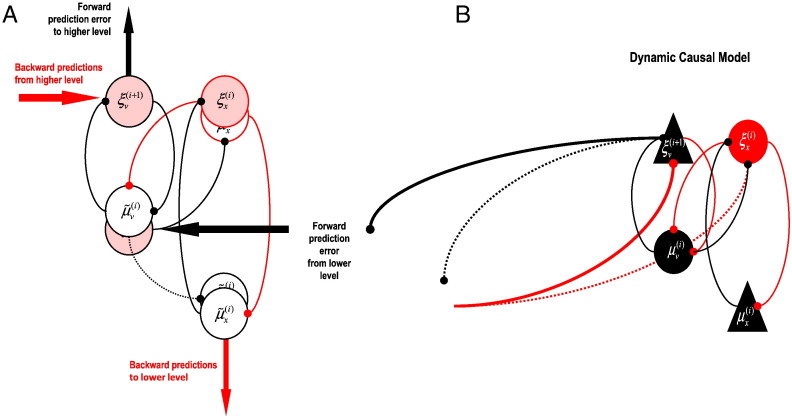
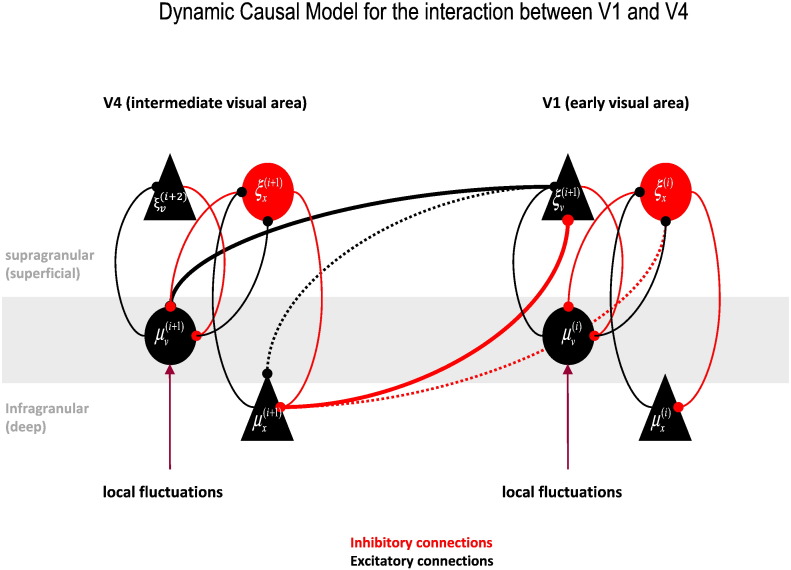
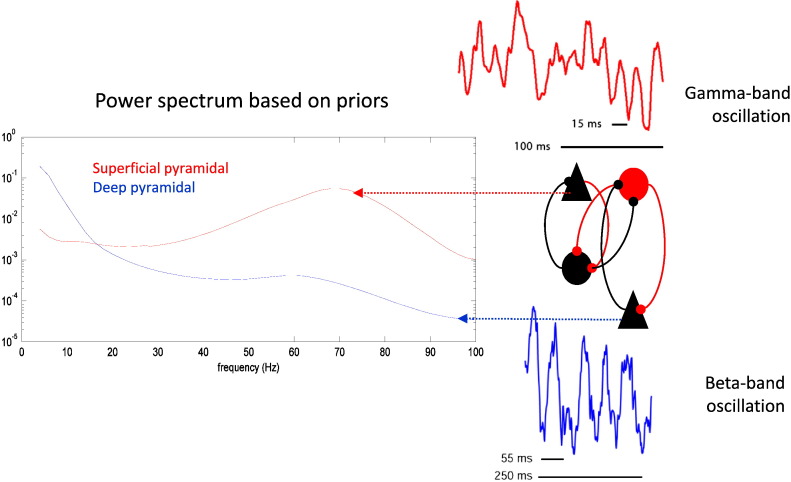
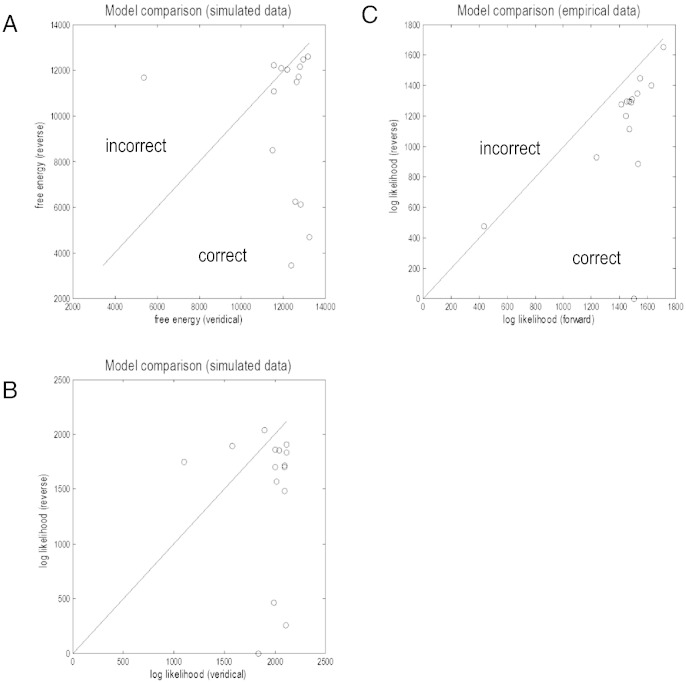
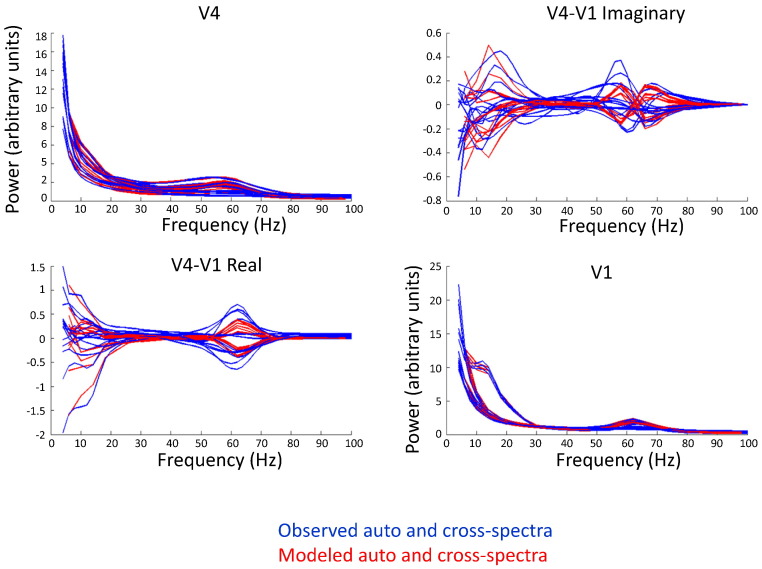
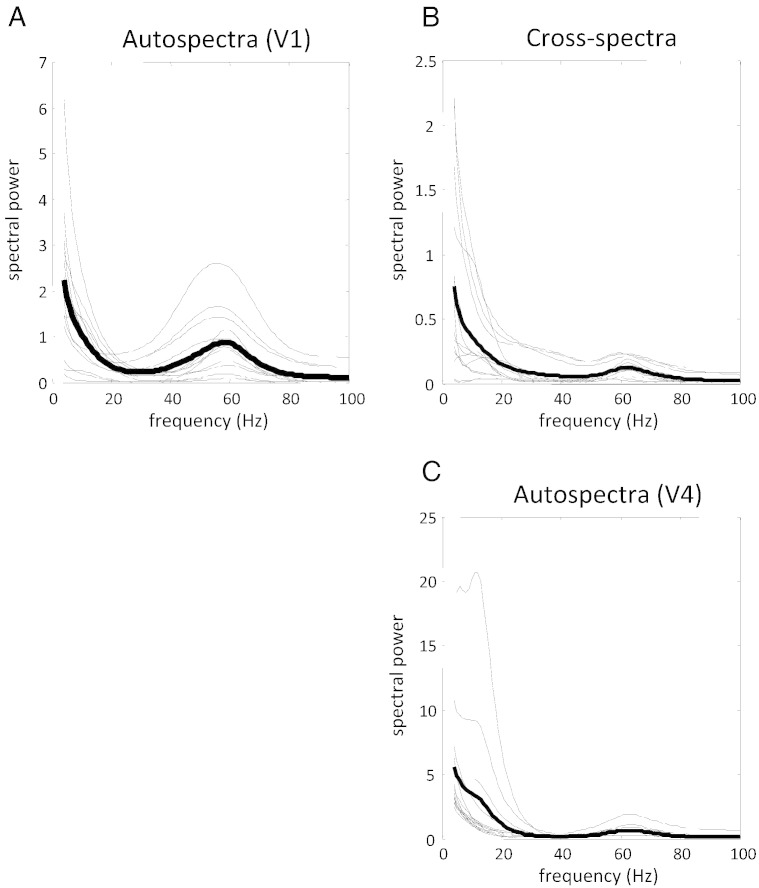
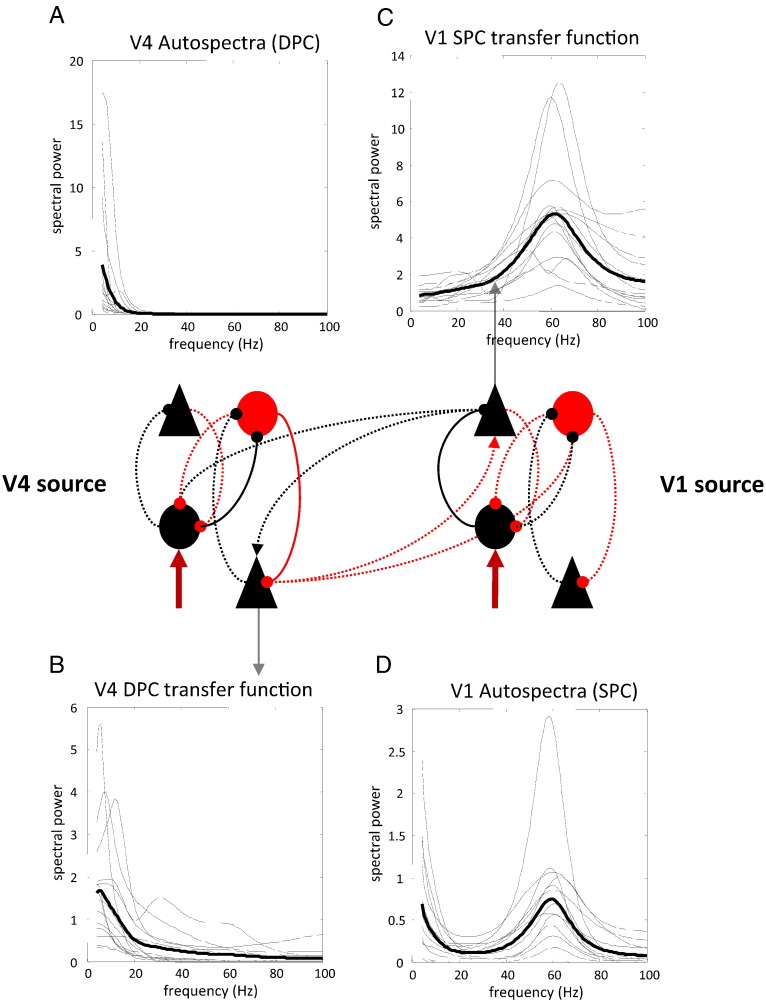
This paper reports a dynamic causal modeling study of electrocorticographic (ECoG) data that addresses functional asymmetries between forward and backward connections in the visual cortical hierarchy. Specifically, we ask whether forward connections employ gamma-band frequencies, while backward connections preferentially use lower (beta-band) frequencies. We addressed this question by modeling empirical cross spectra using a neural mass model equipped with superficial and deep pyramidal cell populations-that model the source of forward and backward connections, respectively. This enabled us to reconstruct the transfer functions and associated spectra of specific subpopulations within cortical sources. We first established that Bayesian model comparison was able to discriminate between forward and backward connections, defined in terms of their cells of origin. We then confirmed that model selection was able to identify extrastriate (V4) sources as being hierarchically higher than early visual (V1) sources. Finally, an examination of the auto spectra and transfer functions associated with superficial and deep pyramidal cells confirmed that forward connections employed predominantly higher (gamma) frequencies, while backward connections were mediated by lower (alpha/beta) frequencies. We discuss these findings in relation to current views about alpha, beta, and gamma oscillations and predictive coding in the brain.

Keywords: Beta oscillations; Computation; Connectivity; Dynamic causal modeling; Gamma oscillations; Neuronal; Synchronization coherence; Transfer functions.


Figures

Fig. 1
Fig. 1
Panel A: The equations in the upper panels define the dependencies between prediction error and conditional estimates (μ) of hidden states (x) and hidden causes (v). These equations have a general form and correspond to generalized predictive coding or Bayesian filtering. The precise form of these equations has been described in many previous communications (see Friston, 2008, for details). In brief, prediction errors are formed at each level of the hierarchy on the basis of conditional estimates at the current level and top-down or lateral predictions based on conditional estimates at the same level or a higher level. These prediction errors are weighted by their estimated precision (inverse variance) and are combined to drive conditional estimates in the same level and the level above. The top-down predictions are formed through nonlinear functions f and g) of conditional estimates that constitute the hierarchical generative model that is implicit in the connectivity. The relevant point for the present study is the form of these equations and the implicit dependencies among the various terms, which require physical (intrinsic and extrinsic) connections in the brain. Panel B: An overview of intrinsic circuitry based on neuroanatomical and functional data based on a review of quantitative studies by Haeusler and Maass (2007). Panel C: Our interpretation of this canonical connectivity establishing the relationship between the quantities in the predictive coding scheme (top panel) and specific cell populations in canonical microcircuits (Bastos et al., 2012 for details).
Fig. 2
Fig. 2
Two pairs of cell populations were combined in moving from the full model (panel A) to the reduced model (panel B). Effectively, we simply absorbed excitatory interneurons in the superficial layers into the excitatory cells of the granular layer, and similarly for inhibitory interneurons.
Fig. 3
Fig. 3
Panel A: The reduced canonical microcircuit of the previous figure, shown in terms of its constituent computational representations. Panel B: The corresponding dynamic causal model, where triangles represent pyramidal cells giving rise to extrinsic connections to other cortical columns and circles represent local interneurons that project only intrinsically. The red circle represents the inhibitory interneuron population, while red lines represent inhibitory connections between populations. Black circles and triangles denote excitatory (either pyramidal or interneuron) populations, and black lines excitatory connections between populations. Note that a few excitatory (in black) populations give rise to inhibitory (in red) connections—we imagine that these are implemented via (unmodeled) inhibitory populations (see text for more details). Not shown in the figure are the self-connections of each population, which are inhibitory.
Fig. 4
Fig. 4
This figure shows the full (intrinsic and extrinsic) circuitry between two areas; here, V1 (a hierarchically earlier area) and V4 (a later area). This model will be used later to model real data. Red connections are inhibitory and black connections are excitatory. Each area receives endogenous drives or fluctuations (arrows) that enter the layer 4 input cells (spiny stellate cells).
Fig. 5
Fig. 5
Priors on the model endow superficial pyramidal cells with greater gamma power than the deep pyramidal cells and deep pyramidal cells with more alpha/beta power than superficial pyramidal cells. The auto spectra on the right were evaluated for a single source, using the prior values for coupling parameters and various synaptic rate and time constants (see Tables 1a–1c).
Fig. 6
Fig. 6
Task design. After touching a bar, the acquisition of fixation, and a pre-stimulus baseline interval of 0.8 s, two isoluminant and isoeccentric stimuli were presented. In each trial, the light grating stripes of one stimulus were slightly tinted yellow, and the stripes of the other stimulus were slightly tinted blue, assigned randomly. After a variable amount of time (0.8–1.3 s), the color of the fixation point changed to blue or yellow, indicating the stimulus with the corresponding color to be the behaviorally relevant (attended) one. We analyzed data averaged across both attention conditions starting 0.3 s after cue onset until the first shape change in one of the stimuli. See Methods for details.
Fig. 7
Fig. 7
Panels A and B: Results of face validity test. The dots correspond to 15 different V1–V4 channel pairs. Cross spectra were simulated using realistic parameters, and inverted using either the correct hierarchical connections or the reversed connections. Resulting free energies (panel A) and accuracies (panel B) are shown for the two models by plotting them against each other. Ideally, we would expect all the dots to fall beneath the diagonal line. We present the differences in free energy in this slightly unusual way to illustrate how they depend upon the absolute values. Usually, when presenting the results of Bayesian model comparison, one would simply show bar charts of relative free energy. These free energy differences are the vertical distance of any point from the identity line. In the current format, one can see that incorrect differences are limited to data sets with a smaller free energy or log evidence. One should not over interpret this because the evidence for different models should always pertain to the same data. However, given that the data sets, we used were of the same cardinality, the variation in log evidence may reflect something about data quality. Finally, note that the log likelihood is a measure of accuracy (panel B). This means that the differences between panels A and B can be attributed to complexity. Panel C: Results of predictive validity test, using the same format as the previous panels except the results use real data and test whether the model has more evidence for the correct compared to incorrect pattern of connectivity. The dots correspond to 15 different V1–V4 channel pairs. Cross spectra were fitted with either the correct connectivity (forward projections from V1 to V4, backward projections from V4 to V1) or reversed connectivity (forward projections from V4 to V1, backward projections from V1 to V4), and the resulting model accuracies are shown.
Fig. 8
Fig. 8
Auto and cross spectra derived from model fits (in red) and neurophysiological data (in blue) for all 15 V1–V4 channel pairs. The V1 and V4 power fits are plotted on the diagonal, whereas the off-diagonal plots represent the cross terms of the cross spectral density matrix—the real part is shown in the bottom left corner, and the imaginary part is shown on the upper right corner.
Fig. 9
Fig. 9
Using conditional parameter estimates from the correct models, here we plot the source-specific power spectra of V1 (panel A), V4 (panel C), and the absolute value of their cross spectra (panel B) after removing the (modeled) effects of channel-specific and -unspecific noise.
Fig. 10
Fig. 10
Using conditional parameter estimates from the correct models, this figure shows the source-specific power spectra of the superficial cells of V1 (Panel D) and the deep pyramidal cells of V4 (Panel A). The corresponding transfer functions are shown in the panel C and panel B. These correspond to the transfer functions between local input and superficial pyramidal cells in the lower area (V1) and deep pyramidal cells in the higher area (V4). The intrinsic connections mediating the transfer of power from local fluctuations to the pyramidal cells elaborating forward and backward connections are shown as solid lines (and other connections as dotted lines).

References

    1. Alink A., Schwiedrzik C.M., Kohler A., Singer W., Muckli L. Stimulus predictability reduces responses in primary visual cortex. J. Neurosci. 2010;30:2960–2966. - PMC - PubMed
    1. Arnal L.H., Wyart V., Giraud A.-L. Transitions in neural oscillations reflect prediction errors generated in audiovisual speech. Nat. Neurosci. 2011;14:797–801. - PubMed
    1. Barone P., Batardiere A., Knoblauch K., Kennedy H. Laminar distribution of neurons in extrastriate areas projecting to visual areas V1 and V4 correlates with the hierarchical rank and indicates the operation of a distance rule. J. Neurosci. 2000;20:3263. - PMC - PubMed
    1. Bastos A., Bosman C., Schoffelen J.M., Oostenveld R., Fries Interareal directed interactions and their modulation by selective attention assessed with high density electrocorticography in monkey. Front. Hum. Neurosci. 2011;5
    1. Bastos A.M., Usrey W.M., Adams R.A., Mangun G.R., Fries P., Friston K.J. Canonical microcircuits for predictive coding. Neuron. 2012;76:695–711. - PMC - PubMed

Publication types

LinkOut - more resources