. 2015 May;172(10):2557-72.
doi: 10.1111/bph.13079. Epub 2015 Mar 17.

Glucose modulation induces reactive oxygen species and increases P-glycoprotein-mediated multidrug resistance to chemotherapeutics

Affiliations

Glucose modulation induces reactive oxygen species and increases P-glycoprotein-mediated multidrug resistance to chemotherapeutics

N A Seebacher et al. Br J Pharmacol. 2015 May.

Abstract

Background and purpose: Cancer cells develop resistance to stress induced by chemotherapy. In tumours, a considerable glucose gradient exists, resulting in stress. Notably, hypoxia-inducible factor-1 (HIF-1) is a redox-sensitive transcription factor that regulates P-glycoprotein (Pgp), a crucial drug-efflux transporter involved in multidrug resistance (MDR). Here, we investigated how glucose levels regulate Pgp-mediated drug transport and resistance.

Experimental approach: Human tumour cells (KB31, KBV1, A549 and DMS-53) were incubated under glucose starvation to hyperglycaemic conditions. Flow cytometry assessed reactive oxygen species (ROS) generation and Pgp activity. HIF-1α, NF-κB and Pgp expression were assessed by reverse transcriptase-PCR and Western blotting. Fluorescence microscopy examined p65 distribution and a luciferase-reporter assay assessed HIF-1 promoter-binding activity. The effect of glucose-induced stress on Pgp-mediated drug resistance was examined after incubating cells with the chemotherapeutic and Pgp substrate, doxorubicin (DOX), and performing MTT assays validated by viable cell counts.

Key results: Changes in glucose levels markedly enhanced cellular ROS and conferred Pgp-mediated drug resistance. Low and high glucose levels increased (i) ROS generation via NADPH oxidase 4 and mitochondrial membrane destabilization; (ii) HIF-1 activity; (iii) nuclear translocation of the NF-κB p65 subunit; and (iv) HIF-1α mRNA and protein levels. Increased HIF-1α could also be due to decreased prolyl hydroxylase protein under these conditions. The HIF-1α target, Pgp, was up-regulated at low and high glucose levels, which led to lower cellular accumulation of Pgp substrate, rhodamine123, and greater resistance to DOX.

Conclusions and implications: As tumour cells become glucose-deprived or exposed to high glucose levels, this increases stress, leading to a more aggressive MDR phenotype via up-regulation of Pgp.


Figures

Figure 1
Figure 1
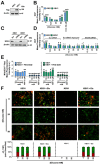
Changes in glucose levels lead to NOX4-mediated ROS generation, mitochondrial superoxide generation and mitochondrial membrane hyperpolarization (A) Western blot showing Pgp protein expression in KB31 and KBV1 cells. (B) Incubating KB31 and KBV1 cells for 30 min/37°C with low (0 and 12.5 mM) or high (50 mM) glucose compared with normal glucose (25 mM) increases DCF fluorescence. (C) Western blot showing NOX4 protein expression after silencing with NOX4-siRNA compared with Scr-siRNA-treated KB31 and KBV1 cells. (D) Incubation for 30 min/37°C with apocynin (50 μM), a NOX inhibitor, and transient silencing of NOX4, using NOX4-siRNA, decreases DCF fluorescence. (E) Mitochondrial superoxide production measured by MitoSOX Red (5 μM) increases after the glucose treatments in (B). Upon incubation of cells with PEG-SOD (1000 U·mL−1) and the glucose treatments, MitoSOX was markedly decreased compared with the respective glucose treatments alone. (F) Increased red JC-1 fluorescence after a 30 min/37°C incubation with low (0 mM) or high (50 mM) glucose compared with normal glucose (25 mM). JC1 fluorescence was quantified and expressed as a ratio (red /green fluorescence. Data in (A, C) are typical blots from five experiments. Results in (B, D, E) are mean ± SD (n = 5). *P < 0.05, **P < 0.01, ***P < 0.001, versus control (25 mM glucose), #P < 0.05, ###P < 0.001, P < 0.05 versus respective glucose treatment alone in (D) Scr-siRNA cells, or (E) without PEG-SOD in KB31 or KBV1 cells. Data in (B, D, E) were normalized to the control (glucose; 25 mM) for both cell types. In (B, D, E), mean fluorescence intensity is presented as arbitrary units (a.u.). Immunofluorescence photographs in (F) are representative of three experiments and the quantified fluorescence intensity is presented as mean ± SD (n = 3). Scale bar: 50 μm.
Figure 2
Figure 2
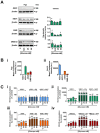
Changes in glucose levels increase Pgp-expression and function. KB31, KBV1, A549 and DMS-53 cells were examined for: (A) Pgp protein expression assessed by Western blotting following a change from the normal glucose level (25 mM) to low (0 or 12.5 mM) or high (50 mM) glucose after a 24 h/37°C incubation; (B)(i) Cell plasma membrane Pgp measured by flow cytometry under conditions of normal glucose (25 mM); (ii) Pgp function analysis by flow cytometric measurement of the intracellular accumulation of Rh123 in normal glucose (25 mM) over a 30 min/37°C incubation. (C) Decreased intracellular Rh123-accumulation following a 24 h/37°C incubation with low or high glucose. The Pgp inhibitor, Ela (0.2 μM), or antioxidant NAC (5 mM), increased cellular accumulation of Rh123 in all treatment conditions relative to its respective glucose treatment alone in KBV1, A549 and DMS-53 cells. The results in (A) are typical of three experiments, densitometry is mean ± SD (n = 3). *P < 0.05, relative to normal glucose (25 mM). For (B), mean fluorescence intensity is presented as arbitrary units (a.u.). Results in (C) are mean ± SD (n = 5). *P < 0.05, **P < 0.01, ***P < 0.001, versus normal glucose (25 mM), #P < 0.05, ###P < 0.001, P < 0.05, ††P < 0.01, †††P < 0.001 versus respective glucose treatment alone.
Figure 3
Figure 3
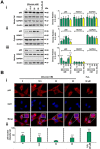
Changes in glucose levels induce translocation of the activated NF-κB p65 subunit into the nucleus. Analysis of KBV1 cells for (A) p65 expression in: (i) whole cells; (ii) the cytosolic fraction; and (iii) nuclear fraction, demonstrates a decrease in cytosolic p65 protein levels with a simultaneous increase in nuclear p65 protein accumulation after a 24 h/37°C incubation with low (0 and 12.5 mM) or high (50 mM) glucose. Fraction purity was confirmed with HDAC1 (nuclear marker) and GAPDH (cytosolic marker). (B) Immunofluorescence detection of p65 co-localization with the nuclear marker, DAPI, in KBV1 cells following a 4 h/37°C incubation with low, normal and high glucose levels. Co-localization of p65 with the nuclear marker, DAPI, was quantified as fluorescence intensity per cell. The results in (Ai–iii) are typical of three experiments, while densitometry is mean ± SD (n = 3). *P < 0.05, **P < 0.01, ***P < 0.001 relative to normal glucose (25 mM). Immunofluorescence photographs in (Bi) are representative of three experiments and the quantified fluorescence intensity in (Bii) is mean ± SD (n = 3). Scale bar: 10 μm in each panel.
Figure 4
Figure 4
Changes in glucose levels regulate the mRNA and protein levels of HIF-1α, MDR1 (Pgp) and GLUT1, and the protein levels of PHD2. Analysis of KBV1 cells show: (A) increased HIF-1α- and Pgp- (MDR1) mRNA expression via RT-PCR after a 24 h/37°C incubation with low (0 mM), normal (25 mM), or high (50 mM) glucose levels. GLUT1 mRNA expression was inversely proportional to glucose levels. (B) Increased Pgp and HIF-1α protein expression measured by Western blot after a 24 h/37°C incubation with low (0 and 12.5 mM), normal (25 mM) and high (50 mM) glucose. GLUT1 protein levels were inversely proportional to glucose levels. PHD2-protein expression was decreased after varying glucose levels from normal glucose (25 mM). The antioxidant, NAC (5 mM) or the NOX inhibitor, apocynin (50 μM) prevented the glucose variation-induced regulation of HIF-1α, Pgp, GLUT1 and PHD2 expression. H2O2 and AM (10 μM) were used as positive controls for the effects of ROS. (C) HIF-1α promoter-binding activity under varying glucose levels (see ‘Test’). The results in (A, B) are typical of three experiments with the densitometry being mean ± SD (n = 3). *P < 0.05, **P < 0.01, ***P < 0.001 relative to normal glucose (25 mM). The results in (C) are presented as arbitrary units (a.u.) and are mean ± SD (n = 3). **P < 0.01, ***P < 0.001, relative to the respective control (i.e., normal glucose at 25 mM).
Figure 5
Figure 5
Glucose-induced stress increases cellular resistance to the chemotherapeutic and Pgp-substrate, DOX. Cellular proliferation of: (A) KB31, (B) KBV1, (C) A549 and (D) DMS-53 cells in culture using medium supplemented with low (0 and 12.5 mM), normal (25 mM), or high glucose (50 mM) concentrations for 24 h/37°C before and during the incubation with DOX (24 h/37°C). Studies were performed in the presence or absence of the Pgp inhibitor Ela (0.2 μM). Results in (A–D) are mean ± SD (n = 4). *P < 0.05, **P < 0.01, ***P < 0.001, versus normal glucose (25 mM), #P < 0.05, ##P < 0.01, ###P < 0.001 versus respective glucose treatment concentration.
Figure 6
Figure 6
Schematic illustration of the glucose-induced Pgp resistance phenotype observed in this study. Alterations in glucose concentrations induces: (i) production of mitochondrial ROS via primarily the NOX4 enzyme, but also the electron-transport chain; (ii) translocation of NF-κB's active p65 subunit into the nucleus, where it is able to induce transcription of the master transcription factor; HIF-1α; (iii) decreased expression of PHD2, which prevents degradation of HIF-1α via the proteosome; (iv) increased expression of HIF-1, that binds to the hypoxia-response element (HRE) in the MDR1 gene promoter and leads to transcription of Pgp mRNA (MDR1) and its subsequent translation; and (v) increased Pgp on the plasma membrane, which acts as a ‘drug-pump’ to increase efflux of the cytotoxic Pgp substrate, DOX, from the cell. This response induces resistance to this chemotherapeutic.

References

    1. Akhtar N, Ahad A, Khar RK, Jaggi M, Aqil M, Iqbal Z, et al. The emerging role of P-glycoprotein inhibitors in drug delivery: a patent review. Expert Opin Ther Pat. 2011;21:561–576. - PubMed
    1. Alexander SPH, Benson HE, Faccenda E, Pawson AJ, Sharman JL, Spedding M, et al. The Concise Guide to PHARMACOLOGY 2013/14: Transporters. Br J Pharmacol. 2013a;170:1706–1796. - PMC - PubMed
    1. Alexander SPH, Benson HE, Faccenda E, Pawson AJ, Sharman JL, Spedding M, et al. The Concise Guide to PHARMACOLOGY 2013/14: Enzymes. Br J Pharmacol. 2013b;170:1797–1867. - PMC - PubMed
    1. Allen JD, van Loevezijn A, Lakhai JM, van der Valk M, van Tellingen O, Reid G, et al. Potent and specific inhibition of the breast cancer resistance protein multidrug transporter in vitro and in mouse intestine by a novel analogue of fumitremorgin C. Mol Cancer Ther. 2002;1:417–425. - PubMed
    1. Annibaldi A, Widmann C. Glucose metabolism in cancer cells. Curr Opin Clin Nutr Metab Care. 2010;13:466–470. - PubMed

Publication types

MeSH terms