. 2015 Jan 14:6:6025.
doi: 10.1038/ncomms7025.

Activating mutations of STAT5B and STAT3 in lymphomas derived from γδ-T or NK cells

Affiliations

Activating mutations of STAT5B and STAT3 in lymphomas derived from γδ-T or NK cells

Can Küçük et al. Nat Commun. .

Abstract

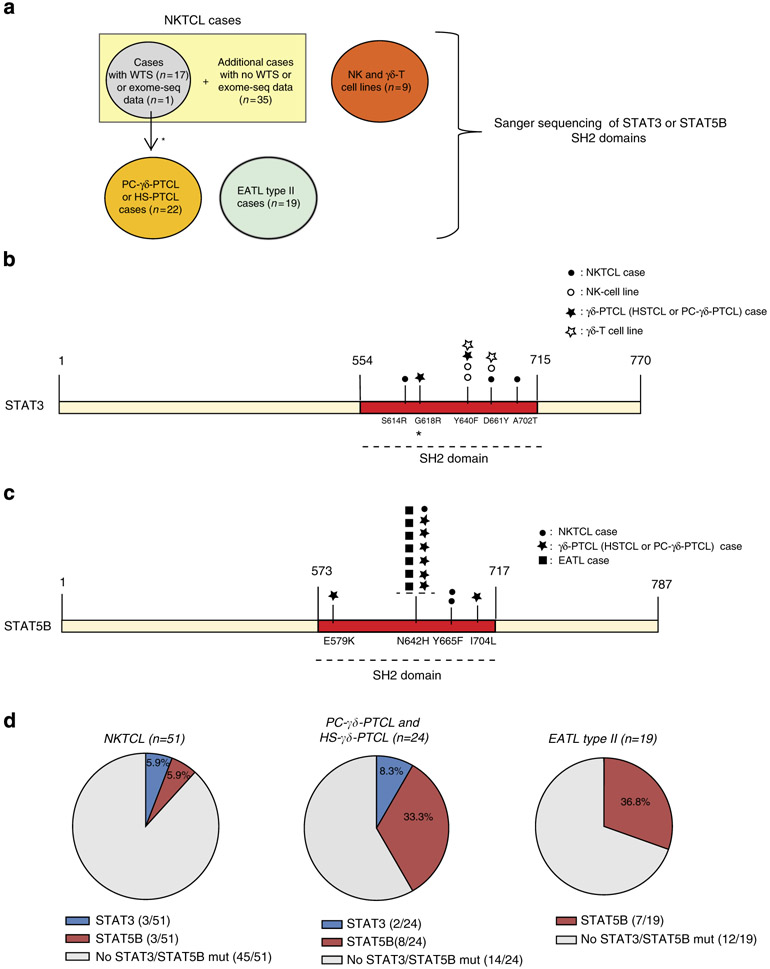
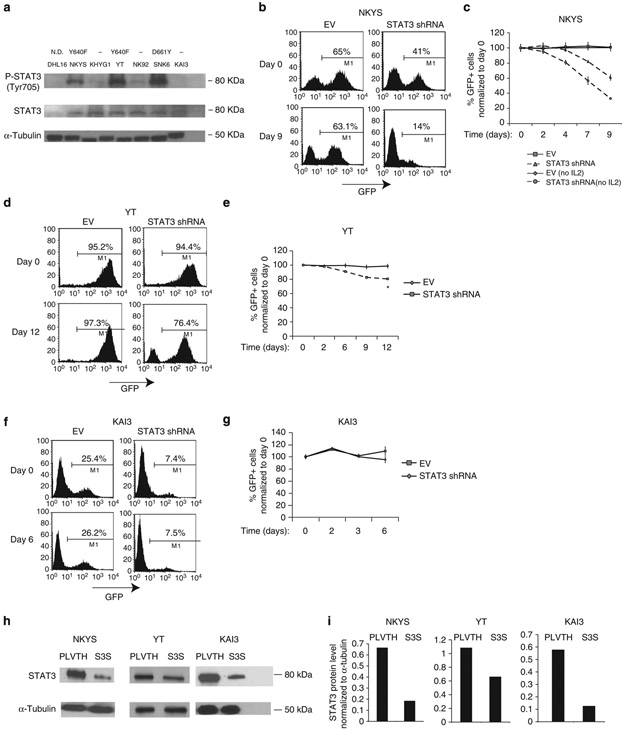
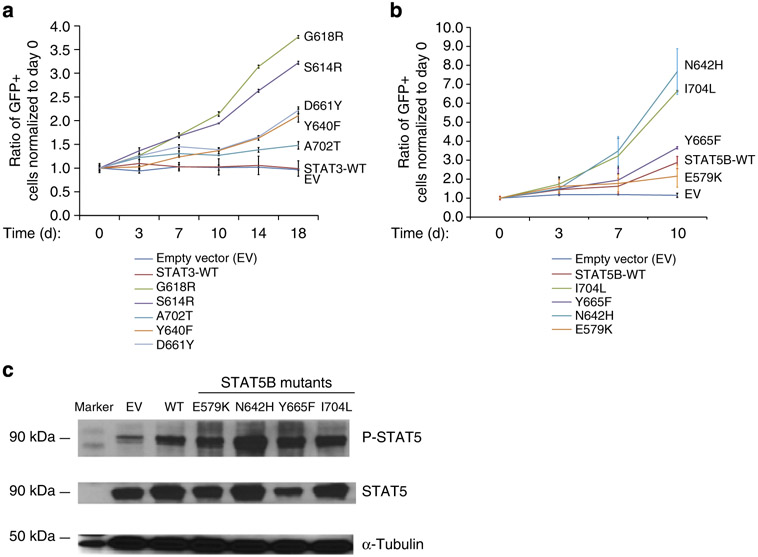
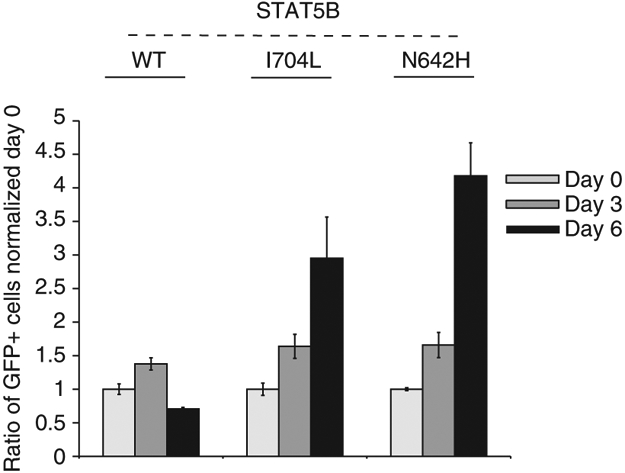
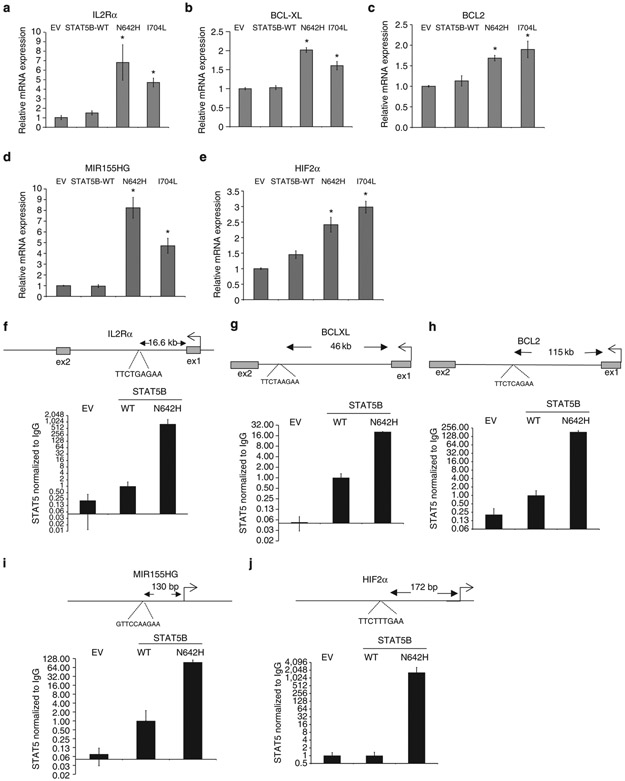
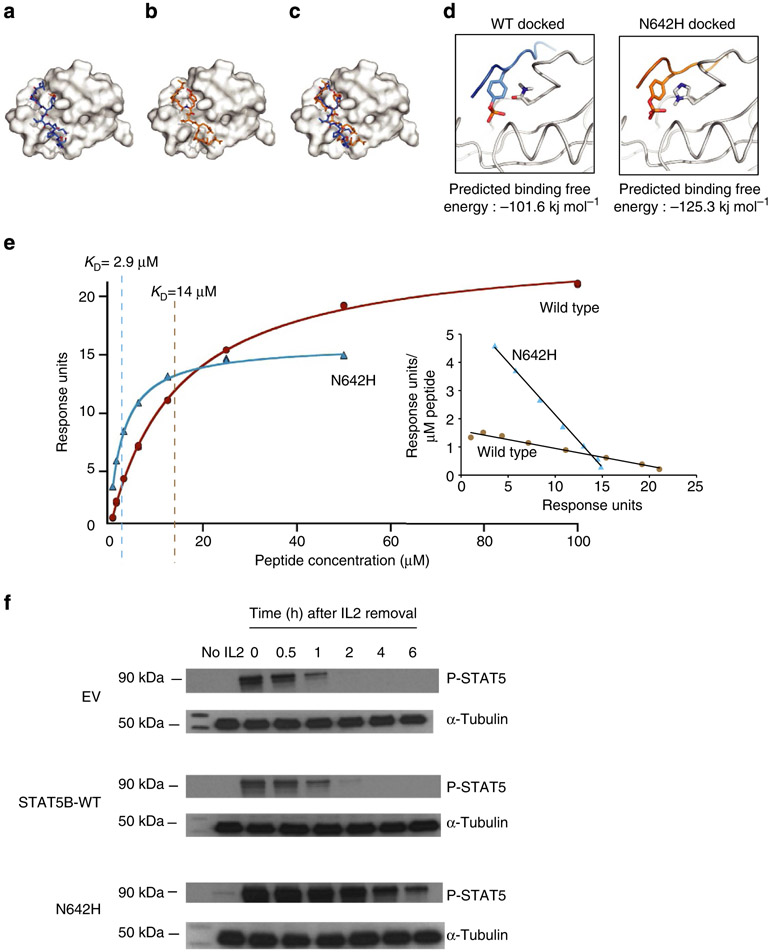
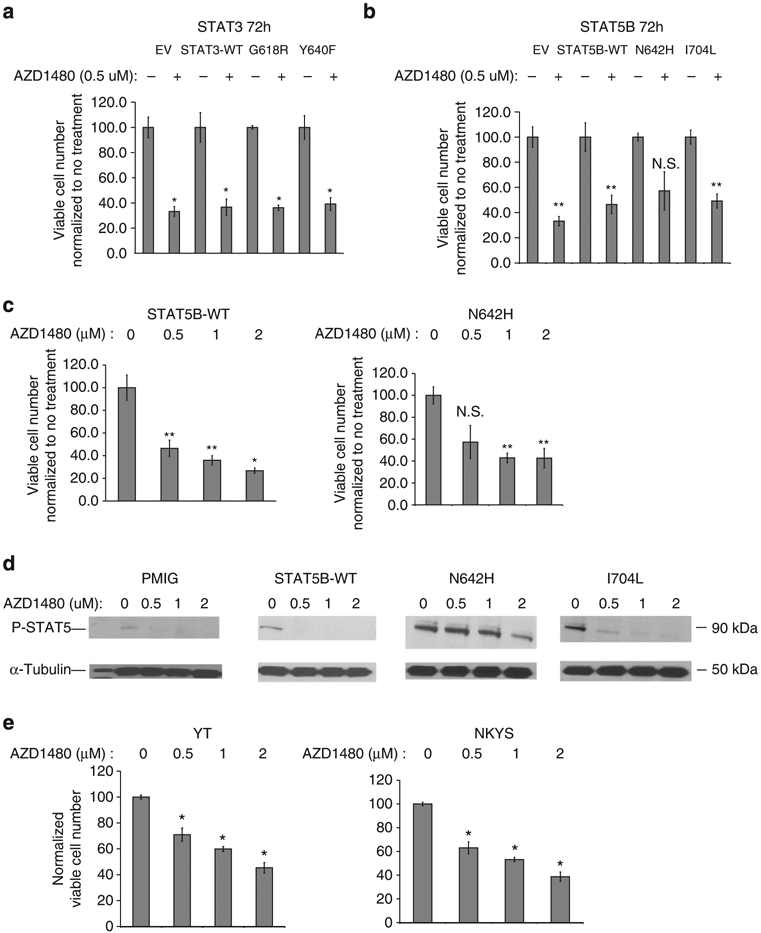
Lymphomas arising from NK or γδ-T cells are very aggressive diseases and little is known regarding their pathogenesis. Here we report frequent activating mutations of STAT3 and STAT5B in NK/T-cell lymphomas (n=51), γδ-T-cell lymphomas (n=43) and their cell lines (n=9) through next generation and/or Sanger sequencing. STAT5B N642H is particularly frequent in all forms of γδ-T-cell lymphomas. STAT3 and STAT5B mutations are associated with increased phosphorylated protein and a growth advantage to transduced cell lines or normal NK cells. Growth-promoting activity of the mutants can be partially inhibited by a JAK1/2 inhibitor. Molecular modelling and surface plasmon resonance measurements of the N642H mutant indicate a marked increase in binding affinity of the phosphotyrosine-Y699 with the mutant histidine. This is associated with the prolonged persistence of the mutant phosphoSTAT5B and marked increase of binding to target sites. Our findings suggest that JAK-STAT pathway inhibition may represent a therapeutic strategy.


Figures

Figure 1∣
Figure 1∣. Activating STAT3 and STAT5B mutations are frequent in lymphomas of NK or γδ-T cell of origin.
(a) The diagram shows the type of mutation analyses performed and the number of tumour samples used for each analysis. The locations of the primers used for PCR and Sanger sequencing of the STAT3 and STAT5B SH2 domains are shown in Supplementary Fig. 1. The location of the mutated nucleotides found in the SH2 domains of STAT3 (b) and STAT5B (c) in tumour cases (NKTCL, γδ-PTCL (PC-γδ-PTCL and HS-γδ-PTCL) or EATL type II) and cell lines (NK and γδ-T cell lines) are shown (not to scale). Mutations of different tumour cases or cell lines are indicated with different symbols over the SH2 domains, and the disease types to which these symbols refer are shown in the upper right corner of the panels. Other than A702T, all STAT3 mutations were reported in LGLL by Koskela et al. and Jerez et al. STAT5B N642H and Y665F mutations were rarely (~1%) observed in LGLL by Rajala et al. (d) The percentages of STAT3 and STAT5B mutations in NKTCL (n = 51), γδ-PTCL (n = 24) or EATL type II cases (n = 19) are shown with piecharts. Apart from the STAT5B Y665F mutation identified using WES, all SNVs identified in this study have been cross-validated on genomic DNA with Sanger sequencing using both forward and reverse primers. *: two NKTCL tumour samples with WTS data was re-classified later as PC-γδ-PTCL due to γδ-TCR expression. One of these two reclassified cases is the sample with the STAT3-G618R mutation.
Figure 2∣
Figure 2∣. NK cell lines with STAT3 mutations show high pY-STAT3 expression and shRNA-mediated knock-down of STAT3 inhibits NK-cell line growth.
(a) Western blotting was performed on whole-cell lysates (WCL) from six NK cell lines using antibodies to phosphotyrosine (Y705)-STAT3 and STAT3. DHL16 cells, which lack STAT3 activation, were used as a negative control. α-Tubulin was used as a control to ensure equal loading of the samples. The names of the cell lines used are indicated above the gel image. The type of the corresponding STAT3 mutation is indicated above the name of the cell lines. (−): No STAT3 mutation; N.D., not determined. (b) Representative flow cytometric plots showing the percentage of GFP+ cells 3 days (day 0) and 12 days (day 9) post transduction of NKYS cells with EV or STAT3 shRNA after removing IL2 from the culture medium at day 0. (c) Quantification of the percentage of GFP+ cells post transduction of NKYS cells with EV or STAT3 shRNA at regular time intervals. In one experiment, cells were cultured in the presence of IL2 (5-7 ng ml−1) until 3 days (day 0) post transduction and then IL2 was removed from the culture medium. In the second experiment, IL2 was always included post transduction of NKYS cells. Each data point is representative of two biological replicates. (d) Representative FACS plots showing the percentage of GFP+ cells of YT cell line transduced with EV or STAT3 shRNA 3 days (day 0) or 15 days (day 12) post transduction. (e) Quantification of the percentage of GFP+ cells by FACS between 3 and 15 days post transduction with EV or STAT3 shRNA. For 1 week before transduction, YT cells were cultured in the presence of IL2. Three days post transduction (day 0), cells were transferred to medium lacking IL2. *: P<0.05, Student’s t-test. (f) Representative FACS plots showing the percentage of GFP+ cells in EV or STAT3 shRNA transduced KAI3 cells. (g) Quantification of the percentage of GFP+ cells after transduction of KAI3 cells with EV or STAT3 shRNA. Three days post transduction (day 0), the percentage of GFP+ cells was determined by flow cytometry, and cells were switched to NK culture medium with reduced IL2 (25 IU ml−1). Data represent means ± s.d. of two biological replicates for panels c,e and g. (h) Western blot images of STAT3 knock-down levels are shown for NKYS, YT and KAI3 cell lines on STAT3 shRNA transduced, GFP+ sorted cells post transduction with the EV (PLVTH) or STAT3 shRNA (S3S). (i) Quantification of the STAT3 protein knock-down levels after normalization to α-Tubulin using the ImageJ program (http://rsb.info.nih.gov/ij/).
Figure 3∣
Figure 3∣. Ectopic expression of STAT3 or STAT5B mutants promotes growth in KAI3 cells under limiting IL2 concentrations.
(a) Quantification of the percentage of GFP+ cells post transduction of KAI3 cells with each STAT3 mutant observed in tumour samples. Transduced cells were cultured in regular IL2 concentrations for 4 days, then switched to limiting (25 IU ml−1) IL2 concentrations. Day 0 = 4 days post transduction. Each data point shows the means ± s.d. of two biological replicates. The average values for the % of GFP+ cells at day 0 were 6.9, 3.2, 6.0, 2.8, 4.1, 4.3 and 3.2% for EV, STAT3-WT, S614R, G618R, Y640F, D661Y or A702T transduced cells, respectively. (b) Quantification of the percentage of GFP+ cells post transduction of KAI3 cells with each STAT5B mutant observed in tumour samples as in a. Means ± s.d. of two independent experiments with replicates are shown (n = 4). The average values for the % of GFP+ cells at day 0 were 4.8, 6.8, 5.9, 5.7, 8.2 and 6.7% for EV, STAT5B-WT, E579K, N642H, Y665F or I704L-mutant transduced cells, respectively. The percentage of GFP+ cells for each sample is normalized to day 0 in both a,b. (c) P-STAT5(Y699) and STAT5 protein expression levels in KAI3 cells transduced with STAT5B mutants are shown by western blot. Six days post transduction, the GFP+ population of STAT5B-mutant transduced cells was isolated by FACS, and then placed into culture medium with limiting (25 IU ml−1) concentrations. Whole-cell lysates were collected 11 days post transduction. One experiment representative of three experiments is shown.
Figure 4∣
Figure 4∣. Ectopic expression of STAT5B I704L or N642H mutants promotes growth of primary human NK cells.
Quantification of the percentage of GFP+ cells post transduction of primary NK cells with STAT5B-WT or each of two STAT5B mutants (I704L or N642H) at 3-day intervals. The percentage of GFP+ cells for each sample is normalized to day 0. Day 0 indicates 5 days post transduction. The average % of GFP+ cells at day 0 was 4.6, 4.9 and 4.8% for STAT5B-WT, N642H or I704L transduced cells, respectively. Data are mean ± s.d. of two biological replicates. Dead cells were stained with 0.5 μM of DAPI (Biolegend, cat. no: 422801) to exclude them from quantification.
Figure 5∣
Figure 5∣. STAT5B target genes are transcriptionally upregulated in STAT5B-mutant transduced cells through direct binding to conserved STAT5 binding sites.
Relative mRNA expression of IL2Rα (a), BCL-XL (b), BCL2 (c), MIR155HG (d) and, HIF2α (e) is shown in control vector or STAT5B-mut transduced cells obtained by sorting GFP+ cells 10 days post transduction, and then culturing for 5 days and 2 days in culture medium with regular or limiting (25 IU ml−1) IL2 concentrations, respectively. Means ± s.d. of two independent experiments (total combined samples = 4) are shown. *P<0.01 compared with WT, Student’s t-test. ChIP-q-PCR results for known STAT5 binding sites are shown for IL2Rα (f), BCL-XL (g), BCL2 (h), MIR1SSHG (i) and HIF2α (j) in EV, STAT5B-WT or STAT5B-N642H transduced KAI3 cells. Data are mean ± s.d. of four replicates. STAT5 pull-down normalized to IgG control as a fold difference compared with STAT5B-WT sample is shown in the y-axis using a log scale. STAT5B consensus sites and their approximate distance to the TSS sites are indicated.
Figure 6∣
Figure 6∣. Three-dimensional modelling and SPR analysis of the N642H mutant shows stronger affinity for the phosphorylated tyrosine Y699.
The phosphorylated STAT5B peptide involved in homodimerization was docked into the SH2 domain of either WT (a) or N642H (b) STAT5B. The overlay of these structures (c) shows little difference in the docking poses. In both cases, the N642 or H642 residue was found to be in close proximity to the phosphorylated tyrosine on the STAT5B peptide (d). The binding energy of these docked structures was calculated for both the WT (−101.5 kJ mol−1) and N642H (−125.3 kJ mol−1). (e) SPR binding isotherms of phosphopeptide with STAT5B-WT (brown circles) and N642 mutant (blue triangles) of a representative experiment is shown. Calculated KD values of 14 and 2.9 μM for STAT5B-WT and N642H mutant, respectively, are indicated by vertical lines for the representative experiment. An inset shows the Scatchard plot of the same data. The experiment was repeated for four times, and the means ± s.d. of KD values for WT and N642H are 15.6 ± 1.4 μM and 3.23 ± 0.33 μM, respectively. P<0.01 for N642H compared with WT, Student’s t-test. (f) Western blot image showing P-STAT5(Y699) and STAT5 levels before or after culturing EV, STAT5B-WT or N642H mutant transduced, GFP-sorted YT cells in the absence (no IL2) or the presence of IL2. YT cells were cultured in the absence of IL2 in each stage of the experiment including 1 week before transduction. The image is representative of two independent western blots.
Figure 7∣
Figure 7∣. AZD1480 inhibits STAT3/STAT5B-mutant transduced NK cells.
STAT3-mutant (a) or STAT5B mutant (b) transduced, GFP+-sorted KAI3 cells were treated with 0.5 μM AZD1480 for 72 h. Viable cell number was determined using Vi-cell XR cell viability analyser (Beckman Coulter Inc.) as described in Supplementary Methods and normalized to the corresponding untreated sample. Means ± s.d. of two biological replicates are shown. (c) Normalized viable cell number of STAT5B-WT (left) or N642H-mutant (right) transduced KAI3 cells treated with progressively increasing doses of AZD1480 for 72 h. Each column represents mean ± s.d. of three biological replicates. (d) P-STAT5 (Y699) levels were analysed by western blot on EV, STAT5B-WT, N642H or I704L transduced KAI3 cells treated with progressively increasing doses (0.5 μM, 1 or 2 μM) of AZD1480 for 4 h (e) Normalized numbers of viable STAT3-mutated NKYS and YT cells treated as in (c) are shown *P<0.01 versus no treatment; **P<0.05 versus no treatment; Student’s t-test. NS: not significant.

References

    1. Jaffe ES The 2008 WHO classification of lymphomas: implications for clinical practice and translational research. Hematology Am. Soc. Hematol. Educ. Program 2009, 523–531 (2009). - PMC - PubMed
    1. Kwong YL Natural killer-cell malignancies: diagnosis and treatment. Leukemia 19, 2186–2194 (2005). - PubMed
    1. Takakuwa T et al. Frequent mutations of Fas gene in nasal NK/T cell lymphoma. Oncogene 21, 4702–4705 (2002). - PubMed
    1. Quintanilla-Martinez L et al. p53 Mutations in nasal natural killer/T-cell lymphoma from Mexico: association with large cell morphology and advanced disease. Am. J. Pathol 159, 2095–2105 (2001). - PMC - PubMed
    1. Yu H, Pardoll D & Jove R STATs in cancer inflammation and immunity: a leading role for STAT3. Nat. Rev. Cancer 9, 798–809 (2009). - PMC - PubMed

MeSH terms

Associated data