. 2015 Jan 14:6:6042.
doi: 10.1038/ncomms7042.

Aberrant splicing of U12-type introns is the hallmark of ZRSR2 mutant myelodysplastic syndrome

Affiliations

Aberrant splicing of U12-type introns is the hallmark of ZRSR2 mutant myelodysplastic syndrome

Vikas Madan et al. Nat Commun. .

Abstract

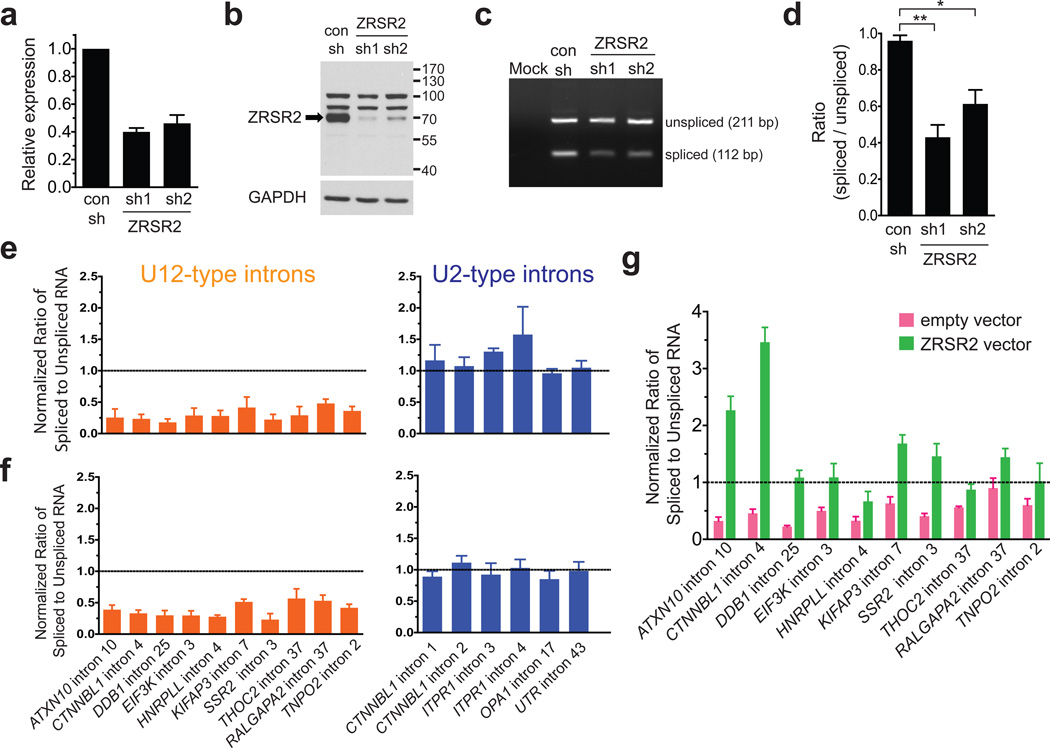
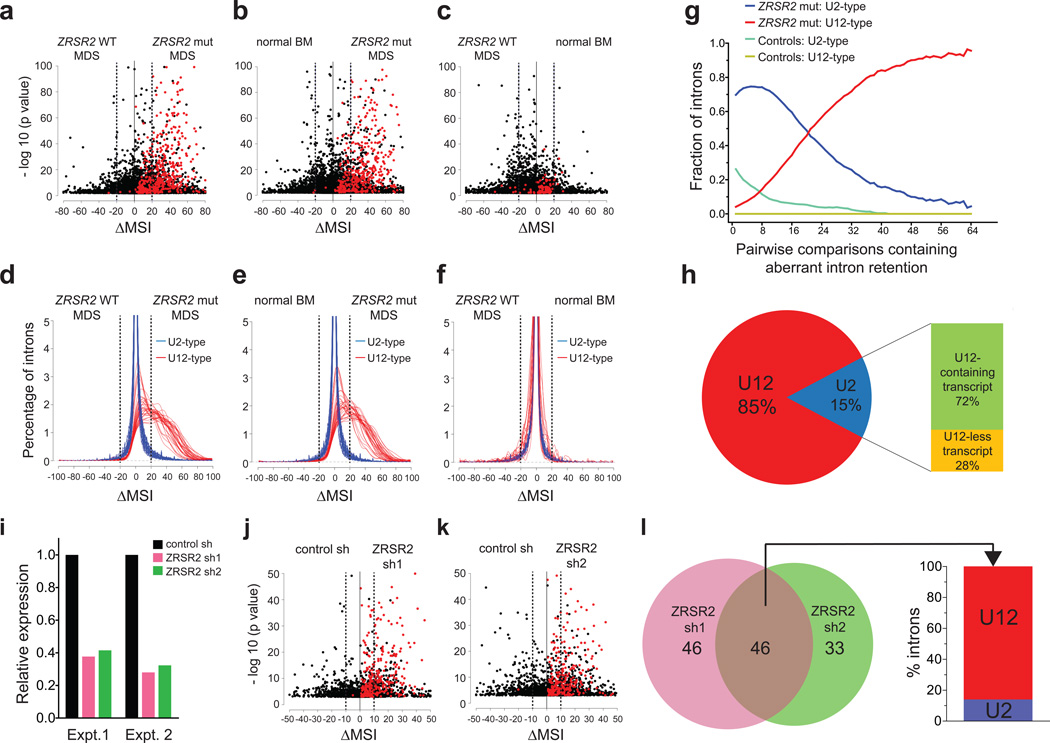
Somatic mutations in the spliceosome gene ZRSR2-located on the X chromosome-are associated with myelodysplastic syndrome (MDS). ZRSR2 is involved in the recognition of 3'-splice site during the early stages of spliceosome assembly; however, its precise role in RNA splicing has remained unclear. Here we characterize ZRSR2 as an essential component of the minor spliceosome (U12 dependent) assembly. shRNA-mediated knockdown of ZRSR2 leads to impaired splicing of the U12-type introns and RNA-sequencing of MDS bone marrow reveals that loss of ZRSR2 activity causes increased mis-splicing. These splicing defects involve retention of the U12-type introns, while splicing of the U2-type introns remain mostly unaffected. ZRSR2-deficient cells also exhibit reduced proliferation potential and distinct alterations in myeloid and erythroid differentiation in vitro. These data identify a specific role for ZRSR2 in RNA splicing and highlight dysregulated splicing of U12-type introns as a characteristic feature of ZRSR2 mutations in MDS.


Figures

Figure 1
Figure 1. Knockdown of ZRSR2 induces defects in splicing of U12-type introns
(a) Transcript levels of ZRSR2 in TF-1 cells stably transduced with either lentiviral ZRSR2 shRNA or control (con) vectors were examined using quantitative RT-PCR. GAPDH levels served as endogenous control. (b) Western blot analysis to verify the decrease in ZRSR2 protein levels in knockdown TF-1 cells. (c) Splicing efficiency of Intron F of P120 minigene construct was measured in ZRSR2 knockdown and control 293T cells. A representative gel picture shows bands corresponding to unspliced and spliced product in RT-PCR analysis performed 48h after transfection of minigene plasmid. (d) The bars depict ratio of intensities of PCR bands corresponding to spliced and unspliced products in P120 minigene assay. The data represent the mean ± SEM of three independent transfection experiments. *P < 0.05, **P <0.01; Unpaired t test. (e and f) Average ratio of spliced to unspliced pre-mRNA levels of ten U12-type and six U2-type introns in TF-1 cells upon knockdown of ZRSR2 using two shRNA vectors, ZRSR2 sh1 (e) and ZRSR2 sh2 (f). The data are mean ± SEM from at least 3 independent RNA preparations. Horizontal dotted lines represent the ratio for control transduced cells which were set as 1.0. GAPDH was used as endogenous control. (g) Average ratios of spliced to unspliced levels of U12-type introns upon transient transfection of ZRSR2 expression plasmid in knockdown 293T cells are depicted. 293T cells stably expressing ZRSR2 sh1 or control vector were transfected with either pCDNA3-hZRSR2 or empty vector and total RNA was extracted after 72h. The splicing efficiency was measured using qPCR and spliced/unspliced ratio was set as 1.0 for control cells transfected with empty vector (horizontal dotted line). GAPDH was used to normalize for cDNA input. The results are average of 5–7 transfection experiments and represented as mean ± SEM.
Figure 2
Figure 2. RNA sequencing of MDS bone marrow harboring mutations in ZRSR2 reveals splicing defects
(a) Schematic representation of human ZRSR2 protein with position and type of mutations in eight MDS patients used for RNA-Seq. (b) Approach used to define the RNA-Seq reads for analysis of splice junctions is shown. All splice junctions corresponding to known RefSeq transcripts were examined. Reads mapped to a representative splice position (Junction 1) are classified as either ‘normal’ or ‘aberrant’ in the illustration. (c) Number of junction positions with aberrant reads obtained in pairwise comparisons between ZRSR2 mutant and WT MDS are depicted. Junctions with significant aberrant reads in ZRSR2 mutant (ΔMSI>20) are shown as red bars while those in ZRSR2 WT (ΔMSI<-20) are shown as blue bars for each mutant vs WT pair. The dashed horizontal lines denote the averages of aberrant junction positions in the two genotypes across 32 comparison pairs (eight ZRSR2 mutant MDS compared individually to four ZRSR2 WT MDS). (d) Number of aberrant junctions obtained in pairwise comparisons between ZRSR2 mutant MDS and normal BM analyzed and depicted as described in (c). The black bars represent number of aberrant junctions detected in normal BM. The green bars in (c) and (d) represent the number of junctions which were identified in all eight mutant / eight control samples in at least one pairwise comparison. Each pair of bars in (c) and (d) is labelled with identifiers for ZRSR2 mutant and control samples represented in their pair-wise comparison. The sample information including details of ZRSR2 mutations are described in Table 1.
Figure 3
Figure 3. ZRSR2 mutated MDS bone marrow and ZRSR2 knockdown cells are characterized by aberrant retention of U12-type introns
(a–c) Dot plots display aberrantly retained introns in a representative pairwise analysis of ZRSR2 mutant MDS vs ZRSR2 WT MDS (a), ZRSR2 mutant MDS vs normal BM (b) and normal BM vs ZRSR2 WT MDS (c). Each dot denotes an intron and U12-type introns are shown in red. p value was calculated using Fisher’s exact test and data points with p<0.01 are shown. (d–f) Histograms depict frequencies of U2-type and U12-type introns plotted against ΔMSI value in pairwise comparisons of ZRSR2 mutant and control samples. Each curve represents a pairwise comparison for U2-type (blue) and U12-type (red) intron. 32 comparisons between ZRSR2 mutant MDS and ZRSR2 WT MDS (d), 32 comparisons between ZRSR2 mutant MDS and normal BM (e), and 16 comparisons between ZRSR2 WT MDS and normal BM (f) were performed. (g) The proportion of U2-type and U12-type introns among aberrantly retained introns in either ZRSR2 mutant or controls (ZRSR2 WT MDS + normal BM) are shown for 64 pairwise comparisons. The number of introns is plotted against the number of pairwise comparisons in which they were identified. (h) Distribution of intron type for significantly retained introns (ΔMSI>20; FDR≤0.01) in ZRSR2 mutant MDS is shown. The bar graph shows the distribution of retained U2-type introns into those present in either transcript containing a U12-type intron or without U12-type intron. (i) Relative expression of ZRSR2 was computed as FPKM values from RNA-Seq data in two independently transduced control and knockdown TF-1 cells. (j–k) Dot plots depict aberrantly retained introns in control vs ZRSR2 sh1 (j) and control vs ZRSR2 sh2 (k). Only data points corresponding to p<0.01 are displayed. (l) Venn diagram shows an overlap of retained introns between ZRSR2 sh1 and sh2 knockdown TF-1 cells. The introns which are significantly retained (p<0.01; ΔMSI>10) for sh1 or sh2 transduced cells in both experiments are included. The bar graph on the right depicts the proportion of U2-type and U12-type introns among the introns retained in both sh1 and sh2 transduced cells.
Figure 4
Figure 4. Detection of U12-type intron retention in ZRSR2 mutant MDS
(a–h) Normalized intron expression for eight representative U12-type introns was determined using quantitative PCR. The RNA-Seq reads normalized to total number of mappable reads for all 16 cases are depicted using IGV 2.3 in the left panels. Read counts are shown using an identical scale in all samples, and the U12-type introns are indicated by orange arrow heads. For each gene, only the genomic locus containing the retained intron is shown. Right panels: The expression of U12-type introns was measured relative to the expression of flanking exons and is shown by horizontal bars (red bars: ZRSR2 mutant MDS; blue bars: ZRSR2 WT MDS; black bars: normal BM).
Figure 5
Figure 5. Cryptic splice junctions in U12-type introns of WDR41 and FRA10AC1
(a) Normalized RNA-Seq reads mapped to the genomic region encompassing exons 4 and 5 of WDR41 gene are displayed using IGV 2.3 for all 16 samples. Reads in all samples are shown on identical scale. (b) Aberrant splice junctions in intron 4 (U12-type intron) of WDR41 gene are depicted. The mis-spliced regions (designated 4A and 4B) and two alternative splice donor sites in intron 4 (upstream of 4A; marked as 4’ and 4”) in ZRSR2 mutant samples are illustrated. The intron type and length for the cryptic junctions are indicated. The cryptic splice acceptor and donor sequences which are activated in ZRSR2 mutant MDS are shown below. The PCR primers used in (c) and (e) are indicated by arrows. (c–d) Experimental verification of splicing junction between 4B and exon 5 of WDR41. (c) qRT-PCR using primers located in 4B and exon 5 to determine relative levels of mis-spliced transcript in ZRSR2 mutant and control samples. (d) The PCR product amplified from cDNA of ZRSR2 mutant samples in (c) was Sanger sequenced. The junction is shown by dashed vertical line. (e–f) Splicing between 4A and 4B was analyzed as described above in (c) and (d), respectively. (g–h) Sanger sequencing of the PCR amplicon obtained from cDNA of ZRSR2 mutant samples using primers located in 4A and retained intron (upstream of 4’). The PCR product was cloned into TOPO TA vector and individual clones were sequenced to verify two alternative splice donor sites (4’ and 4”). (i) RNA-Seq reads mapped to the genomic region encompassing exons 3–6 of FRA10AC1 gene. (j) Aberrant splice donor site (denoted 4’) in intron 4 of FRA10AC1 is shown for a representative ZRSR2 mutant sample. Sequence and intron-type for the cryptic splice junction are indicated. (k) qRT-PCR to measure the relative levels of mis-spliced RNA in ZRSR2 mutant and control samples using primers located in intron 4 and exon 5. GAPDH was used to normalize the levels of transcripts. (l) Sanger sequencing of the PCR product obtained from ZRSR2 mutant samples in (j). The junction between intron 4 and exon 5 is indicated by the dashed vertical line.
Figure 6
Figure 6. Stable knockdown of ZRSR2 alters cell growth and differentiation
(a) Colony forming ability of TF-1 and K562 cells transduced with ZRSR2 shRNA and control vectors was evaluated using soft-agar colony assay. 1500 cells were seeded in each well of a 24-well plate, and colonies were enumerated after 2 weeks. Cells were plated in triplicate, and the data are the mean ± SEM from multiple experiments (TF-1: n=8 for sh1 and n=3 for sh2; K562: n=2) (b) ZRSR2 knockdown and control K562 cells were transplanted into the flank of NSG mice; tumors were dissected after 2 weeks and weighed. Data represent mean ± SEM. (c) Cord blood derived CD34+ cells were transduced with ZRSR2 shRNA lentivirus and plated in methylcellulose media containing SCF, IL3, GCSF, GMCSF and EPO as well as 1 μg/ml puromycin. BFU-E, CFU-G and CFU-M colonies were counted after 9 days. Data represent the mean ± SEM of three experiments. (d–g) CD34+ cells were transduced as in (c), cultured in liquid media containing SCF, IL3, GMCSF and EPO for 2 weeks and analyzed using flow cytometry. (d) A representative overlay of histograms showing staining with CD11b antibody used as a marker of differentiation towards myeloid lineage. (e) Percentage of CD11b+ cells obtained after in vitro differentiation of CD34+ cells in 4 experiments are depicted (mean ± SEM). (f) Erythroid differentiation was measured using surface expression of Glycophorin A and CD71 antigens in cells cultured for 2 weeks in the presence of cytokines. Representative dot plots for FACS staining in ZRSR2 knockdown and control cells are shown. Percentage of cells in each quadrant are indicated. (g) Bar graphs represent percentages of GlyA+CD71+ cells from 3 experiments (mean ± SEM). *P<0.05, **P<0.01. P values were calculated using Student’s t test.
Figure 7
Figure 7. Gene Ontology (GO) analyses of mis-spliced genes in ZRSR2 mutant MDS
(a) GO analysis of 251 significantly mis-spliced genes in ZRSR2 mutant MDS shows their enrichment in a number of essential biological pathways (p<0.05). (b) Heat map portrays the relative scale of aberrant retention of U12-type introns in genes involved in hematopoietic development. MSI values for U12-type introns in ZRSR2 mutant and control samples were utilized for depiction of mis-splicing.

References

    1. Hofmann WK, Koeffler HP. Myelodysplastic syndrome. Annu Rev Med. 2005;56:1–16. - PubMed
    1. Greenberg PL. The multifaceted nature of myelodysplastic syndromes: clinical, molecular, and biological prognostic features. J Natl Compr Canc Netw. 2013;11:877–884. quiz 885. - PubMed
    1. Ma X. Epidemiology of myelodysplastic syndromes. Am J Med. 2012;125:S2–S5. - PMC - PubMed
    1. Tefferi A, Vardiman JW. Myelodysplastic syndromes. N Engl J Med. 2009;361:1872–1885. - PubMed
    1. Sekeres MA, Bejanyan N. The revolution of myelodysplastic syndromes. Ther Adv Hematol. 2011;2:33–43. - PMC - PubMed

Publication types

MeSH terms

Associated data