

Impairment of chaperone-mediated autophagy leads to selective lysosomal degradation defects in the lysosomal storage disease cystinosis
- PMID: 25586965
- PMCID: PMC4328646
- DOI: 10.15252/emmm.201404223
Impairment of chaperone-mediated autophagy leads to selective lysosomal degradation defects in the lysosomal storage disease cystinosis
Abstract
Metabolite accumulation in lysosomal storage disorders (LSDs) results in impaired cell function and multi-systemic disease. Although substrate reduction and lysosomal overload-decreasing therapies can ameliorate disease progression, the significance of lysosomal overload-independent mechanisms in the development of cellular dysfunction is unknown for most LSDs. Here, we identify a mechanism of impaired chaperone-mediated autophagy (CMA) in cystinosis, a LSD caused by defects in the cystine transporter cystinosin (CTNS) and characterized by cystine lysosomal accumulation. We show that, different from other LSDs, autophagosome number is increased, but macroautophagic flux is not impaired in cystinosis while mTOR activity is not affected. Conversely, the expression and localization of the CMA receptor LAMP2A are abnormal in CTNS-deficient cells and degradation of the CMA substrate GAPDH is defective in Ctns(-/-) mice. Importantly, cysteamine treatment, despite decreasing lysosomal overload, did not correct defective CMA in Ctns(-/-) mice or LAMP2A mislocalization in cystinotic cells, which was rescued by CTNS expression instead, suggesting that cystinosin is important for CMA activity. In conclusion, CMA impairment contributes to cell malfunction in cystinosis, highlighting the need for treatments complementary to current therapies that are based on decreasing lysosomal overload.
Keywords: CTNS; autophagy; cystinosis; lysosomal storage disorder; lysosomal trafficking.
© 2015 The Authors. Published under the terms of the CC BY 4.0 license.
Figures
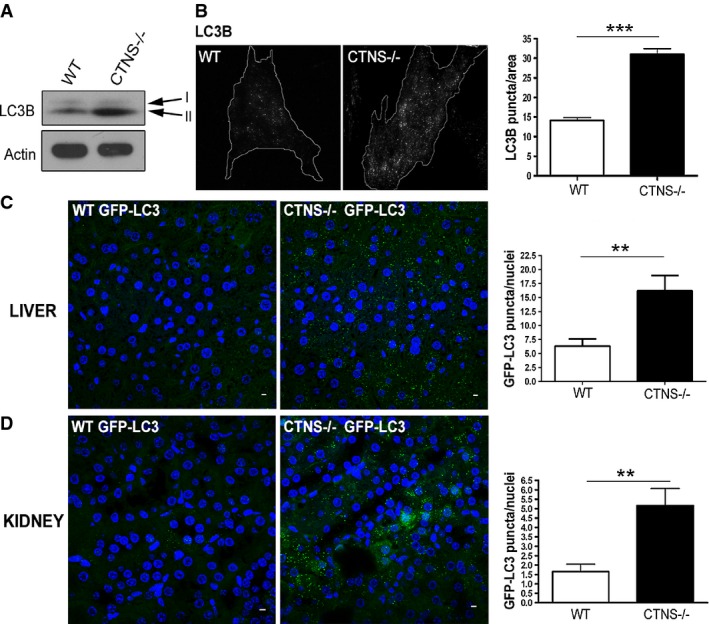
Expression levels of the autophagosome marker LC3B-II were evaluated in wild-type (WT) and Ctns−/− fibroblasts by Western blot (WB). Data are representative of five different experiments with similar results.
WT and Ctns−/− fibroblasts were stained using LC3B antibodies and analyzed by fluorescence microscopy. The number of LC3B-positive puncta was quantified by the ImagePro software and normalized per area arbitrary units. Results are mean ± SEM (n = 27 WT and 24 Ctns−/− cells). ***P < 0.001 (unpaired t-test).
Immunofluorescence analysis of liver (C) and kidney (D) tissues from WT and Ctns−/− GFP-LC3 transgenic mice using anti-GFP antibodies. Quantification of LC3 puncta was obtained by counting the number of GFP-positive structures relative to the number of nuclei in the same field, using the ImagePro software. GFP-LC3 puncta were counted by analyzing 6 to 10 fields per tissue section (200–400 nuclei per field), in a total of 3 WT and 3 Ctns−/− mice expressing GFP-LC3. Results are mean ± SEM. In (C), **P = 0.0029; in (D), **P = 0.0025 (unpaired t-test). Scale bar: 5 μm.
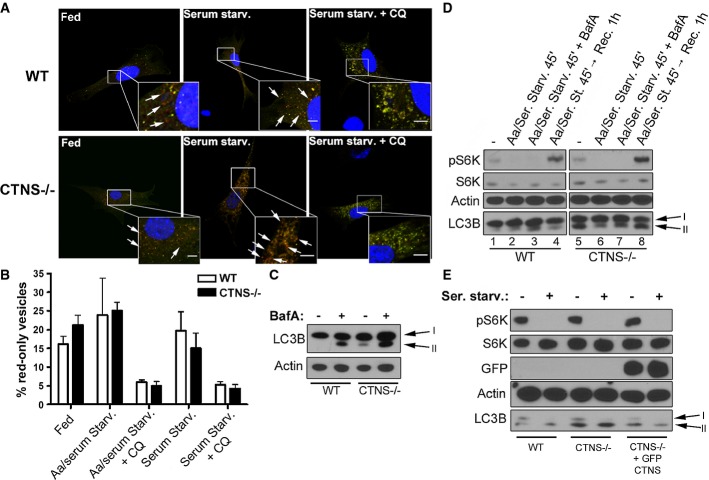
Representative images of wild-type (WT) and Ctns−/− mouse fibroblasts transfected with the ptfLC3 vector under resting conditions (fed), or after serum starvation (Serum Starv.) in the presence or absence of the alkalinizing drug chloroquine (CQ). GFP and RFP staining was analyzed by confocal microscopy. Examples of red-only puncta (mature autophagosomes) are indicated with arrows. Scale bar: 5 μm.
The percentage of mature autophagosomes (red-only vesicles) was calculated based on the ratio between the number of red-only puncta and the total number of autophagosomes (number of green and red + red-only puncta). The graph is representative of three different experiments with similar results. Results are mean ± SEM (n = 7 cells per condition). In addition to the experimental conditions shown in (A), the Aa/serum starvation condition is included.
WT and Ctns−/− fibroblasts under resting conditions were treated with 100 nM bafilomycin A (BafA) for 2 h and LC3B-II levels were analyzed by Western blot (WB).
Phosphorylation levels of the mTOR complex kinase 1 substrate S6K and LC3B-II levels in WT and Ctns−/− fibroblasts were measured by WB under resting conditions (−), withdrawal of both amino acids and serum (Aa/Ser. Starv.) and subsequent recovery by replacement of starvation medium with normal cell growth medium (Rec), in the presence or absence of 100 nM BafA for the indicated time.
WB analysis showing phosphorylation levels of the mTOR substrate S6K and expression of LC3B-II in resting or serum-starved WT,Ctns−/− and Ctns−/− fibroblasts expressing GFP-CTNS.
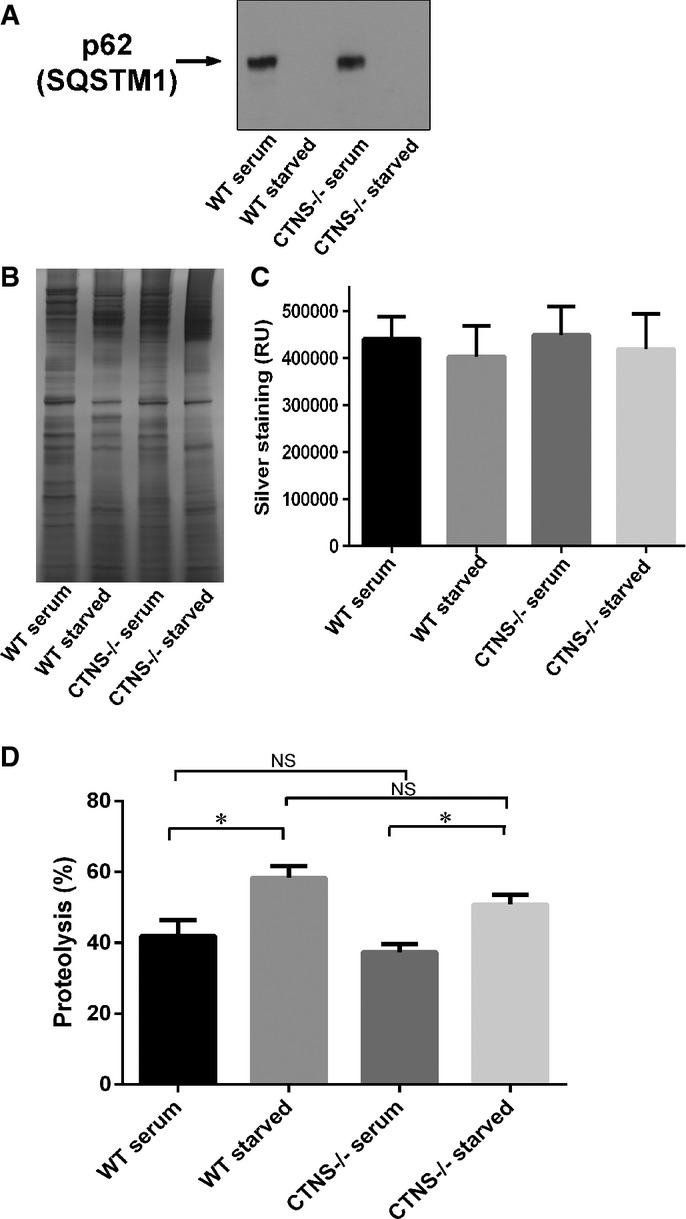
Analysis of the expression of endogenous SQSTM1 in wild-type or Ctns−/− mouse fibroblasts under fed (serum) or starved (15 h serum starvation) conditions. In these assays, 20 μg of total protein lysates were resolved by SDS-PAGE and analyzed by Western blot (WB; A). Equal loading was established by silver staining (B). Quantification (mean ± SEM) of five different areas of each silver-stained lane are shown in (C).
Degradation of long-lived proteins using metabolic labeling was performed as described in Supplementary Materials and Methods. The data represent the mean ± SEM of nine independent samples analyzed in three independent experiments. *P = 0.009 for WT and *P = 0.0013 for Ctns−/−, respectively. NS, not significant (unpaired t-test).
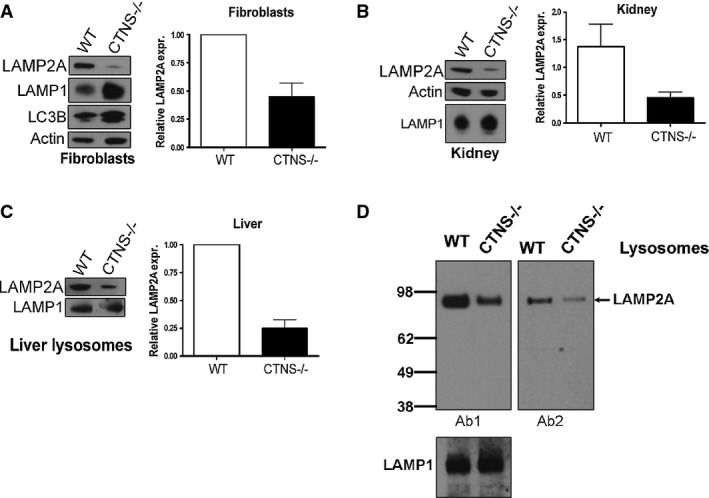
The expression levels of the endogenous LAMP2A and LAMP1 proteins were analyzed in wild-type (WT) and Ctns−/− mouse fibroblasts (A), kidney (B) and liver lysosomes (C) by Western blot. Quantitative densitometry analysis of immunoblots obtained from different experiments was performed by calculating the ratio between LAMP2A and actin signals in each lane. Results are mean ± SEM of four independent experiments with mouse fibroblasts, 5 WT and 6 Ctns−/− mouse kidneys, 3 WT and 3 Ctns−/− mouse livers (lysosomal extracts).
Comparative analysis of the amount of LAMP2A in wild-type or Ctns−/− liver lysosomes was performed using two different anti-LAMP2A antibodies. 15 μg of lysosomal proteins were loaded in each lane. Ab1, anti-LAMP2A antibody raised against the twelve amino acids of the cytosolic region of rat LAMP2A largely validated to recognize mouse LAMP2A but not other LAMP2 isoforms (Cuervo & Dice, 1996). Ab2, anti-LAMP2A Abcam Ab18528. Decreased lysosomal LAMP2A was evident using either antibody. LAMP1 was used as a loading control. Representative of two independent experiments with similar results.
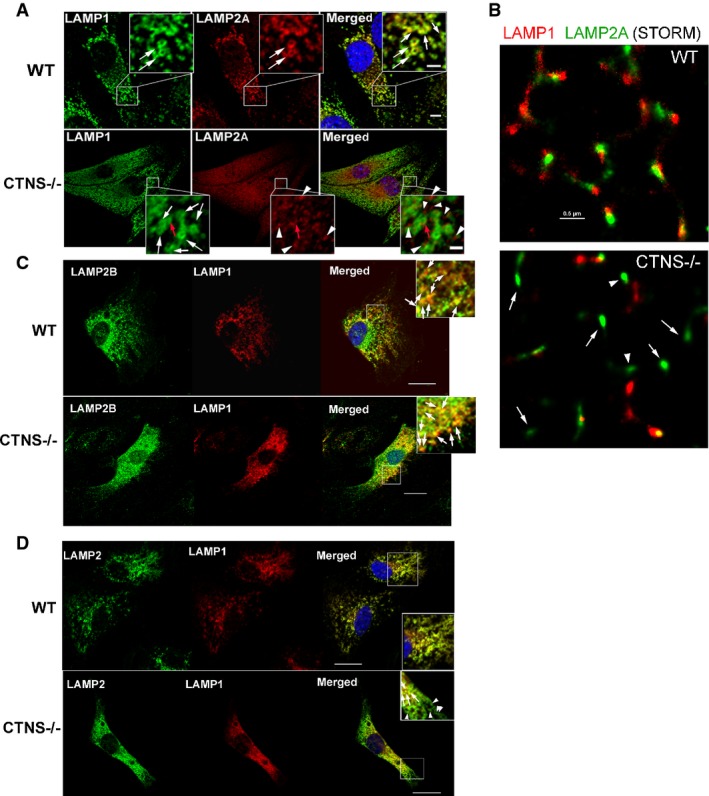
Immunofluorescence analyses of endogenous LAMP1, LAMP2A (A, B), LAMP2B (C) and total LAMP2 (D) localization in wild-type (WT) and Ctns−/− mouse fibroblasts. (A) Confocal microscopy analysis. White arrows represent LAMP1-positive circular structures (lysosomes) which were visible in both WT and Ctns−/− cells. Colocalization of LAMP1 and LAMP2A was observed in WT fibroblasts (white arrows, merged panel) but rarely in Ctns−/− cells (red arrow). Most LAMP2A showed a punctate pattern and lack of colocalization with LAMP1 in Ctns−/− cells (arrowheads, lower panels). Scale bars: 5 μm. Inset scale bars: 2 μm. (B) High-resolution stochastic optical reconstruction microscopy (STORM) analysis of the localization of LAMP1 and LAMP2A in wild-type and Ctns−/− cells. In Ctns−/− cells, LAMP2A was detected near (arrowheads, estimated distance > 50 nm) but not always adjacent (10–50 nm) to LAMP1 or at LAMP1-negative structures (arrows). Scale bar: 0.5 μm. (C) Immunofluorescence showing colocalization of endogenous LAMP1 and LAMP2B in both wild-type and CTNS-deficient fibroblasts (arrows). Scale bar: 20 μm. (D) Immunofluorescence analysis of LAMP1 and total LAMP2 (antibody ABL93 DSHB). Arrows show colocalization. Arrowheads show LAMP2-positive LAMP1-negative vesicles.
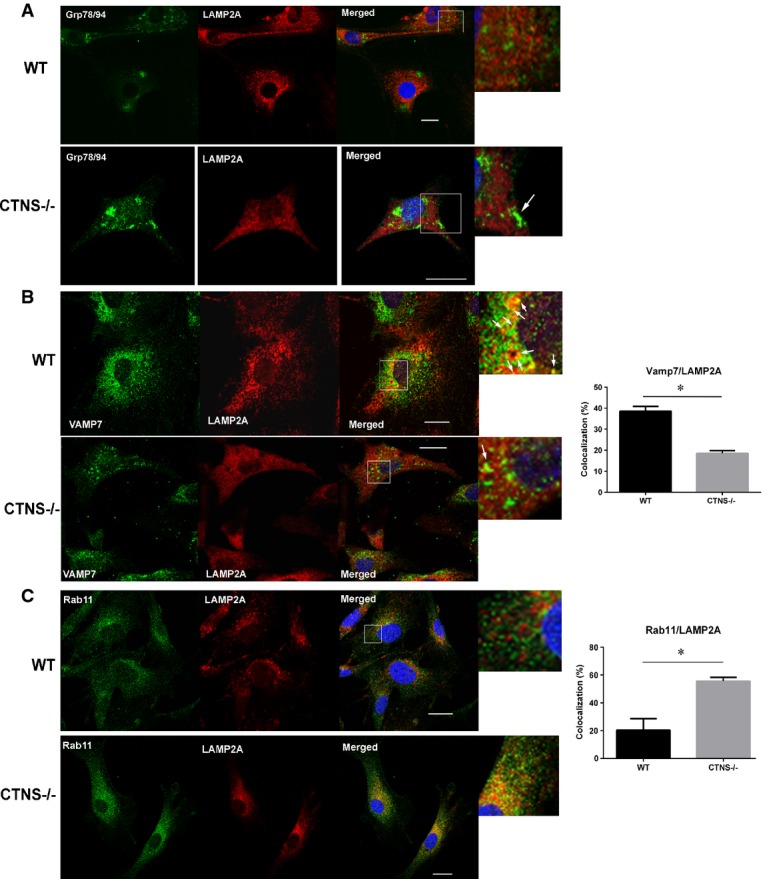
Immunofluorescence analyses of endogenous LAMP2A, ER (Grp78/94) (A), which is expanded in cystinotic cells (white arrow), VAMP7-positive vesicles (B) and Rab11a-positive structures (C) was performed using wild-type or Ctns−/− fibroblasts as described in Materials and Methods. At least 2 independent experiments were performed for each vesicular trafficking or ER marker. (B, C) Results are expressed as the percentage of LAMP2A that colocalizes with VAMP7 or Rab11. For Rab11/LAMP2A colocalization, 29 wild-type and 15 Ctns−/− cells were quantified. For VAMP7/LAMP2A colocalization (white arrows), 49 WT and 57 Ctns−/− cells were analyzed. Data are expressed as mean ± SEM. *P < 0.001 (unpaired t-test). Scale bars: 20 μm.
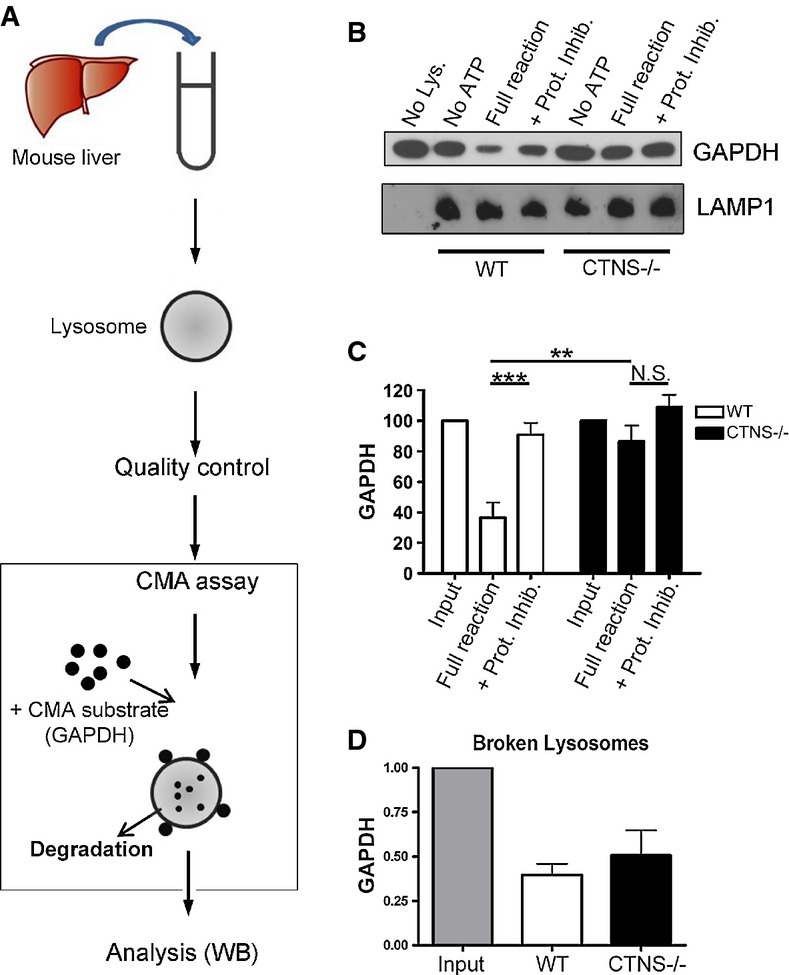
Schematic representation of lysosomal isolation and in vitroCMA assay [adapted from Kaushik and Cuervo (2008)].
Lysosomes were isolated from livers of starved wild-type (WT) and Ctns−/− mice as described in Supplementary Materials and Methods and incubated at 37°C for 30 min with the CMA substrate GAPDH, in the presence or absence of ATP (necessary for CMA) and protease inhibitors (Prot. Inhib.). A fraction of the CMA reactions was then mixed with sample buffer and boiled at 95°C for 5 min, followed by SDS–PAGE and GAPDH and LAMP1 immunoblotting.
Quantitative densitometry analysis of CMA activity performed in independent experiments using lysosomes isolated from a total of 11 WT and 10 Ctns−/− mice. Results are mean ± SEM. ***P = 0.0005; **P = 0.0041; N.S., not significant (unpaired t-test).
The ability of lysosomal proteases to mediate GAPDH degradation was assessed by incubating Triton X-100-treated WT and Ctns−/− lysosomes with GAPDH for 30 min in acidic reaction buffer and compared with input (reaction with no lysosomes). Quantitative densitometry analysis of independent reactions performed with lysosomes from a total of 9 WT and 9 Ctns−/− mice shows no significant difference in protease activity. Results are mean ± SEM.
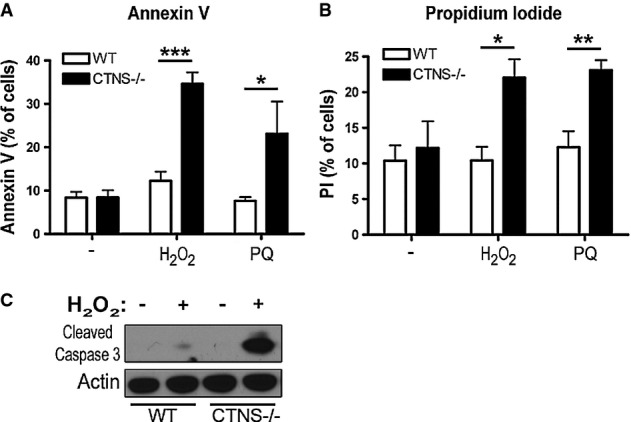
WT and Ctns−/− mouse fibroblasts were treated with either 50 μM H2O2 or 1 mM paraquat (PQ) for 4 h and stained with (A) FITC-annexin V or (B) propidium iodide (PI) and analyzed by FACS. Results from 3 different experiments are shown as mean ± SEM. In (A), *P = 0.05; ***P = 0.0002. In (B), *P = 0.046; **P = 0.0065. Unpaired t-test.
WT and Ctns−/− cells were treated as described above and samples analyzed by Western blot using antibodies recognizing cleaved (active) caspase 3. Data are representative of 2 independent experiments with similar results.
Cystine content in WT,Ctns−/−, cysteamine-treated Ctns−/− fibroblasts or Ctns−/− fibroblasts expressing GFP-CTNS was assessed by mass spectrometry.
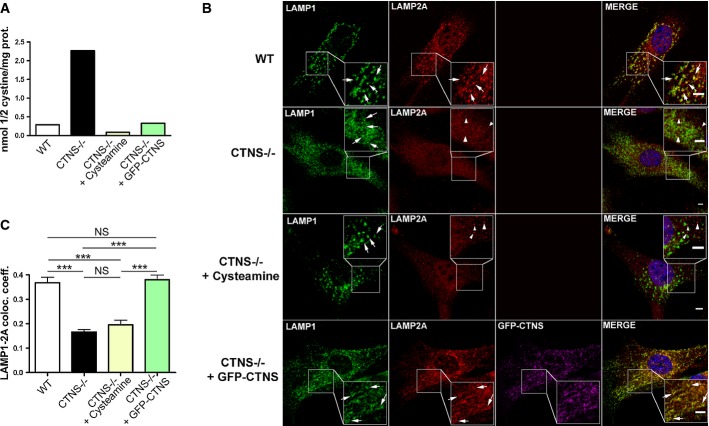
WT,Ctns−/−, Ctns−/− fibroblasts treated with 1 mM cysteamine (48 h), or Ctns−/− fibroblasts expressing GFP-CTNS were fixed and stained with anti-LAMP1 and LAMP2A antibodies as indicated. For better visualization of LAMP1/LAMP2A colocalization, GFP-CTNS was pseudocolored as magenta and LAMP1 was pseudocolored as green (lower panels). Some lysosomes are indicated with arrows. Arrowheads indicate LAMP2A distribution to structures different from lysosomes (only observed in Ctns−/− cells and in cysteamine-treated Ctns−/− cells). Rescue of the LAMP2A localization to lysosomes was observed in Ctns−/− cells expressing GFP-CTNS. Scale bar: 2 μm.
Quantification of the colocalization analysis described in (B). Calculation of the Pearson's colocalization coefficient was done by analyzing 113 WT, 251 Ctns−/−, 88 cysteamine-treated and 164 GFP-CTNS-expressing Ctns−/− cells, by using the ZEN 2010 software. Results are mean ± SEM. ***P < 0.001; NS, not significant (one-way ANOVA, Bonferroni's multiple comparisons test).
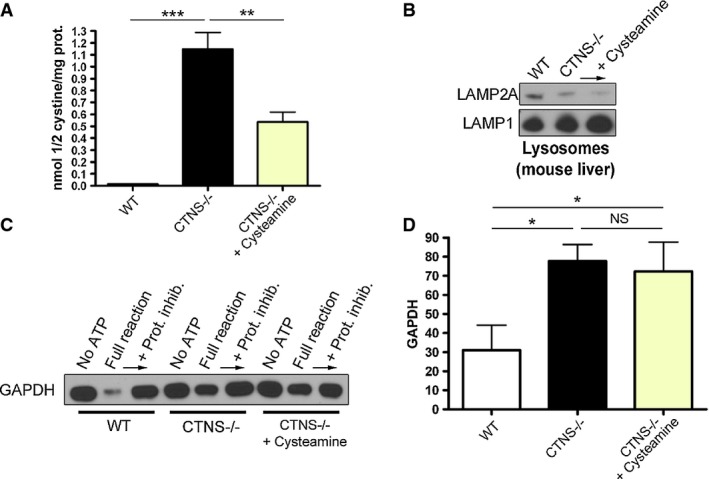
Cystine content in WT,Ctns−/− and cysteamine-treated Ctns−/− mouse livers was assessed by mass spectrometry. Results are mean ± SEM (n = 4). ***P < 0.001; **P = 0.0026 (one-way ANOVA, Bonferroni's multiple comparisons test).
Western blot analysis of LAMP2A expression in lysosomes isolated from WT,Ctns−/− and cysteamine-treated Ctns−/− mouse livers.
Lysosomes, isolated as in (B), were incubated with the CMA substrate GAPDH, and CMA activity was evaluated as in Fig8 and as described in Materials and Methods.
Quantitative analysis of substrate degradation is expressed as percent of the residual amount of GAPDH in the full reaction relative to its amount in the presence of protease inhibitors. Results are mean ± SEM (n = 4). *P = 0.0126 for WT versus Ctns−/− and *P = 0.0436 for WT versus Ctns−/− + cysteamine; NS, not significant; unpaired t-test.
References
-
- Anikster Y, Shotelersuk V, Gahl W. CTNS mutations in patients with cystinosis. Hum Mutat. 1999;14:454–458. - PubMed
-
- Barriocanal JG, Bonifacino JS, Yuan L, Sandoval IV. Biosynthesis, glycosylation, movement through the Golgi system, and transport to lysosomes by an N-linked carbohydrate-independent mechanism of three lysosomal integral membrane proteins. J Biol Chem. 1986;261:16755–16763. - PubMed
Publication types
MeSH terms
Substances
Grants and funding
LinkOut - more resources
Full Text Sources
Other Literature Sources
Molecular Biology Databases
Research Materials
Miscellaneous
