. 2015 Jan;27(1):262-85.
doi: 10.1105/tpc.114.132787. Epub 2015 Jan 13.

MET1 is a thylakoid-associated TPR protein involved in photosystem II supercomplex formation and repair in Arabidopsis

Affiliations

MET1 is a thylakoid-associated TPR protein involved in photosystem II supercomplex formation and repair in Arabidopsis

Nazmul H Bhuiyan et al. Plant Cell. 2015 Jan.

Abstract

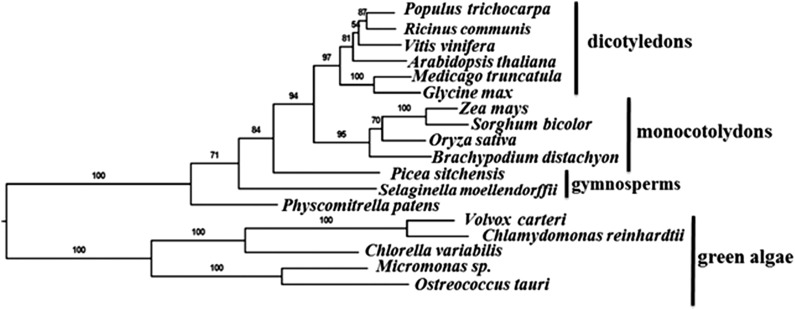
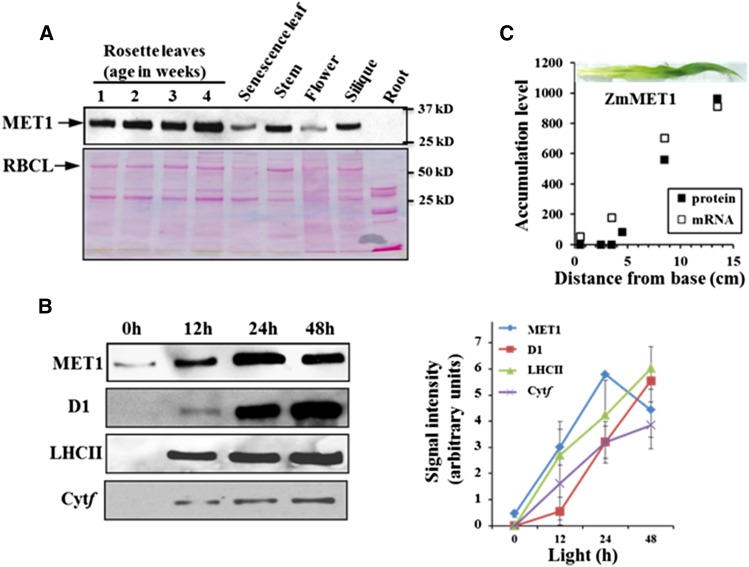
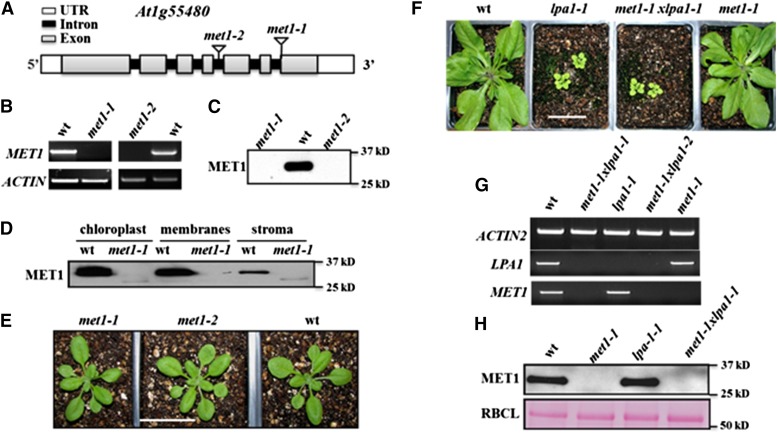
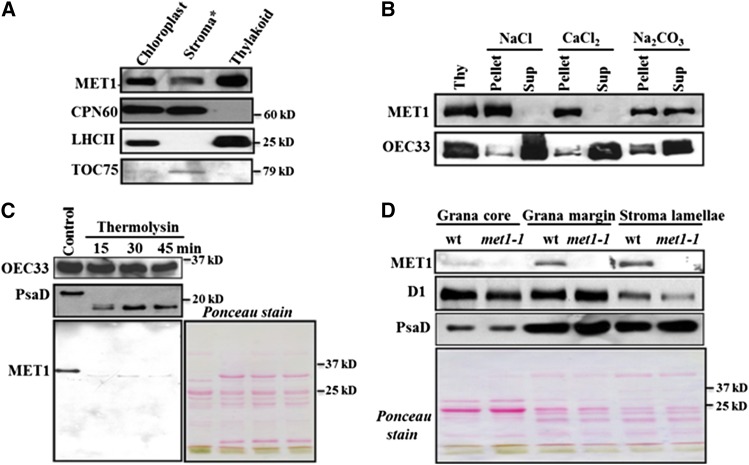
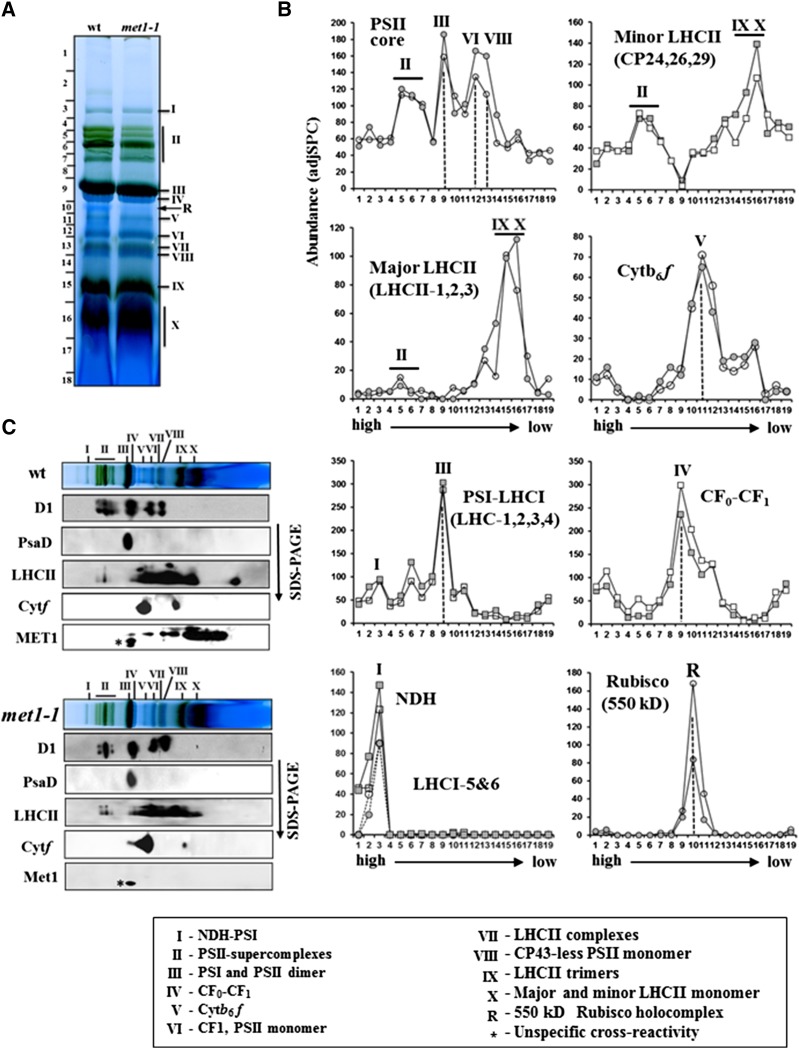
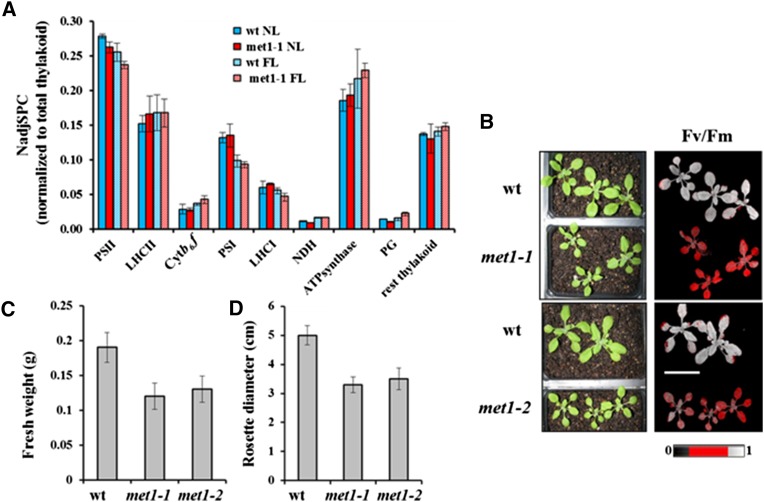
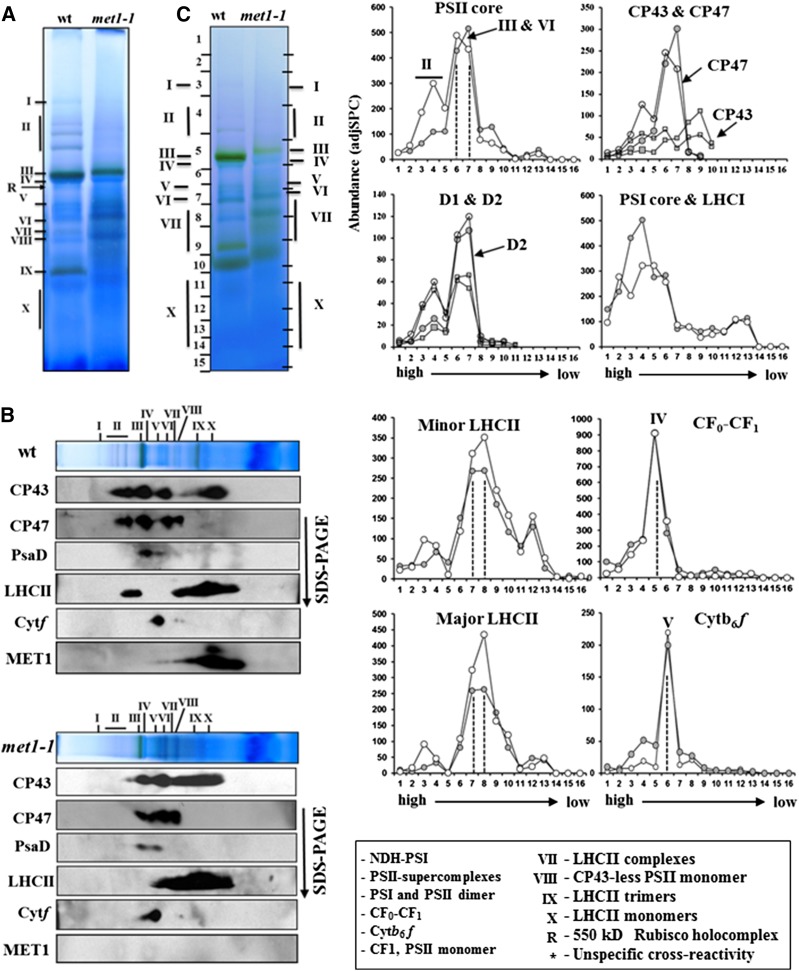
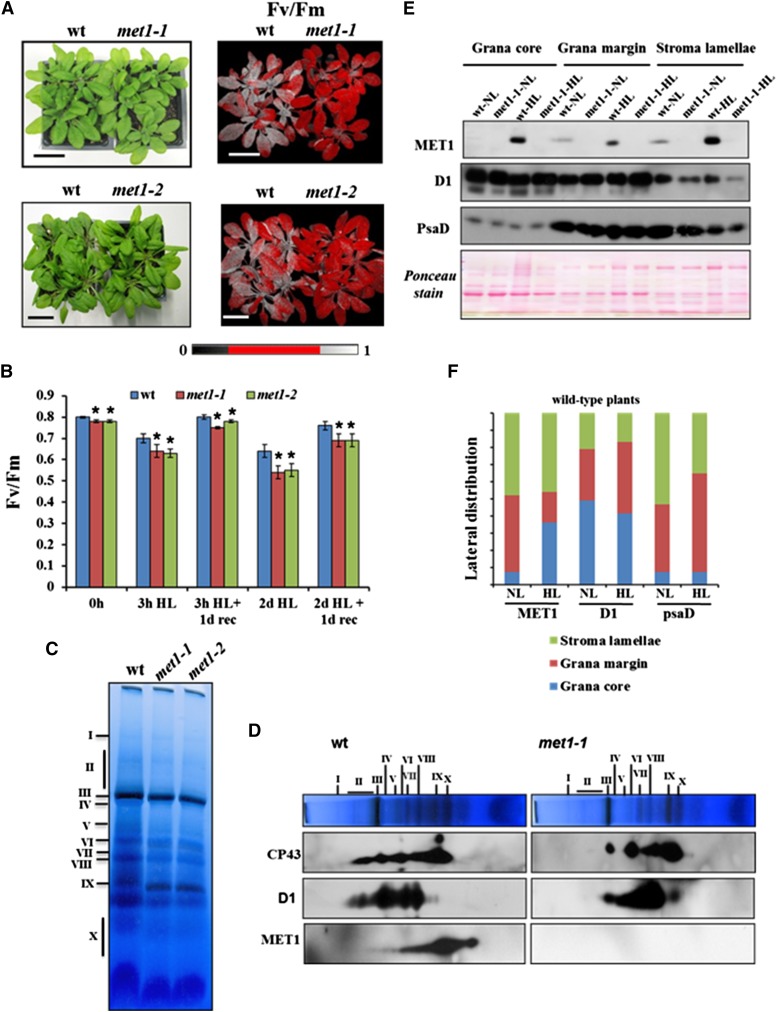
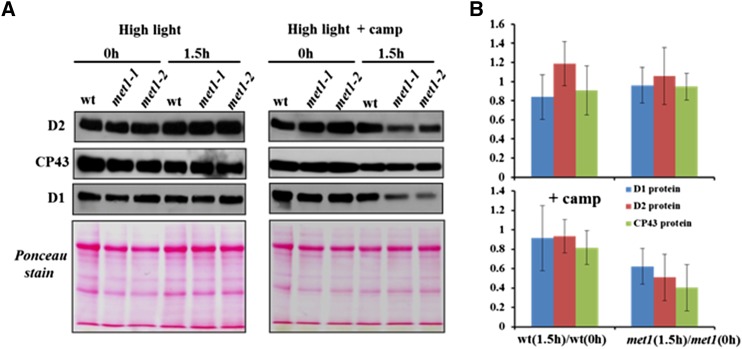
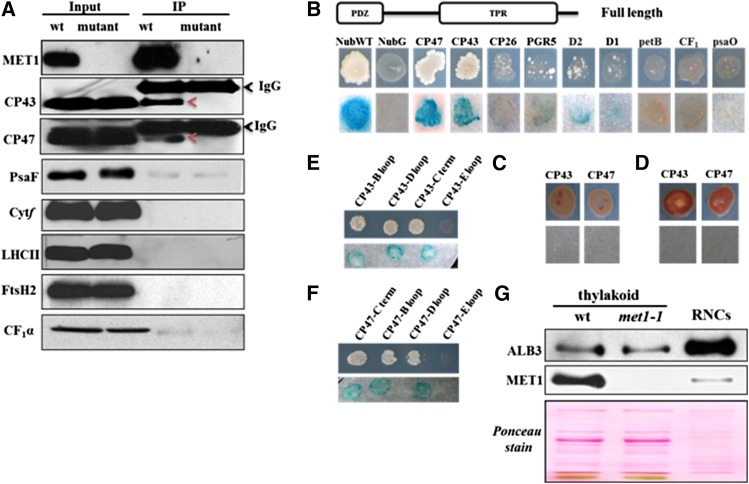
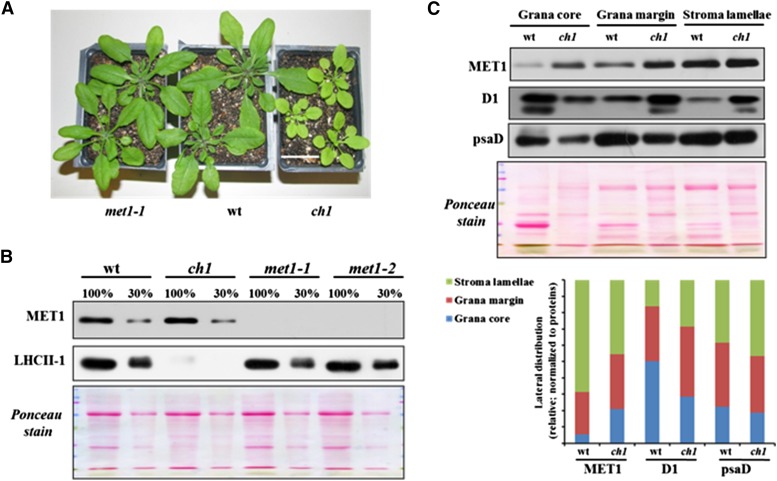
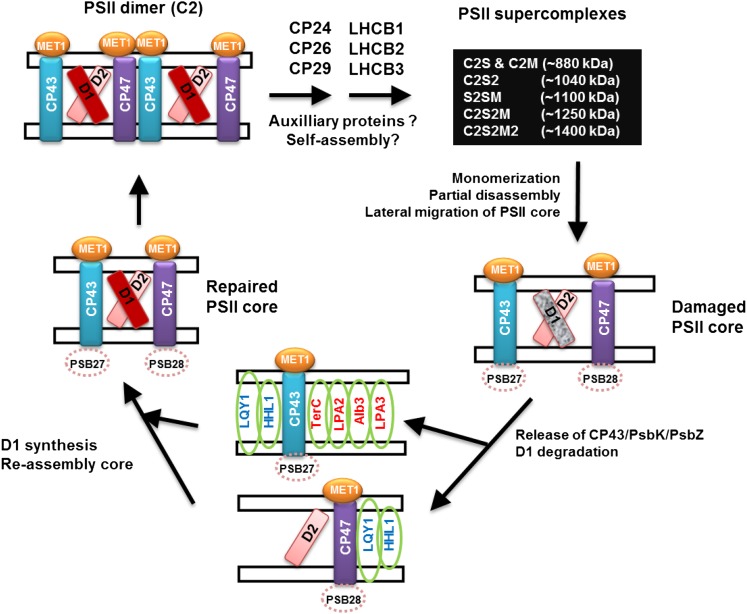
Photosystem II (PSII) requires constant disassembly and reassembly to accommodate replacement of the D1 protein. Here, we characterize Arabidopsis thaliana MET1, a PSII assembly factor with PDZ and TPR domains. The maize (Zea mays) MET1 homolog is enriched in mesophyll chloroplasts compared with bundle sheath chloroplasts, and MET1 mRNA and protein levels increase during leaf development concomitant with the thylakoid machinery. MET1 is conserved in C3 and C4 plants and green algae but is not found in prokaryotes. Arabidopsis MET1 is a peripheral thylakoid protein enriched in stroma lamellae and is also present in grana. Split-ubiquitin assays and coimmunoprecipitations showed interaction of MET1 with stromal loops of PSII core components CP43 and CP47. From native gels, we inferred that MET1 associates with PSII subcomplexes formed during the PSII repair cycle. When grown under fluctuating light intensities, the Arabidopsis MET1 null mutant (met1) showed conditional reduced growth, near complete blockage in PSII supercomplex formation, and concomitant increase of unassembled CP43. Growth of met1 in high light resulted in loss of PSII supercomplexes and accelerated D1 degradation. We propose that MET1 functions as a CP43/CP47 chaperone on the stromal side of the membrane during PSII assembly and repair. This function is consistent with the observed differential MET1 accumulation across dimorphic maize chloroplasts.


Figures

Figure 1.
Figure 1.
MET1 Proteins Are Conserved across Green Algae and Plants. Cladogram of MET1 including representatives of green algae, early land plants, monocots, and dicots, based on the alignment in Supplemental Data Set 5. The analysis includes 18 MET1 proteins from different plant species, including 10 angiosperms, 2 gymnosperms, 1 moss, and 5 algae. RAxML bootstrap support values are shown at the nodes of the tree.
Figure 2.
Figure 2.
Accumulation of MET1 in Different Organs and during Greening in Leaves. (A) Accumulation of Arabidopsis MET1 in different organs. Tissues were collected from leaves, stem, flower, siliques, and roots of Arabidopsis plants. Ten micrograms total protein was loaded in each lane. Upper panel shows the MET1 immunoblot and lower panel the Ponceau-stained blot. (B) Light-induced accumulation of Arabidopsis MET1 during greening. Seeds were grown on agar plates with 0.5× Murashige and Skoog medium in the dark for 5 d and then transferred to light (80 μmol photons m−2 s−1) and sampled after 0, 12, 24, and 48 h. Total leaf proteins were extracted and separated by SDS-PAGE, followed by immunoblotting with specific antisera against MET1, D1 protein, LHCII, and Cyt f. Ten micrograms of protein was loaded in each lane. The graph shows the kinetics of protein accumulation for independent duplicate observations with standard deviations are indicated. (C) Accumulation of maize MET1 mRNA and protein along the developing maize leaf. mRNA levels (RKPM) were obtained from Li et al. (2010), and protein levels (as normalized adjusted spectral counts [NadjSPC] × 2.106) were from Majeran et al. (2010). The inset shows a representative image of a 9-d-old maize leaf used for the sampling of protein and mRNA.
Figure 3.
Figure 3.
Reverse Genetic Analysis of Null Mutants in MET1, Chloroplast Localization of MET1, and Effects on Protein and mRNA Levels in Arabidopsis. (A) Gene model structures and positions of T-DNA insertions in the met1-1 and met1-2 alleles. Exons (gray), introns (black), and 5′ and 3′ untranslated regions (white) are indicated. (B) met1-1 and met1-2 lines do not accumulate detectable MET1 transcript, as determined by RT-PCR (35 cycles). ACTIN2 was used to normalize MET1 mRNA. (C) met1-1 and met1-2 do not accumulate detectable MET1 protein. Total protein was extracted from rosette leaves of wild-type and mutant plants. Twenty micrograms of protein was loaded in each lane. (D) MET1 is primarily located in chloroplast membrane fractions but is absent in met1-1 and met1-2. Total chloroplast, chloroplast membranes, and stroma were used for immunoblotting with MET1 antiserum. (E) Representative images of 16-d-old wild-type, met1-1, and met1-2 lines grown at 80 μmol photons m−2 s−1 under a 14-h-light/10-h-dark cycle. Older plants (23 d) grown under these conditions and plants (16 and 23 d) grown at similar light intensities at a 18-h-light/6-h-dark cycle are shown in Supplemental Figures 4A and 4B. Bar = 3 cm (F) Phenotypes of 4-week-old wild-type, lpa1-1, met1-1, and met1-1x lpa-1 grown at 80 μmol photons m−2 s−1 under a 14-h-light/10-h-dark cycle. Additional images for plants grown under an 18-h-light/6-h-dark cycle are shown in Supplemental Figure 5. Bar = 3 cm (G) mRNA analysis of MET1 and LPA1 in the wild type and single and double mutants of LPA1 and MET1. ACTIN2 is shown as internal reference. (H) Immunoblot analysis of MET1 in the wild type and single and double mutants of LPA1 and MET1 (upper panel). A Ponceau stain of the RBCL region of the blot is shown as a loading control (lower panel).
Figure 4.
Figure 4.
MET1 Is a Stroma-Exposed Peripheral Thylakoid Protein Enriched in Stroma Lamellae. (A) Localization of MET1 within the chloroplasts. Total chloroplast, thylakoid membranes, and stroma were used for immunoblotting with MET1 antiserum. Antisera against stromal CPN60, thylakoid LHCII, and outer envelope protein TOC75 were used as markers. Asterisk indicates that the stroma still contains envelopes, as it was collected as the supernatant from broken chloroplasts following a 10-min spin at ∼18,000g. (B) Salt washing of thylakoid membranes. The membrane was sonicated in the presence of NaCl, CaCl2, and Na2CO3 and incubated on ice for 30 min before centrifugation to separate soluble and membrane fractions. Ten micrograms of proteins from supernatant and pellets was loaded on the SDS-PAGE gel. For control, thylakoids without any treatment of salt or sonication were used. (C) Thermolysin treatment of thylakoid membranes. Thylakoids isolated from wild-type chloroplasts were treated with thermolysin for 15, 30, and 45 min on ice and then immunoblotted. Proteins were separated by SDS-PAGE and immunoblotted with OEC33 (PsbO), PsaD, and MET1 antisera. The Ponceau-stained image prior to blotting is shown. Ten micrograms of protein was loaded in each lane. (D) Distribution of MET1 across the different thylakoid membrane regions. Thylakoid proteins were solubilized with digitonin and grana, grana margins, and stroma lamellae were fractionated by ultracentrifugation and analyzed by SDS-PAGE. Ten micrograms of protein was loaded in each lane. Immunoblots for MET1, D1, and PsaD protein are shown. Chlorophyll a/b ratios with standard deviations in parentheses for the wild-type fractions were: 3.4 (±0.41), 2.5 (±0.01), 3.0 (±0.15), and 6.6 (±0.15) for thylakoids, grana core, grana margins, stromal lamellae, respectively. The chlorophyll a/b ratios for the met1 fractions are: 3.6 (±0.5), 2.5 (±0.07), 3.7 (±0.34), and 5.6 (±0.94) for thylakoids, grana core, grana margins, and stromal lamellae, respectively. Ponceau-stained blots are shown for (C) and (D).
Figure 5.
Figure 5.
The Oligomeric State of the Thylakoid Membrane Complexes of 25-d-Old Wild-Type and met1-1 Plants Grown under Constant Light Intensity. (A) BN-PAGE analysis of thylakoid membrane protein complexes in the wild type and met1-1. DM-solubilized thylakoid membrane proteins were separated by BN-PAGE, followed by staining with Coomassie blue. Proteins in the gel lanes were identified and quantified by MS/MS (Supplemental Data Set 1); together with information from the literature using similar BN-PAGE analysis, this allowed for annotation of the different complexes (Järvi et al., 2011). I, NDH-PSI; II, PSII supercomplexes; III, PSI and PSII dimer; IV, CFo/1 complex; V, Cyt b6f complex; VI, CF1 (peripheral portion of the ATP synthase), PSII monomer; VII, LCHII complexes; VIII, CP43-less PSII monomer; IX, LHCII trimers; X, LHCII monomers and other monomeric proteins. R, the 550-kD Rubisco holocomplex. An equal amount of chlorophyll (12 μg) was loaded for the wild type and met1-1. (B) Protein abundance accumulation profiles in the BN-PAGE gel of wild type and met1-1 (as in [A]) determined by MS/MS analysis (Supplemental Data Set 1). The y axis shows protein abundance based on the number of matched AdjSPC. Fraction numbers (x axis) correspond to the gel regions (gel slices processed for MS/MS analysis) in (A). Open circle/square represents the wild type, and closed circle/square represents met1-1. (C) Immunoblotting of two-dimensional BN-PAGE-SDS-PAGE gels of the wild type and met1-1 DM-solubilized thylakoids probed with antisera against MET1, the D1 protein, Cyt f, PsaD, and LHCII-2. Individual lanes from BN-PAGE gels (as in [A]) were excised and solubilized in SDS, and proteins were separated by SDS-PAGE followed by immunoblotting.
Figure 6.
Figure 6.
Phenotype and Thylakoid Composition of Wild-Type and met1 Alleles Grown under Fluctuating Light. (A) Abundance of thylakoid complexes in met1-1 and wild-type plants under normal growth light (NL) and fluctuating light (FL) based on SDS-PAGE followed by MS/MS using label-free spectral counting for quantification. NadjSPC for each of the protein subunits in each complex was summed and normalized to total thylakoid proteome abundance. Standard deviations (n = 2) are indicated. (B) Wild-type and met1 alleles mutants grown under fluctuating light for 14 to 16 d. Left panels show plants used for Fv/Fm measurements, and the right panels show false color images representing Fv/Fm. Bar = 3 cm. (C) and (D) Fresh weight (C) and diameter (D) of rosettes of the wild type, met1-1, and met1-2 grown under fluctuating light for 2 weeks. Standard deviations are indicated (n = 6 [C] and n = 11 [D]).
Figure 7.
Figure 7.
The Oligomeric State of the Thylakoid Membrane Complexes of 20-d-Old Wild-Type and met1-1 Plants Grown under Fluctuating Light Intensity. (A) BN-PAGE of DM-solubilized thylakoid membrane protein complexes in the wild type and met1-1, followed by staining with Coomassie blue. Proteins and protein complexes in the gel lanes were identified and quantified by immunoblotting (B) and MS/MS ([C]; Supplemental Data Set 3). Annotation of the protein complexes (I-X) is as in Figure 5. An equal amount of chlorophyll (10 μg) was loaded in each lane. (B) Immunoblotting of two-dimensional BN-PAGE-SDS-PAGE gels of the wild type and met1-1 DM-solubilized thylakoids probed with antisera against the D1 protein, CP43, CP47, Cyt f, PsaD, LHCII-1, and MET1. Individual lanes from BN-PAGE gels (as in [A]) were excised and solubilized in SDS, and proteins were separated by SDS-PAGE, blotted, and immunodetected. (C) Protein abundance accumulation profiles in the BN-PAGE gel of the wild type and met1-1 (as in [A]) determined by MS/MS analysis (see data in Supplemental Data Set 3). The y axis shows protein abundance based on the number of matched AdjSPC. Fraction numbers (x axis) correspond to the gel regions (gel slices processed for MSMS analysis) in (A). Note that the gel slices were cut to accommodate for differential mobility in the wild-type and met1-1 lane as indicated on the sides of the BN-PAGE gel lanes. Open circles represent the wild type, and closed circles represent the mutant.
Figure 8.
Figure 8.
Response of Wild-Type and met1 Alleles to Short-Term and Long-Term High Light Treatment. Soil-grown wild type, met1-1, and met1-2 were grown at 100 μmol photons m−2 s−1 (16 h light/8 h dark) followed by 3 h of high light illumination or followed by 2 d of high light. High light was 1200 μmol photons m−2 s−1; 12 h light/12 h dark. (A) Wild type, met1-1, and met1-2 grown at 100 μmol photons m−2 s−1 (16 h light/8 h dark) exposed for 3 h to high light (1200 μmol photons m−2 s−1). The upper row shows 3-week-old wild-type and met1-1 plants, and the lower row shows 4-week-old wild-type and met1-2 plants after the 3-h light stress. The right panels show false color images representing Fv/Fm. After the 3-h high light treatment, plants were dark adapted for 20 to 30 min prior to fluorescence imaging. Bar = 3 cm. (B) Fv/Fm values of the wild type, met1-1, and met1-2 grown after 3 h of high light illumination or after 2 d of high light (1200 µmol photons m−2 s−1; 12 h light/12 h dark), in both cases followed by 1 d of recovery at growth light. Plants were dark adapted for 20 to 30 min prior to fluorescence imaging. Standard deviations are indicated (n = 10 to 16). Genotypic differences (wild type and met1) were significant at P < 0.001 using Student's t test as indicated by asterisks. (C) and (D) BN-PAGE analysis of thylakoid membrane protein complexes in the wild type, met1-1, and met1-2 after 2 d of high light. DM-solubilized thylakoid membrane proteins were separated by BN-PAGE (10 μg chlorophyll per lane), and gel lanes were stained with Coomassie brilliant blue. Individual lanes were run in a second dimension on SDS-PAGE gels after solubilization with SDS, followed by immunoblotting with antisera against D1, CP43, or MET1. (E) and (F) Distribution of MET1 across the different thylakoid membrane regions before and after high light treatment. Thylakoid proteins were solubilized with digitonin and grana, grana margins, and stroma lamellae were fractionated by ultracentrifugation and analyzed by SDS-PAGE (10 μg protein per lane). (E) Immunoblots for MET1, D1 (PSII core), and PsaD (PSI core) protein and a representative Ponceau stain of one of the blots are shown. (F) The quantified distribution for MET1, D1, and PsaD, normalized to the total signal for each protein within each genotype calculated from the blots in (E).
Figure 9.
Figure 9.
Degradation of PSII Core Proteins after High Light Treatment. Detached leaves of the wild type, met1-1, and met1-2 grown at 100 μmol photons m−2 s−1 (16 h light/8 h dark) exposed for 1.5 h to high light (1200 μmol photons m−2 s−1) in the absence or presence of the translational inhibitor chloramphenicol. Proteins were extracted from detached leaves and separated by SDS-PAGE gel and subjected to immunoblot with antisera against the PSII core proteins D1, D2, and CP43. Equal amounts of protein (10 μg) were loaded in each lane. (A) shows representative immunoblots and Ponceau stains, whereas (B) shows the average ratios of D1, D2, and CP43 proteins for the wild type and met1 before and after 1.5 h light stress. Data for the met1-1 and met1-2 alleles were averaged within each replicate. Standard deviations are indicated (n = 3). Two-tailed Student’s t tests showed significant differences at P < 0.05 for CP43 and at P < 0.1 for D2 in met1 with chloramphenicol.​
Figure 10.
Figure 10.
Interaction of MET1 with Thylakoid Proteins Determined by Co-IP and Y2H Analysis. (A) Co-IP of MET1 with anti-MET1 serum against DM solubilized thylakoids to identify potential protein interactors. Immunoblotting with various specific antisera showed that MET1 was highly enriched in the co-IP and that both CP43 and CP47 interact with MET1. Thylakoids from the met1-1 mutant were used as negative control. (B) Split-ubiquitin assays for interactions between full-length MET1 and selected thylakoid proteins. Full-length MET1 was used as bait and selected candidate proteins were used as prey. Bait plasmid contains Cub-PLV and prey plasmid contains NubG. NubG moiety was fused to the N terminus of prey proteins. The resulting plasmids were transformed into the yeast bait and prey strains. The transformed yeast strains harboring bait and prey constructs were mated and resulting transformants were analyzed on selective medium lacking Ade, His, Trp, Leu, Ura, and Met (upper lane) and for β-galactosidase (β-Gal) activity (lower lane). Soluble NubG and Nub-WT were used as negative and positive controls, respectively. (C) Interaction of the TPR domain of MET1 with CP43 and CP47. Diploid cells were analyzed on selective medium lacking Ade, His, Trp, Leu, Ura, and Met (upper lane) and for β-Gal activity (lower lane). (D) Interaction of PDZ domain of MET1 with CP43 and CP47. Diploid cells were analyzed on selective medium lacking Ade, His, Trp, Leu, Ura, and Met (upper lane) and for β-Gal activity (lower lane). (E) and (F) Interactions between full-length MET1 and stromal loops (B, D, and C-terminal) and lumenal loop E of CP43 (E) and CP47 (F). Diploid cells were analyzed on selective medium lacking Ade, His, Trp, Leu, Ura, and Met (upper lane) and for β-Gal activity (lower lane). (G) Enrichment analysis of RNCs extracted from thylakoids of the wild type. ALB3 but not MET1 is highly enriched in such RNC preparations. Solubilized thylakoid proteins of the wild type and met1-1 were used for reference of the immunoblots.
Figure 11.
Figure 11.
Accumulation of MET1 and LHCII in ch1 and met1 Alleles and the Wild Type. (A) Plants used for immunoblotting. Bar = 3 cm. (B) Immunoblot of MET1 and LHCII-1 of thylakoids isolated from ch1, met1-1, met1-2, and the wild type. The gel was loaded based on equal total leaf protein (100% = 10 μg). (C) Distribution of MET1 across the different thylakoid membrane regions in the wild type and the ch1 mutant. Thylakoid proteins were solubilized with digitonin, and grana, grana margins, and stroma lamellae were fractionated by ultracentrifugation and analyzed by SDS-PAGE (15 μg protein per lane). Immunoblots for MET1, D1 (PSII core), and PsaD (PSI core) protein and the Ponceau stain are shown. The bar diagram shows the relative distribution of MET1, D1, and PsaD across the thylakoid regions in the wild type and ch1 with signals normalized to the total signal for each protein within each genotype.
Figure 12.
Figure 12.
Model of PSII Assembly Factors Involved with CP43 and/or CP47. This figure provides a highly simplified outline of the proposed PSII assembly process, emphasizing those assembly factors interacting with CP43 (TERC, LPA2, and LPA3) or both CP43 and CP47 (LQY1 and HHL1) and the role of MET1. MET1 interacts with CP43 and CP47 at every assembly step, except in supercomplexes. We propose that MET1 aids in assembly of the PSII core and dimer, thus helping to prime the PSII dimer for association of minor and major LHCII protein and the formation of PSII supercomplexes,

References

    1. Anbudurai P.R., Mor T.S., Ohad I., Shestakov S.V., Pakrasi H.B. (1994). The ctpA gene encodes the C-terminal processing protease for the D1 protein of the photosystem II reaction center complex. Proc. Natl. Acad. Sci. USA 91: 8082–8086. - PMC - PubMed
    1. Armbruster U., Zühlke J., Rengstl B., Kreller R., Makarenko E., Rühle T., Schünemann D., Jahns P., Weisshaar B., Nickelsen J., Leister D. (2010). The Arabidopsis thylakoid protein PAM68 is required for efficient D1 biogenesis and photosystem II assembly. Plant Cell 22: 3439–3460. - PMC - PubMed
    1. Aro E.M., Suorsa M., Rokka A., Allahverdiyeva Y., Paakkarinen V., Saleem A., Battchikova N., Rintamäki E. (2005). Dynamics of photosystem II: a proteomic approach to thylakoid protein complexes. J. Exp. Bot. 56: 347–356. - PubMed
    1. Ballottari M., Girardon J., Dall’osto L., Bassi R. (2012). Evolution and functional properties of photosystem II light harvesting complexes in eukaryotes. Biochim. Biophys. Acta 1817: 143–157. - PubMed
    1. Barbato R., Friso G., Rigoni F., Dalla Vecchia F., Giacometti G.M. (1992). Structural changes and lateral redistribution of photosystem II during donor side photoinhibition of thylakoids. J. Cell Biol. 119: 325–335. - PMC - PubMed

Publication types

MeSH terms

Substances