. 2015 Mar 15;308(6):F541-52.
doi: 10.1152/ajprenal.00456.2014. Epub 2015 Jan 13.

Flow regulation of endothelin-1 production in the inner medullary collecting duct

Affiliations

Flow regulation of endothelin-1 production in the inner medullary collecting duct

Meghana M Pandit et al. Am J Physiol Renal Physiol. .

Abstract

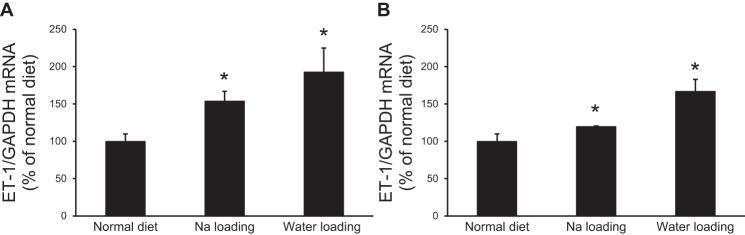
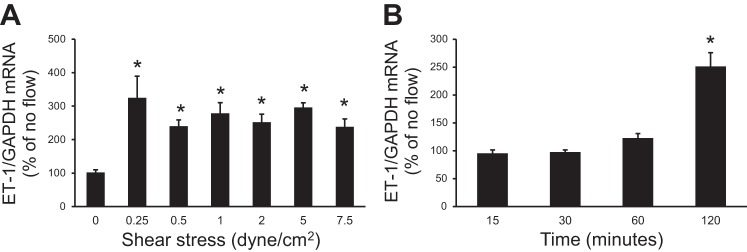
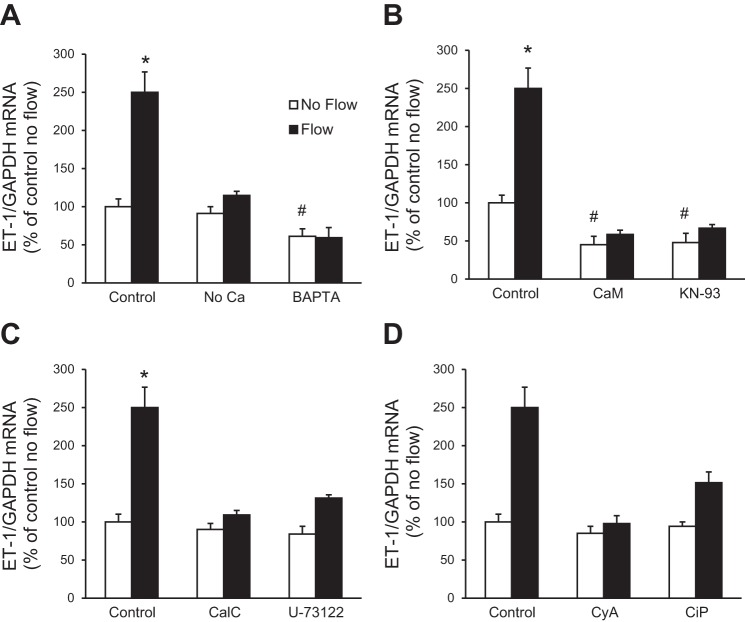
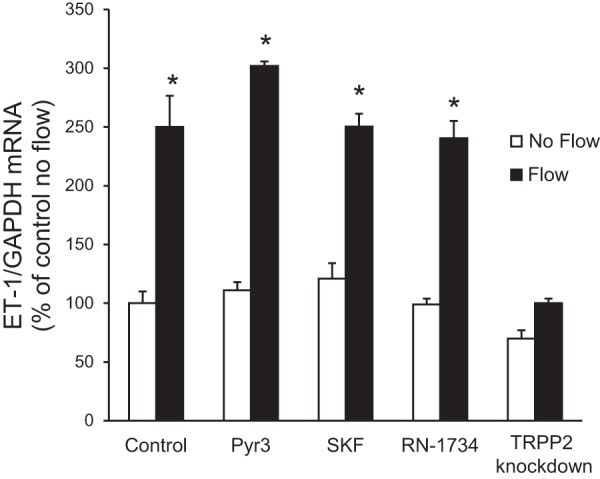
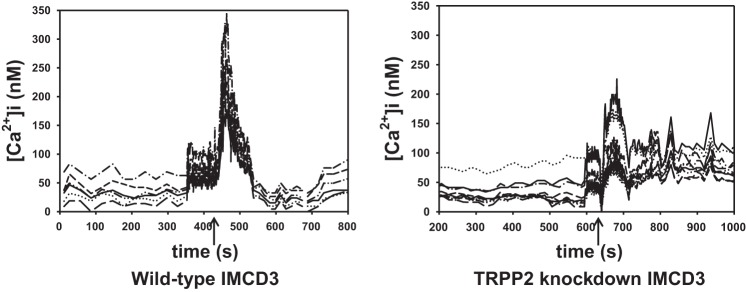
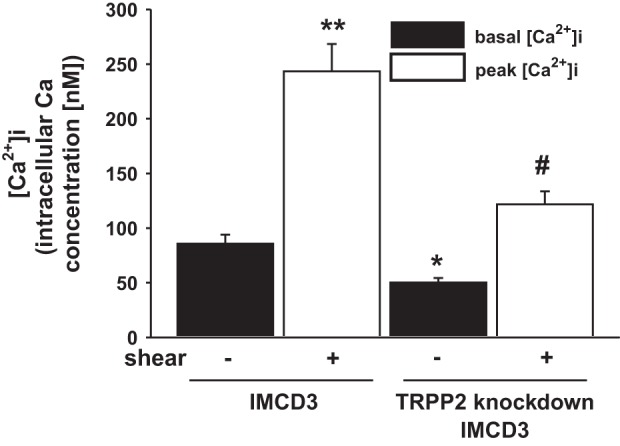
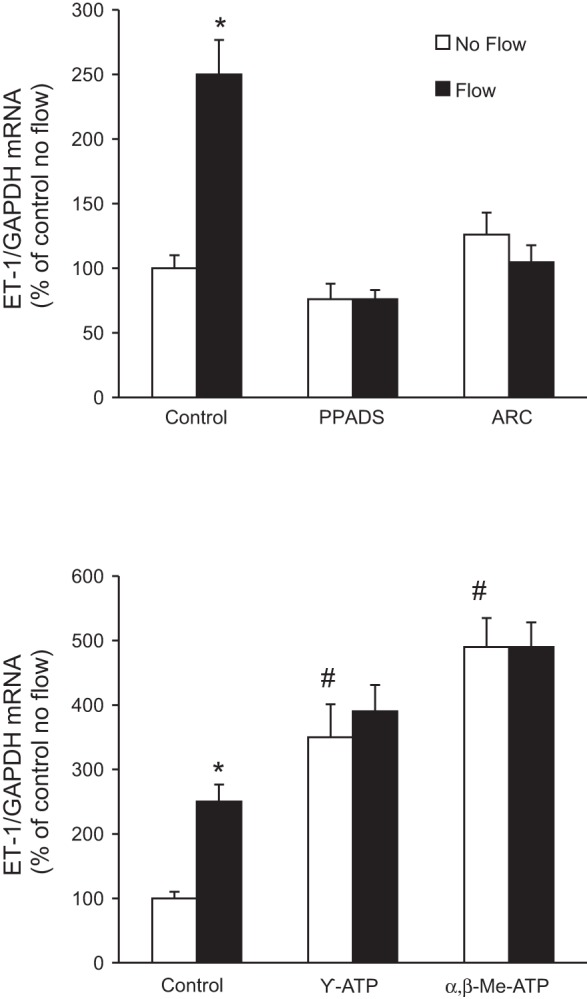
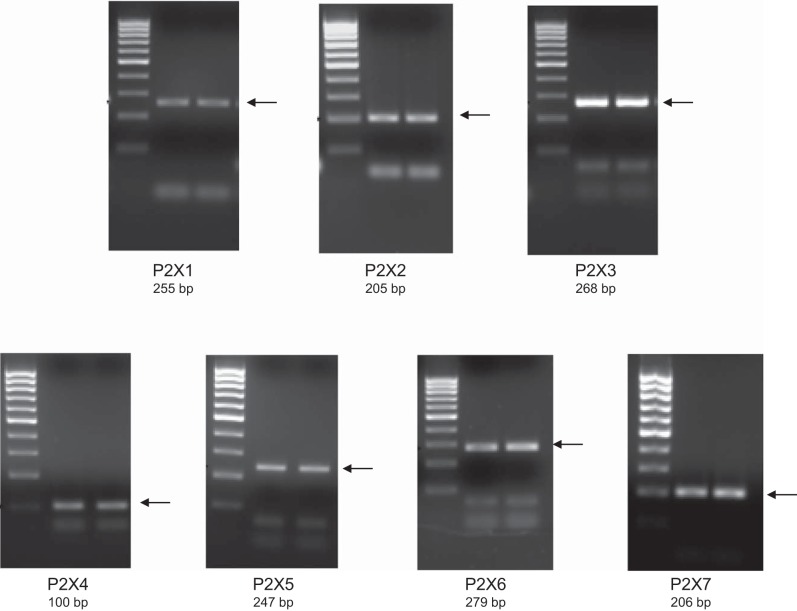
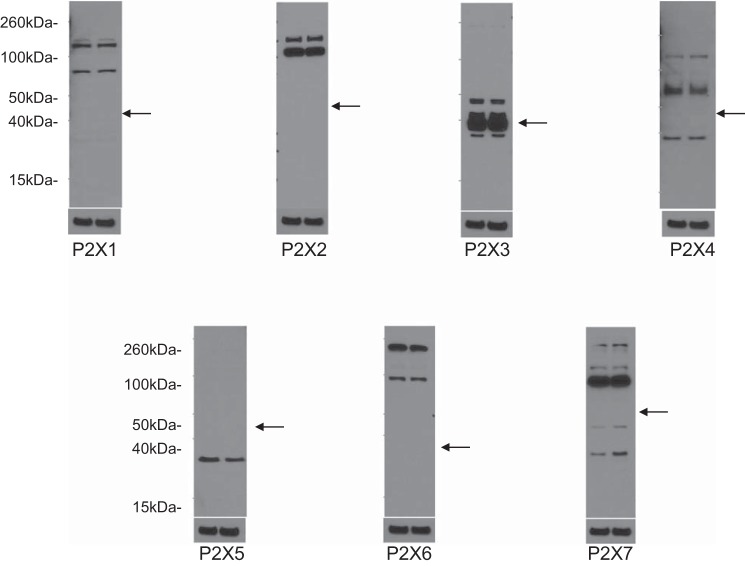
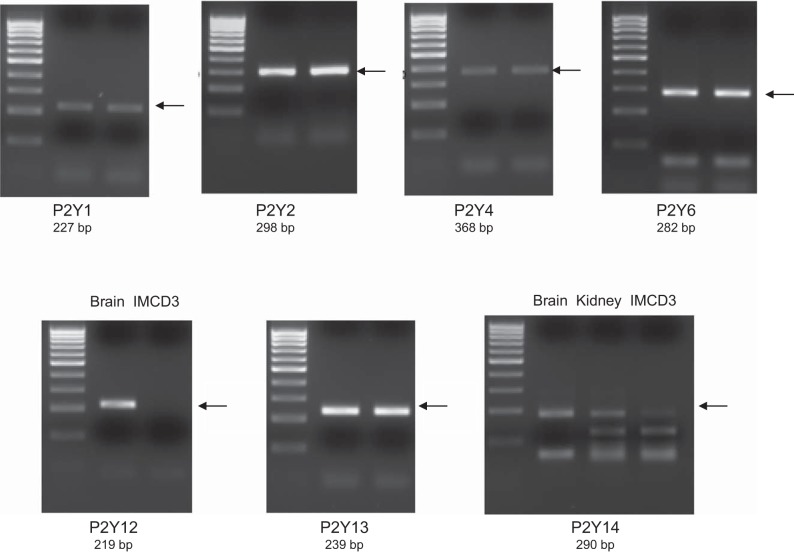
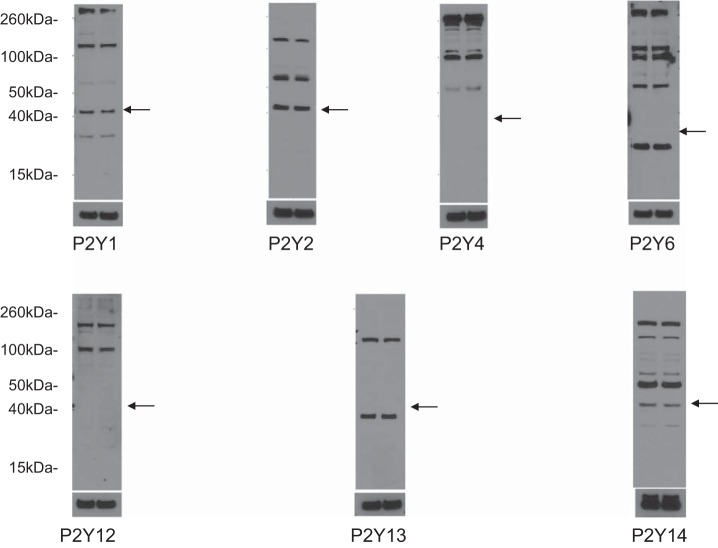
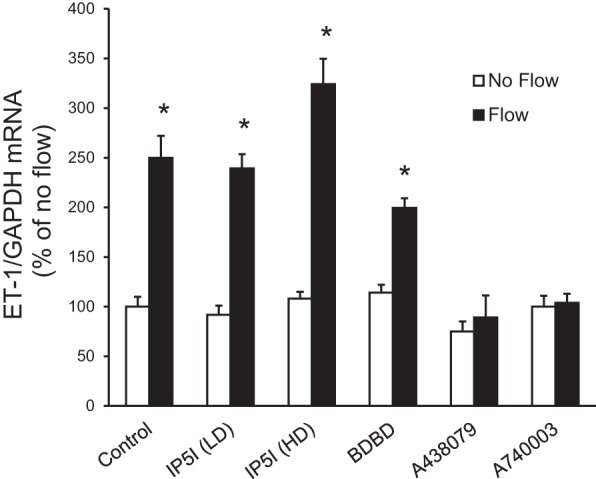
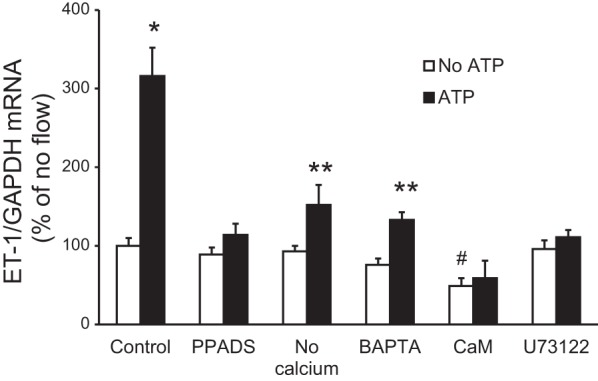
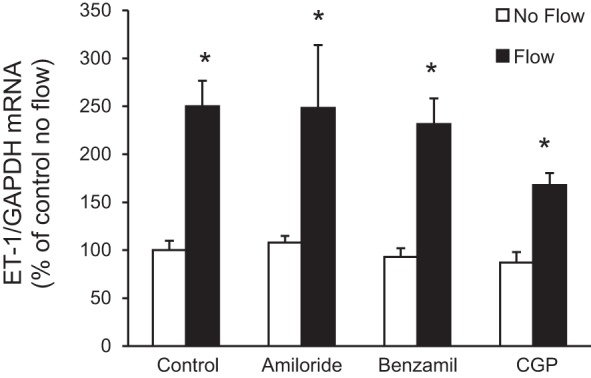
Collecting duct-derived endothelin (ET)-1 is an autocrine inhibitor of Na(+) and water reabsorption; its deficiency causes hypertension and water retention. Extracellular fluid volume expansion increases collecting duct ET-1, thereby promoting natriuresis and diuresis; however, how this coupling between volume expansion and collecting duct ET-1 occurs is incompletely understood. One possibility is that volume expansion increases tubular fluid flow. To investigate this, cultured IMCD3 cells were subjected to static or flow conditions. Exposure to a shear stress of 2 dyn/cm(2) for 2 h increased ET-1 mRNA content by ∼2.3-fold. Absence of perfusate Ca(2+), chelation of intracellular Ca(2+), or inhibition of Ca(2+) signaling (calmodulin, Ca(2+)/calmodulin-dependent kinase, calcineurin, PKC, or phospholipase C) prevented the flow response. Evaluation of possible flow-activated Ca(2+) entry pathways revealed no role for transient receptor potential (TRP)C3, TRPC6, and TRPV4; however, cells with TRPP2 (polycystin-2) knockdown had no ET-1 flow response. Flow increased intracellular Ca(2+) was blunted in TRPP2 knockdown cells. Nonspecific blockade of P2 receptors, as well as specific inhibition of P2X7 and P2Y2 receptors, prevented the ET-1 flow response. The ET-1 flow response was not affected by inhibition of either epithelial Na(+) channels or the mitochondrial Na(+)/Ca(2+) exchanger. Taken together, these findings provide evidence that in IMCD3 cells, flow, via polycystin-2 and P2 receptors, engages Ca(2+)-dependent signaling pathways that stimulate ET-1 synthesis.

Keywords: collecting duct; endothelin; flow; purinergic.


Figures

Fig. 1.
Fig. 1.
Effect of Na+ or water loading on inner medullary collecting duct (IMCD) endothelin (ET)-1 mRNA content in rats (A) and mice (B). For Na+ loading, rats and mice were fed a normal NaCl (0.25%) or high-NaCl (8%) diet for 3 days. For water loading, rats and mice were fed 1% sucrose in normal drinking water for 3 days. n = 3 for each data point. *P < 0.05 vs. animals fed a normal NaCl and water diet.
Fig. 2.
Fig. 2.
Dose response (A) and time course (B) of the flow effect on ET-1 mRNA levels in IMCD3 cells. For the dose response, cells were subjected to different shear stress for 2 h; for the time course, cells were exposed to a shear stress of 2 dyn/cm2 for different lengths of time. n = 12 for each data point. *P < 0.05 vs. cells not exposed to flow.
Fig. 3.
Fig. 3.
Effect of Ca2+ and inhibitors of Ca2+ signaling molecules on flow-regulated ET-1 mRNA in IMCD3 cells. Cells were preincubated with perfusate HBSS, Ca2+-free media, or 50 μM BAPTA-AM (an intercellular Ca2+ chelator) (A); 20 μM calmidazolium chloride [an inhibitor of calmodulin (CaM)] or 10 μM KN-93 [a CaM-dependent kinase (CaMK) inhibitor] (B); 0.1 μM calphostin C (CalC; a PKC inhibitor) or 2 μM U-71322 [a phospholipase C (PLC) inhibitor] (C); and 3 μg/ml cyclosporine A (CyA) or 10 μM calcineurin inhibitory peptide (CiP) (both inhibitors of calcineurin) (D) for 30 min. Cells were then subjected to static or flow (2 h at 2 dyn/cm2) conditions followed by the determination of ET-1/GAPDH mRNA levels. n = 12 for each data point. *P < 0.05 vs. cells treated identically but not exposed to flow; #P < 0.05 vs. the no-flow control.
Fig. 4.
Fig. 4.
Effect of transient receptor potential (TRP) channel inhibition or knockdown on flow-stimulated ET-1 mRNA levels in IMCD3 cells. For inhibitor experiments, cells were pretreated for 30 min with 10 μM Pyr3 (a TRPC3 inhibitor), 20 μM SKF-96365 (SKF; a TRPC6 inhibitor), or 30 μM RN-1734 (a TRPV4 inhibitor). To study the role of polycystin-2, IMCD3 cells with TRPP2 or TRPP2 knockdown were used. Cells were exposed to static or flow (2 h at 2 dyn/cm2) conditions followed by the determination of ET-1/GAPDH mRNA levels. n = 12 for each data point. *P < 0.05 vs. cells treated identically but not exposed to flow.
Fig. 5.
Fig. 5.
Representative tracings of flow-induced Ca2+ transients in IMCD3 wild-type and TRPP2 knockdown IMCD3 cells (the arrow identifies when flow was initiated). [Ca2+]i, intracellular Ca2+ concentration.
Fig. 6.
Fig. 6.
Effect of flow (0.4 dyn/cm2) on [Ca2+]i in IMCD3 cells with normal or knocked down TRPP2 expression. The time to peak [Ca2+]i was similar between the normal and TRPP2 knockdown cells; peak [Ca2+]i is shown at 60 s. n = 24 normal IMCD3 cells and 26 TRPP2 knockdown IMCD cells. *P < 0.05 vs. static normal IMCD3 cells; #P < 0.05 vs. static IMCD3 TRPP2 knockdown cells; **P < 0.05 vs. static normal IMCD3 cells.
Fig. 7.
Fig. 7.
Effect of P2X or P2Y2 inhibition (top) or P2 receptor agonists (bottom) on flow-stimulated ET-1 mRNA levels in IMCD3 cells. Cells were pretreated for 30 min with 30 μM pyridoxal-phosphate-6-azophenyl-2′,4′-disulfonate (PPADS; a P2X inhibitor), 10 μM ARC-118925 (ARC; a P2Y2 inhibitor), 30 μM γ-ATP (a purinergic receptor agonist more specific for P2Y receptors), or α,β-methylene (Me) ATP (a purinergic receptor agonist more specific for P2X receptors) and then exposed to static or flow (2 h at 2 dyn/cm2) conditions followed by the determination of ET-1/GAPDH mRNA levels. n = 10 for each data point. *P < 0.05 vs. cells treated identically but not exposed to flow; #P < 0.05 vs. the no-flow control.
Fig. 8.
Fig. 8.
RT-PCR analysis of P2X receptor mRNA expression in IMCD3 cells. Results from two separate IMCD samples are shown. Primer sequences used for each receptor are shown in Table 1. Arrows indicate the expected band size.
Fig. 9.
Fig. 9.
Western blot analysis of P2X receptor expression in IMCD3 cells. Results are shown in duplicate for each receptor subtype along with β-actin loading controls. Each of the two lanes was loaded with IMCD3 cell lysates (20 μg protein/lane). Predicted molecular sizes are shown in Table 2. Arrows represent the approximate predicted protein size based on the Accession Number database (http://www.uniprot.org/uniprot).
Fig. 10.
Fig. 10.
RT-PCR analysis of P2Y receptor mRNA expression in IMCD3 cells. Results from two separate IMCD3 samples are shown for all blots except P2Y12 and p2Y14. C57BL/6 mouse brain and kidney total RNA were used as positive controls for P2Y12 and/or p2Y14. Primer sequences used for each receptor are shown in Table 1. Arrows indicate the expected band size.
Fig. 11.
Fig. 11.
Western blot analysis of P2Y receptor expression in IMCD3 cells. Results are shown in duplicate for each receptor subtype along with β-actin loading controls. Each of the two lanes was loaded with IMCD3 cell lysates (20 μg protein/lane). Predicted molecular sizes are shown in Table 2. Arrows represent the approximate predicted protein size based on the Accession Number database (http://www.uniprot.org/uniprot).
Fig. 12.
Fig. 12.
Effect of P2X receptor isoform inhibition on flow-stimulated ET-1 mRNA levels in IMCD3 cells. Cells were pretreated for 30 min with 0.1 μM diinosine pentaphosphate [IP51 (LD); a P2X1 inhibitor], 10 μM diinosine pentaphosphate [1P51 (HD); a P2X3 inhibitor], 15 μM 5-BDBD (a P2X4 inhibitor), 50 μM A-438079 (a P2X7 inhibitor), or 20 μM A-740003 (a P2X7 inhibitor) and exposed to static or flow (2 h at 2 dyn/cm2) conditions followed by the determination of ET-1/GAPDH mRNA levels. n = 10 for each data point. *P < 0.05 vs. cells treated identically but not exposed to flow.
Fig. 13.
Fig. 13.
Effect of modulation of Ca2+, Ca2+-regulated pathways, or P2 receptor blockade on ATP-stimulated ET-1 mRNA levels in IMCD3 cells under stationary conditions. Cells were pretreated for 30 min with 30 μM PPADS (a P2X inhibitor), media lacking Ca2+, 50 μM BAPTA-AM (an intercellular Ca2+ chelator), 20 μM calmidazolium chloride (an inhibitor of CaM), or 2 μM U-71322 (a PLC inhibitor) followed by exposure to vehicle or 30 μM γ-ATP for 2 h and then the determination of ET-1/GAPDH mRNA levels. n = 8–10 per data point. *P < 0.05 vs. no ATP; **P < 0.05 vs. no ATP and vs. the ATP control (without inhibitor or no Ca2+ media); #P < 0.05 vs. the no ATP control.
Fig. 14.
Fig. 14.
Effect of epithelial Na+ channel or mitochondrial Na+/Ca2+ exchanger inhibition on flow-stimulated ET-1 mRNA levels in IMCD3 cells. Cells were pretreated for 30 min with either 1 μM amiloride, 0.2 μM benzamil, or 1.2 μM CGP-37157 (CGP; mitochondrial Na+/Ca2+ exchanger inhibitor) and exposed to static or flow (2 h at 2 dyn/cm2) conditions followed by the determination of ET-1/GAPDH mRNA levels. n = 12 for each data point. *P < 0.05 vs. cells treated identically but not exposed to flow.

Comment in

  • Sorting out the paracrine kidney.
    Christensen MG, Praetorius HA. Christensen MG, et al. Am J Physiol Renal Physiol. 2015 May 15;308(10):F1074-5. doi: 10.1152/ajprenal.00050.2015. Epub 2015 Feb 18. Am J Physiol Renal Physiol. 2015. PMID: 25694477 No abstract available.

References

    1. Abassi ZA, Klein H, Golomb E, Keiser HR. Regulation of the urinary excretion of endothelin in the rat. Am J Hypertens 6: 453–457, 1993. - PubMed
    1. Ahn D, Ge Y, Stricklett PK, Gill P, Taylor D, Hughes AK, Yanagisawa M, Miller L, Nelson RD, Kohan DE. Collecting duct-specific knockout of endothelin-1 causes hypertension and sodium retention. J Clin Invest 114: 504–511, 2004. - PMC - PubMed
    1. Ando J, Komatsuda T, Kamiya A. Cytoplasmic calcium response to fluid shear stress in cultured vascular endothelial cells. In Vitro Cell Dev Biol 24: 871–877, 1988. - PubMed
    1. Barton M, Kohan DE. Endothelin antagonists in clinical trials: lessons learned. Contrib Nephrol 172: 255–260, 2011. - PubMed
    1. Bugaj V, Pochynyuk O, Mironova E, Vandewalle A, Medina JL, Stockand JD. Regulation of the epithelial Na+ channel by endothelin-1 in rat collecting duct. Am J Physiol Renal Physiol 295: F1063–F1070, 2008. - PMC - PubMed

Publication types

LinkOut - more resources