. 2015 Jan 13;8(359):ra5.
doi: 10.1126/scisignal.2005774.

MAPK feedback encodes a switch and timer for tunable stress adaptation in yeast

Affiliations

MAPK feedback encodes a switch and timer for tunable stress adaptation in yeast

Justin G English et al. Sci Signal. .

Abstract

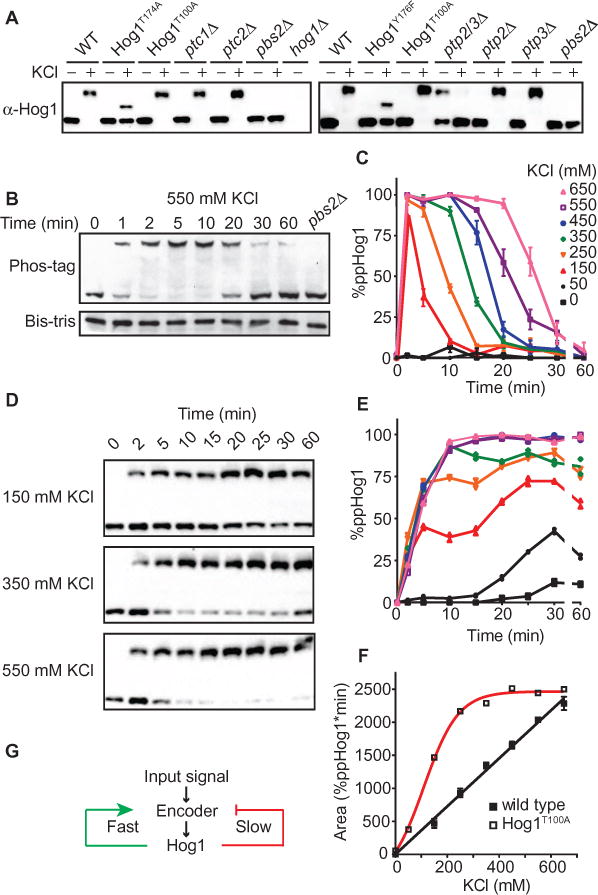
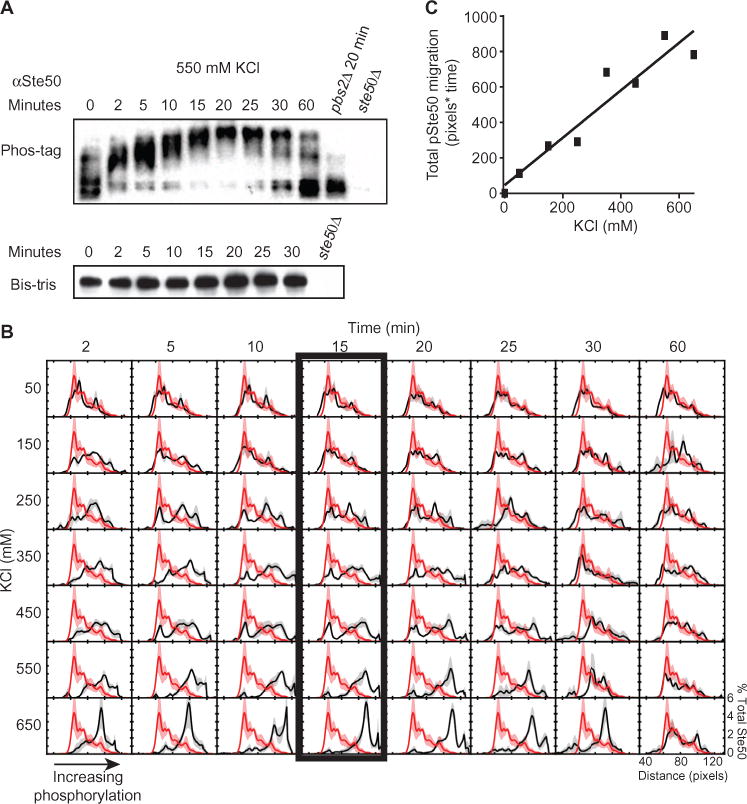
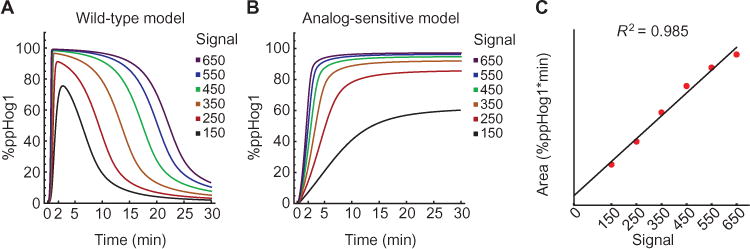
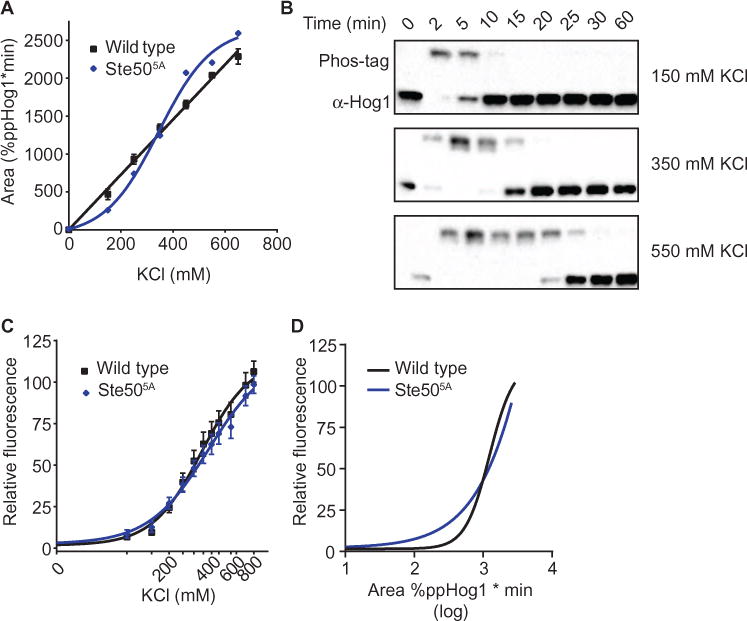
Signaling pathways can behave as switches or rheostats, generating binary or graded responses to a given cell stimulus. We evaluated whether a single signaling pathway can simultaneously encode a switch and a rheostat. We found that the kinase Hog1 mediated a bifurcated cellular response: Activation and commitment to adaptation to osmotic stress are switchlike, whereas protein induction and the resolution of this commitment are graded. Through experimentation, bioinformatics analysis, and computational modeling, we determined that graded recovery is encoded through feedback phosphorylation and a gene induction program that is both temporally staggered and variable across the population. This switch-to-rheostat signaling mechanism represents a versatile stress adaptation system, wherein a broad range of inputs generate an "all-in" response that is later tuned to allow graded recovery of individual cells over time.


Conflict of interest statement

Competing interests: The authors declare that they have no competing interests.

Figures

Fig. 1
Fig. 1. The Hog1 signaling profile is a linear transducer that converts dose to duration
(A) Validation of the Phos-tag method for resolving dually phosphorylated and activated (top band) or nonphosphorylated and unactivated (bottom band) Hog1. Cells untreated (−) or treated for 5 min (+) with 550 mM KCl were lysed, resolved by Phos-tag SDS-PAGE, and immunoblotted with Hog1 antibodies. Hog1T174A and Hog1Y176F, mutants lacking one of two phosphorylation sites; Hog1T100A, analog-sensitive mutant; ptc1Δ and ptc2Δ, serine/threonine phosphatase mutants; ptp2Δ and ptp3Δ, tyrosine phosphatase mutants; pbs2Δ and hog1Δ, MAPKK and MAPK mutants, respectively. Data are representative of two experiments. (B) Hog1 activation over time. Wild-type (WT) cells were treated with 550 mM KCl, lysed, and probed by immunoblotting with Hog1 antibodies. Top, Phos-tag SDS PAGE. Bottom, identical samples processed by SDS-PAGE in the absence of Phos-tag. pbs2Δ cells served as a negative control. Data are representative of two experiments. (C) Hog1 signaling profile. WT cells were exposed to the indicated concentrations of KCl. Percentage of dually phosphorylated Hog1 (ppHog1) was calculated by dividing intensity of the upper band by the total intensity of all Hog1 bands in each lane. Data are means ± SEM (n > 3 experiments). (D) Hog1T100A activation by the indicated concentrations of KCl in the presence of the inhibitor 1-NA-PP1. Lysates were resolved by Phos-tag SDS-PAGE and immunoblotted with Hog1 antibodies. Data are representative of two experiments. (E) Hog1T100A signaling profile in the presence of the kinase inhibitor 1-NA-PP1 (n = 2). (F) Data from (C) and (E) are presented as area under the curve. (G) Diagram of potential positive and negative feedback represented by green and red lines, respectively.
Fig. 2
Fig. 2. Feedback phosphorylation of Ste50 is dose-dependent
(A). Ste50 phosphorylation over time. WT and the indicated mutant strains were treated with 550 mM KCl, harvested, and immunoblotted for Ste50. Top, Phos-tag SDS PAGE. Bottom, identical samples in the absence of Phos-tag. (B) Ste50 phosphorylation profile. WT cells were treated as in (A) with the indicated concentrations of KCl. Red, mean Ste50 distribution measured from unstimulated cells; black, mean Ste50 distribution measured for each dose and time in the variable matrix. Shading, ±SEM (red and gray) (n = 3). (C) Integration of the Ste50 phosphorylation profile. Data are presented as mean area under the curve ± SEM.
Fig. 3
Fig. 3. Modeling positive and negative feedback by Hog1
Mathematical model of activated Hog1 (ppHog1, y axis) over time (x axis) as a function of six input signal strengths. (A) Hog1 signaling profile. Model includes Hog1 activation that induces feedback. (B) Hog1T100A signaling profile. Model allows Hog1 activation but has no feedback. (C) Integration of Hog1 signaling profile. The total amount of activated Hog1 produced for each input signal (x axis) is computed by integrating each curve in (A) (y axis).
Fig. 4
Fig. 4. Hog1 encodes dose-to-duration signaling through graded phosphorylation
(A) Integration of the Hog1 signaling profile for the Ste505A strain. WT is shown for reference (see Fig. 1). Data from fig. S3 are presented as area under the curve for Ste505A. (B) Representative data from the signaling in (A). Lysates were resolved by Phos-tag SDS-PAGE and immunoblotted for Hog1. (C) Transcription reporter data for WT and Ste505A. Data are mean relative fluorescence ± SEM (n > 4). 0, untreated control. (D) Comparison of transcriptional output to total Hog1 activity. Computational transformation of data in (C), where x-axis values are replaced using Hog1 duration as determined in (A) for WT and Ste505A. See also fig. S3 for the Hog1 signaling profile for the Ste505A strain used to compute (A).
Fig. 5
Fig. 5. The Hog1 signaling profile can be reengineered through component gene deletions
(A) Diagram of the Hog1 signaling pathway. Gray circles, pathway component deletions without effect. Black circles, essential pathway components that were not evaluated. The other colored circles represent genes that altered either the Hill slope, EC50, or both for the transcriptional reporter response. (B) Summary of transcription reporter data. 8XCRE-LacZ Hill slope and EC50 for each mutant strain plotted relative to WT (black dot) and color-coded as in (A). Only significant (P < 0.05) changes are displayed. (C) Rank order of change in transcription reporter EC50 and Hill slope for each mutant strain relative to WT. Data are mean relative fluorescence ± SEM (n > 4). Statistical significance was calculated by two-tailed t test (*P < 0.05).
Fig. 6
Fig. 6. The Hog1 signaling profile is insufficient to predict downstream output
(A) Transcription reporter dose-response curves for WT, ssk1Δ, rga1Δ, and hog1Δ strains. Data are mean relative fluorescence ± SEM (n > 4). (B) Integration of Hog1 signaling profiles for ssk1Δ (top) and rga1Δ (bottom) strains. WT is shown for reference (see Fig. 1). (C) Top, representative data from (B). Bottom, representative time course for WT and rga1Δ strains in the nonlinear range for the mutant. Lysates were resolved by Phos-tag SDS-PAGE and immunoblotted for Hog1. (D) Comparison of transcriptional output to total Hog1 activity. Computational transformation of data in (A), where x-axis values correspond to the Hog1 duration values determined in (B) for WT, ssk1Δ, and rga1Δ.
Fig. 7
Fig. 7. Hog1 executes a tiered adaptive protein induction program over time
(A) mRNA content quantified from WT cells every 15 min after the initial stimulation with 700 mM NaCl (54) and sorted with respect to time until >2-fold log2 change was achieved. Scale is log2 fold change with respect to unstimulated cells. (B) GO analysis of clusters 1, 2, 3, and 4 from (A). Numerals represent total number of unique genes in each category. (C) GFP-tagged protein abundance measured by flow cytometry. Candidates were selected at random from those identified in (A) and treated with 0, 350, or 650 mM KCl for 30 min. Each data point represents change in mean GFP intensity relative to the unstimulated control for each strain; all data represent >10,000 individual cell counts. (D) Mean change in protein abundance (left) and CV (right) for cells treated with 350 or 650 mM KCl for 30 min. The parent cluster for each protein is represented by the colors gray (cluster 1), yellow (cluster 2), cyan (cluster 3), and red (cluster 4). Mean values for each cluster are indicated.

References

    1. Huff K, End D, Guroff G. Nerve growth factor-induced alteration in the response of PC12 pheochromocytoma cells to epidermal growth factor. J Cell Biol. 1981;88:189–198. - PMC - PubMed
    1. Wagner EF, Nebreda ÁR. Signal integration by JNK and p38 MAPK pathways in cancer development. Nat Rev Cancer. 2009;9:537–549. - PubMed
    1. Webber JL, Tooze SA. Coordinated regulation of autophagy by p38a MAPK through mAtg9 and p38IP. EMBO J. 2010;29:27–40. - PMC - PubMed
    1. Brewster JL, de Valoir T, Dwyer ND, Winter E, Gustin MC. An osmosensing signal transduction pathway in yeast. Science. 1993;259:1760–1763. - PubMed
    1. Rouse J, Cohen P, Trigon S, Morange M, Alonso-Llamazares A, Zamanillo D, Hunt T, Nebreda AR. A novel kinase cascade triggered by stress and heat shock that stimulates MAPKAP kinase-2 and phosphorylation of the small heat shock proteins. Cell. 1994;78:1027–1037. - PubMed

Publication types

MeSH terms

Substances

LinkOut - more resources