

Asynchronous Magnetic Bead Rotation (AMBR) Microviscometer for Label-Free DNA Analysis
- PMID: 25587411
- PMCID: PMC4264372
- DOI: 10.3390/bios4010076
Asynchronous Magnetic Bead Rotation (AMBR) Microviscometer for Label-Free DNA Analysis
Abstract
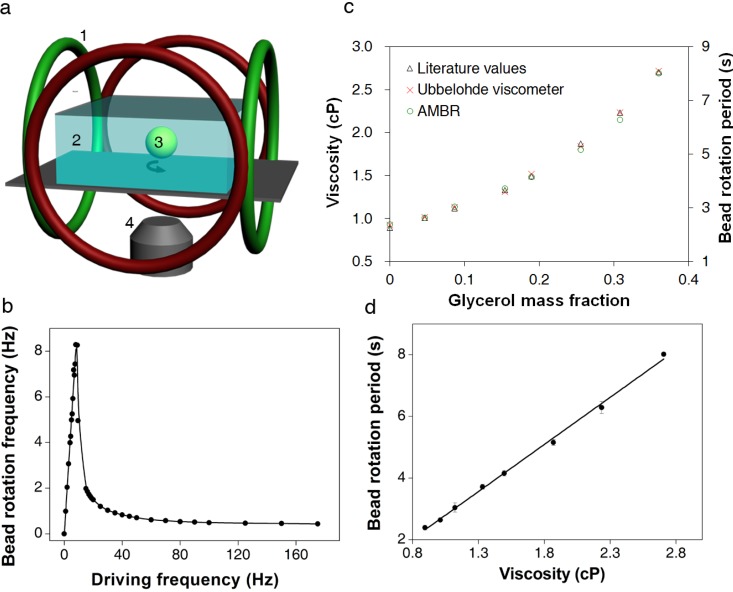
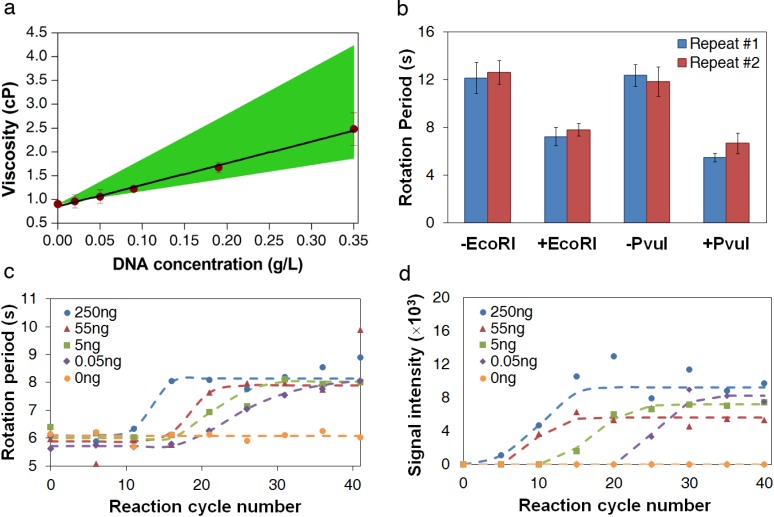
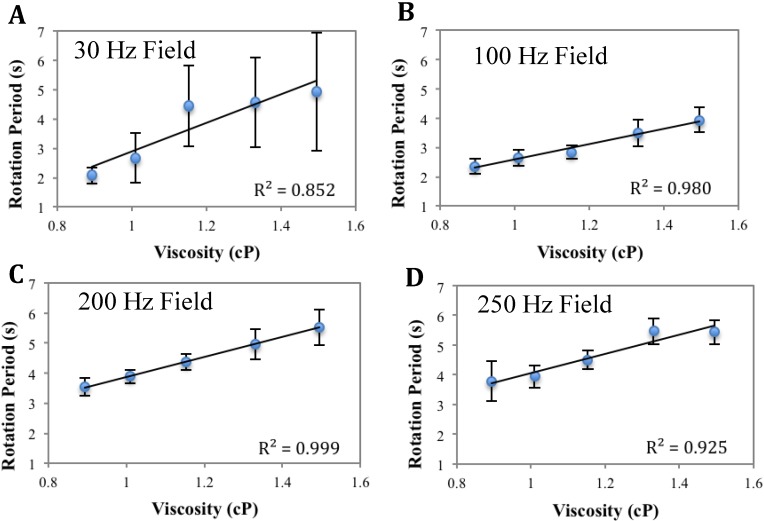
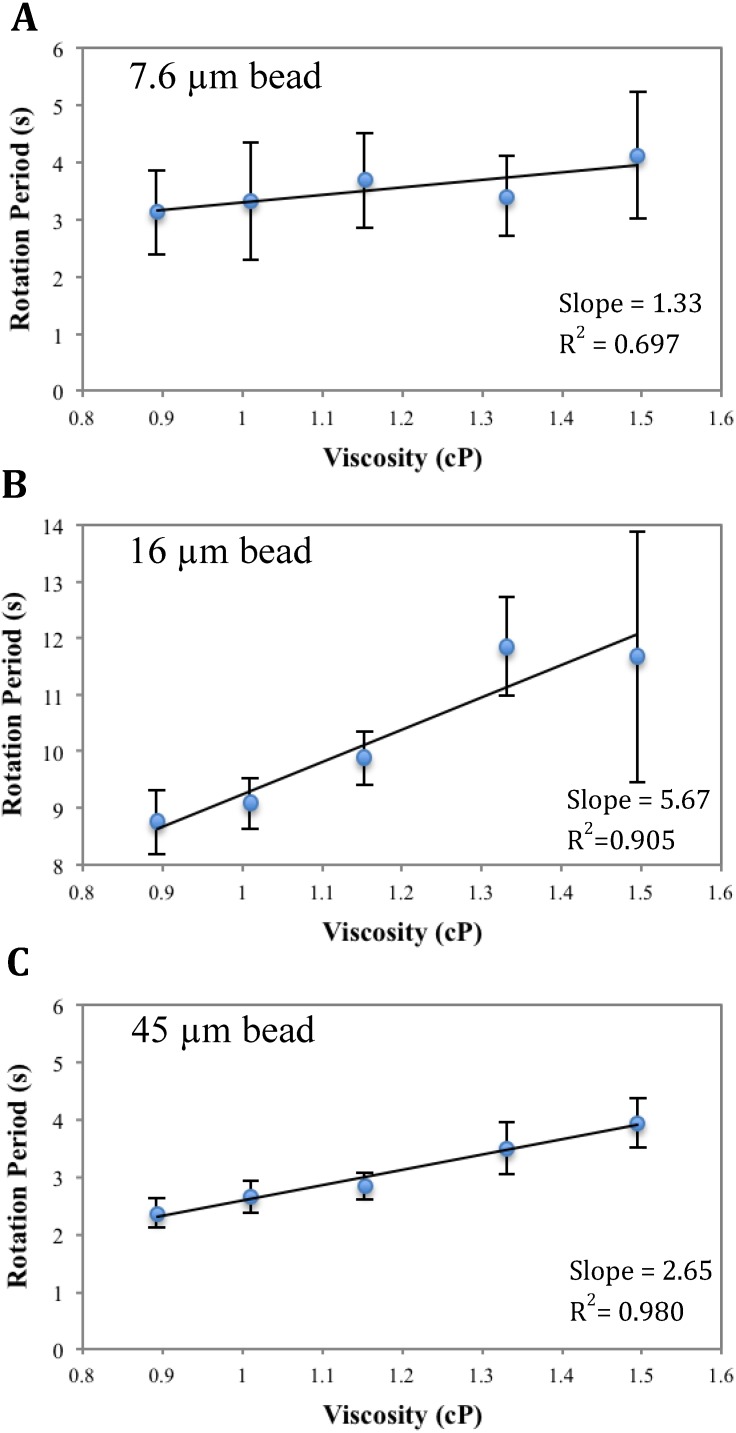
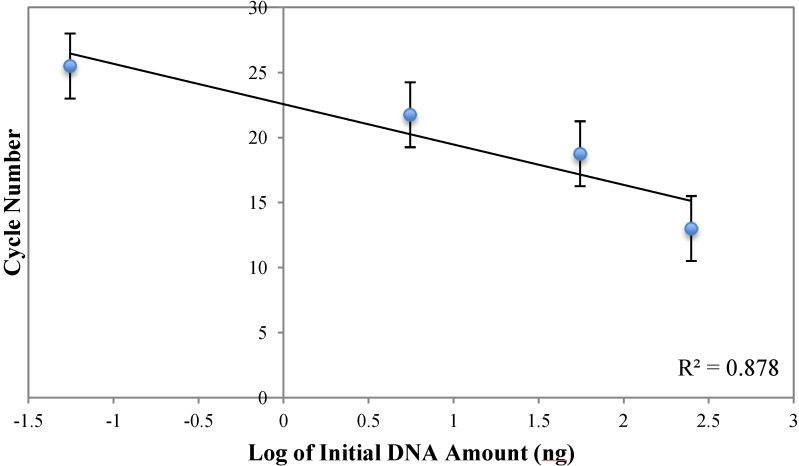
We have developed a label-free viscosity-based DNA detection system, using paramagnetic beads as an asynchronous magnetic bead rotation (AMBR) microviscometer. We have demonstrated experimentally that the bead rotation period is linearly proportional to the viscosity of a DNA solution surrounding the paramagnetic bead, as expected theoretically. Simple optical measurement of asynchronous microbead motion determines solution viscosity precisely in microscale volumes, thus allowing an estimate of DNA concentration or average fragment length. The response of the AMBR microviscometer yields reproducible measurement of DNA solutions, enzymatic digestion reactions, and PCR systems at template concentrations across a 5000-fold range. The results demonstrate the feasibility of viscosity-based DNA detection using AMBR in microscale aqueous volumes.
Keywords: DNA; genetic analysis; label-free; magnetic; microdevice; paramagnetic; quantitative PCR; restriction digestion; viscometer; viscosity.
Figures
Similar articles
-
Asynchronous magnetic bead rotation microviscometer for rapid, sensitive, and label-free studies of bacterial growth and drug sensitivity.Anal Chem. 2012 Jun 19;84(12):5250-6. doi: 10.1021/ac300128p. Epub 2012 Jun 1. Anal Chem. 2012. PMID: 22507307 Free PMC article.
-
High frequency asynchronous magnetic bead rotation for improved biosensors.Appl Phys Lett. 2010 Nov 29;97(22):223701. doi: 10.1063/1.3505492. Appl Phys Lett. 2010. PMID: 21200442 Free PMC article.
-
Label-acquired magnetorotation for biosensing: An asynchronous rotation assay.J Magn Magn Mater. 2011 Feb;323(3-4):272-278. doi: 10.1016/j.jmmm.2010.09.014. J Magn Magn Mater. 2011. PMID: 23105167 Free PMC article.
-
Monitoring the growth and drug susceptibility of individual bacteria using asynchronous magnetic bead rotation sensors.Biosens Bioelectron. 2011 Jan 15;26(5):2751-5. doi: 10.1016/j.bios.2010.10.010. Epub 2010 Oct 14. Biosens Bioelectron. 2011. PMID: 21095112 Free PMC article.
-
Asynchronous magnetic bead rotation (AMBR) biosensor in microfluidic droplets for rapid bacterial growth and susceptibility measurements.Lab Chip. 2011 Aug 7;11(15):2604-11. doi: 10.1039/c0lc00734j. Epub 2011 Jun 10. Lab Chip. 2011. PMID: 21666890
Cited by
-
Periodic blinking manipulation of magnetic Janus particles with a tunable electromagnetic field for rapid sensing of extracellular vesicles.Front Bioeng Biotechnol. 2025 Apr 25;13:1565479. doi: 10.3389/fbioe.2025.1565479. eCollection 2025. Front Bioeng Biotechnol. 2025. PMID: 40352358 Free PMC article.
-
Nanotechnology for photodynamic therapy: a perspective from the Laboratory of Dr. Michael R. Hamblin in the Wellman Center for Photomedicine at Massachusetts General Hospital and Harvard Medical School.Nanotechnol Rev. 2015 Aug;4(4):359-372. doi: 10.1515/ntrev-2015-0027. Epub 2015 Aug 7. Nanotechnol Rev. 2015. PMID: 26640747 Free PMC article.
-
Micro-Viscometer for Measuring Shear-Varying Blood Viscosity over a Wide-Ranging Shear Rate.Sensors (Basel). 2017 Jun 20;17(6):1442. doi: 10.3390/s17061442. Sensors (Basel). 2017. PMID: 28632151 Free PMC article.
References
-
- Tang Y.-W., Procop G.W., Persing D.H. Molecular diagnostics of infectious diseases. Clin. Chem. 1997;43:2021–2038. - PubMed
-
- Mandal P., Biswas A., Choi K., Pal U. Methods for rapid detection of foodborne pathogens: An overview. Am. J. Food Technol. 2011;6:87–102. doi: 10.3923/ajft.2011.87.102. - DOI
-
- Landegren U., Kaiser R., Caskey C.T., Hood L. DNA diagnostics—Molecular techniques and automation. Science. 1988;242:229–237. - PubMed
Grants and funding
LinkOut - more resources
Full Text Sources
Other Literature Sources
