. 2015;16(2):253-60.
doi: 10.1080/15384047.2014.1001271.

Inhibition of plasminogen activator inhibitor-1 is a potential therapeutic strategy in ovarian cancer

Affiliations

Inhibition of plasminogen activator inhibitor-1 is a potential therapeutic strategy in ovarian cancer

Satsuki Mashiko et al. Cancer Biol Ther. 2015.

Abstract

Plasminogen activator inhibitor (PAI)-1 is predictive of poor outcome in several types of cancer. The present study investigated the biological role for PAI-1 in ovarian cancer and potential of targeted pharmacotherapeutics. In patients with ovarian cancer, PAI-1 mRNA expression in tumor tissues was positively correlated with poor prognosis. To determine the role of PAI-1 in cell proliferation in ovarian cancer, the effects of PAI-1 inhibition were examined in PAI-1-expressing ovarian cancer cells. PAI-1 knockdown by small interfering RNA resulted in significant suppression of cell growth accompanied with G2/M cell cycle arrest and intrinsic apoptosis. Similarly, treatment with the small molecule PAI-1 inhibitor TM5275 effectively blocked cell proliferation of ovarian cancer cells that highly express PAI-1. Together these results suggest that PAI-1 promotes cell growth in ovarian cancer. Interestingly, expression of PAI-1 was increased in ovarian clear cell carcinoma compared with that in serous tumors. Our results suggest that PAI-1 inhibition promotes cell cycle arrest and apoptosis in ovarian cancer and that PAI-1 inhibitors potentially represent a novel class of anti-tumor agents.

Keywords: PAI-1, plasminogen activator inhibitor-1; PARP, poly (ADP-ribose) polymerase; PI, propidium iodide; TM5275; cancer therapeutics; clear cell carcinoma of the ovary; ovarian cancer; plasminogen activator inhibitor-1; plasminogen activator inhibitor-1 inhibitor; siRNA, small interfering RNA; uPA, urokinase-type plasminogen activator.


Figures

Figure 1.
Figure 1.
Correlation of PAI-1 mRNA expression with survival of patients with ovarian cancer. Microarray expression data for 2 probe sets representing SERPINE1 (A: 202627_s_at, and B: 202628_s_at) were used to generate Kaplan–Meier survival curves for high expression (defined as cancers with values above the median) or low expression for ovarian cancers. Data were analyzed using GraphPad Prism.
Figure 2.
Figure 2.
PAI-1 expression in ovarian cancer cell lines. ES-2, JHOC-9, JHOC-5, SKOV3, JHOC-7 and JHOC-8 cells were harvested and whole cell lysates were prepared. Proteins were subjected to immunoblot analysis with antibodies specific for PAI-1 and β-actin. Equal amounts of protein (10 μg) were loaded in each lane.
Figure 3.
Figure 3.
Effect of PAI-1 siRNA on cell viability, cell cycle distribution, and apoptosis in ovarian cancer ES-2 cells. ES-2 cells were transfected with 5 nM control siRNA (#1 and #2) or 5 nM PAI-1 siRNA (#1, #2 and #3) for up to 96 h. (A) After 72 h transfection, ES-2 cells were harvested and whole cell lysates were prepared. Proteins were subjected to immunoblot analysis with antibodies specific for PAI-1 and β-actin. Equal amounts of protein (5 μg) were loaded in each lane. (B) Cell viability was determined by CellTiter-Glo assay following transfection with siRNA for the indicated periods of time. Values are means ± SD. At 48 h post-transfection, the viability of ES-2 cells transfected with PAI-1 siRNA (#1, #2 and #3) was significantly decreased compared with that of control siRNA (#2) (P < 0.01 by Student t test for 2 variables). At 72 and 96 h post-transfection, the viability of ES-2 cells transfected with PAI-1 siRNA (#1, #2 and #3) was significantly decreased compared with cells transfected with control siRNA (#1 and #2). P < 0.01 at 72 h; P < 0.001 at 96 h by Student t test for 2 variables. (n = 8). (C) ES-2 cells were transfected with 5 nM control siRNA #1 or 5 nM PAI-1 siRNA #2 for 72 h. After fixation, cells were stained with PtdIns. Cell cycle distribution was determined by FACS with FlowJo analysis. Representative FACS results of cells transfected with control siRNA (upper left panel) or PAI-1 siRNA (upper right panel) are shown. Cell cycle distribution from 3 independent experiments. Values are means ± SEM. **P < 0.005 by Student t test for 2 variables. (D) ES-2 cells transfected with 5 nM control siRNA#1 (upper left panel) or 5 nM PAI-1 siRNA #2 (upper right panel) for 72 h. Cells were stained with FITC-conjugated Annexin V and PI, and FACS analysis was performed. Representative FACS results are shown. PI-negative and Annexin-V-positive cells from 3 experiments. Values are means ± SE. (E) ES-2 or JHOC-9 cells transfected with 5 nM control siRNA #2 or PAI-1 siRNAs (#1, #2 and #3) for 72 h were harvested and whole cell lysates were prepared. Proteins were subjected to immunoblot analysis with antibodies specific for cleaved PARP, intact PARP and β-actin. Equal amounts of protein (5 μg) were loaded in each lane. (F and G) ES-2 or JHOC-9 cells were transfected with the indicated siRNAs. After 72 h, activation of caspase 3/7 or caspase 8 was assessed by Caspase-Glo 3/7 or Caspase-Glo8, respectively. Values are means ± SE (n = 4). P values were determined by Student t test, control siRNA vs. PAI-1 siRNA. (H) ES-2 or JHOC-9 cells were transfected with the indicated siRNAs. After 72 h, cells were fixed and stained with cytochrome c antibody (green) and Hoechst33342 (blue). Imaging was performed by confocal microscopy. White allows show cells with cytochrome c released from mitochondria to cytoplasm.
Figure 4.
Figure 4.
Effects of TM5275 on cell viability, cell cycle distribution and apoptosis induction in ovarian clear cell adenocarcinoma cells. (A) Chemical structure of TM5275. (B) ES-2, JHOP-9, JHOC-5, SKOV3, JHOC-7 and JHOC-8 cells were treated with the indicated concentrations of TM5275 for 72 h. Cell viability was determined by CellTiter-Glo assay in 3 experiments. Values are means ± SD. IC50 in individual cell lines is shown in Table 1. (C) ES2 were treated with DMSO (control) or 100 μM TM5275 for the indicated periods. Cell growth was determined by CellTiter-Glo assay (n = 3). (D) After TM5275 treatment for 96 h, cell culture media of ES2 cells were harvested. Active PAI-1 amounts were determined by active human PAI-1 functional assay ELISA kit (n = 4). (E) ES-2 cells were treated with DMSO (upper left panel) or 100 μM TM5275 (upper right panel) for 24 h. After fixation, cells were stained with PI. Cell cycle distribution was determined by FACS with FlowJo analysis. Representative FACS results are shown. Cell cycle distribution from 3 independent experiments. Values are means ± SE. *P < 0.05 by Student t test for 2 variables (n = 3). (F) ES-2 cells were treated with DMSO (upper left panel) or 100 μM TM5275 (upper right panel) for 24 h. Cells were stained with FITC-conjugated Annexin V and PI, and FACS analysis was performed. Representative FACS results are shown. PI-negative and Annexin-V-positive cells from 3 experiments. Values are means ± SE. *P < 0.005 by Student t test for 2 variables (n = 3).
Figure 5.
Figure 5.
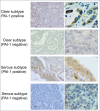
PAI-1 expression in different histological subtypes of human ovarian carcinoma. Cancer tissues were stained with PAI-1 antibody. Representative examples of PA1-1-positive and -negative immunostaining in tissues of ovarian clear cell and serous adenocarcinoma, respectively (original magnification: left panels, 200×; right panels, 1,000×). Scale bars represent 50 or 100 μm (left panels), and 20 μm (right panels).

References

    1. Siegel R, Naishadham D, Jemal A. Cancer statistics, 2012. CA Cancer J Clin 2012; 62:10-29; PMID:22237781; http://dx.doi.org/10.3322/caac.20138 - DOI - PubMed
    1. Kohler HP, Grant PJ. Plasminogen-activator inhibitor type 1 and coronary artery disease. N Engl J Med 2000; 342:1792-801; PMID:10853003; http://dx.doi.org/10.1056/NEJM200006153422419 - DOI - PubMed
    1. Schuliga M, Westall G, Xia Y, Stewart AG. The plasminogen activation system: new targets in lung inflammation and remodeling. Curr Opin Pharmacol 2013; 13:386-93; PMID:23735578; http://dx.doi.org/10.1016/j.coph.2013.05.014 - DOI - PubMed
    1. Allgayer H, Heiss MM, Schildberg FW. Prognostic factors in gastric cancer. Br J Surg 1997; 84:1651-64; PMID:9448610; http://dx.doi.org/10.1002/bjs.1800841206 - DOI - PubMed
    1. Berger DH. Plasmin/plasminogen system in colorectal cancer. World J Surg 2002; 26:767-71; PMID:11965442; http://dx.doi.org/10.1007/s00268-002-4050-8 - DOI - PubMed

Publication types

MeSH terms

Substances