

Low-temperature NMR characterization of reaction of sodium pyruvate with hydrogen peroxide
- PMID: 25587753
- PMCID: PMC4782753
- DOI: 10.1021/jp511831b
Low-temperature NMR characterization of reaction of sodium pyruvate with hydrogen peroxide
Abstract
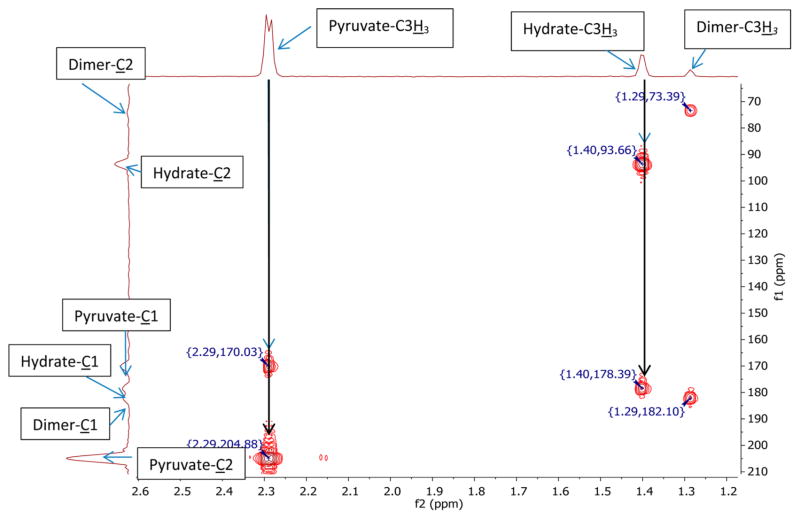
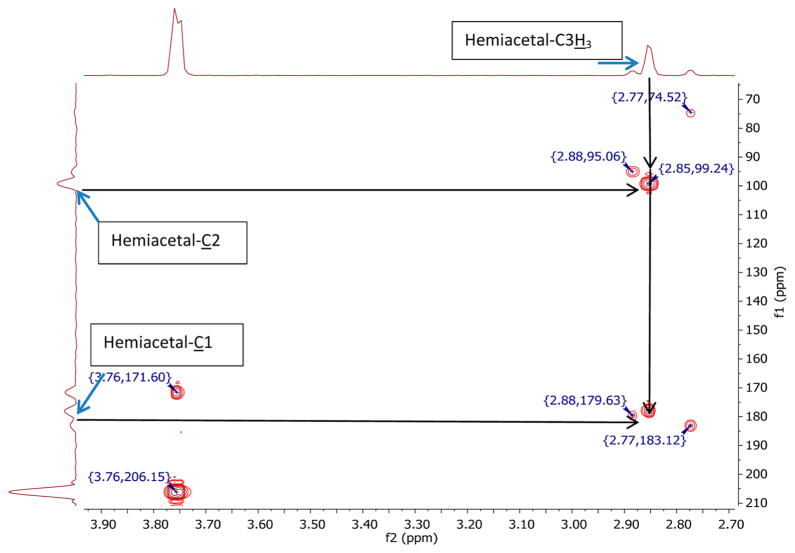
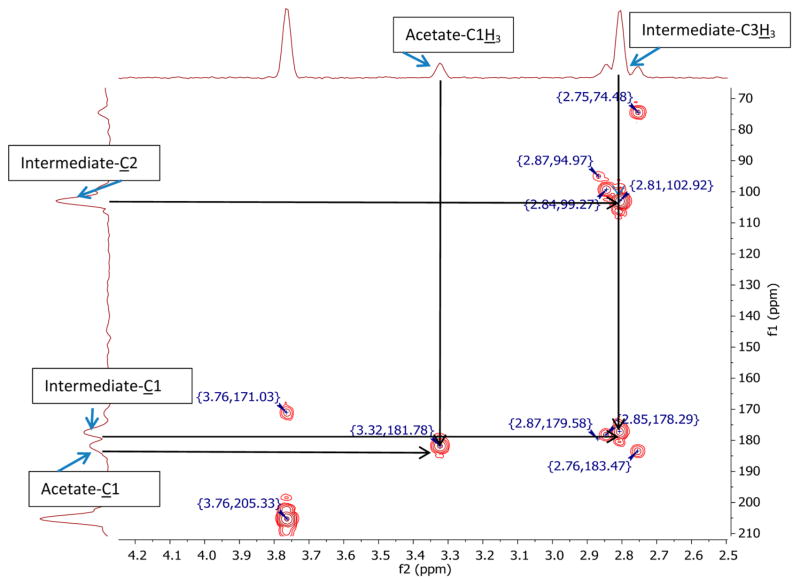
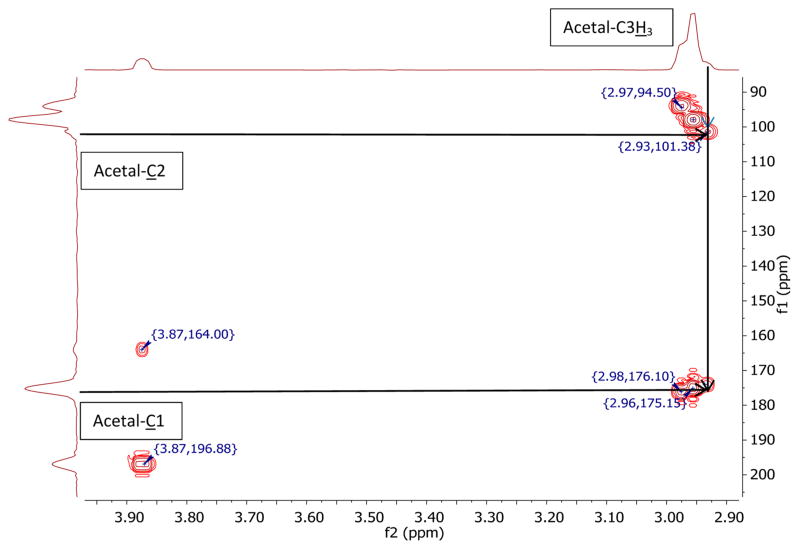
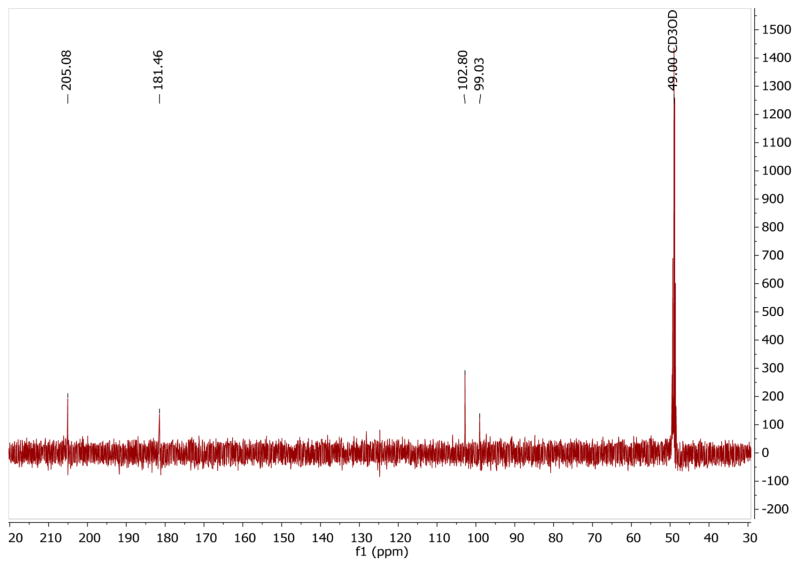
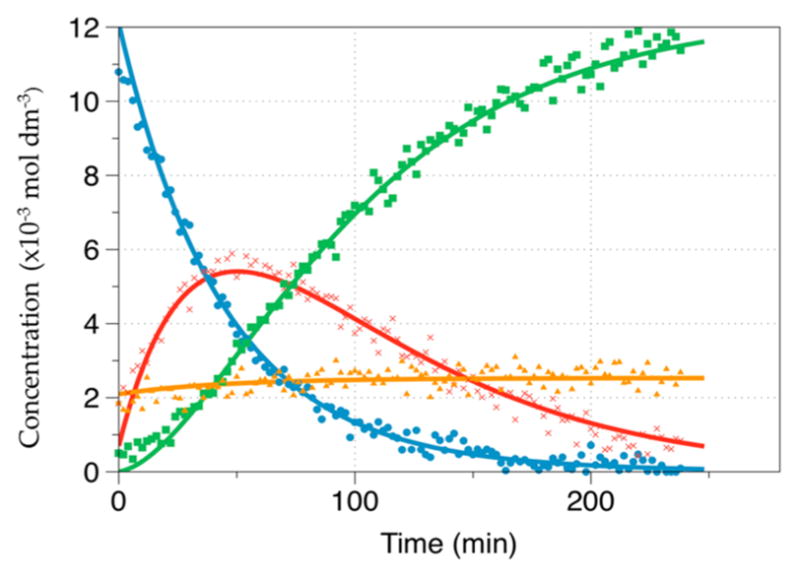
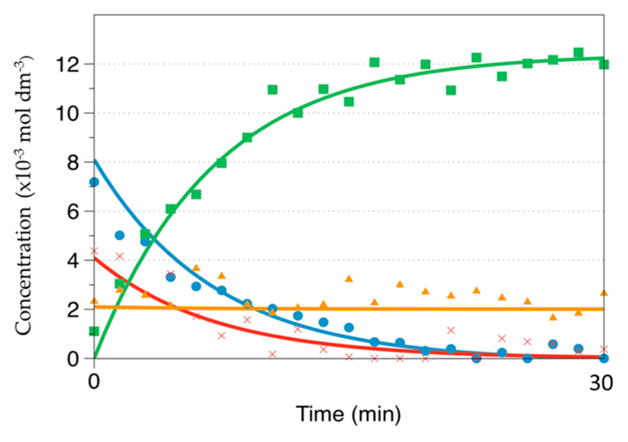
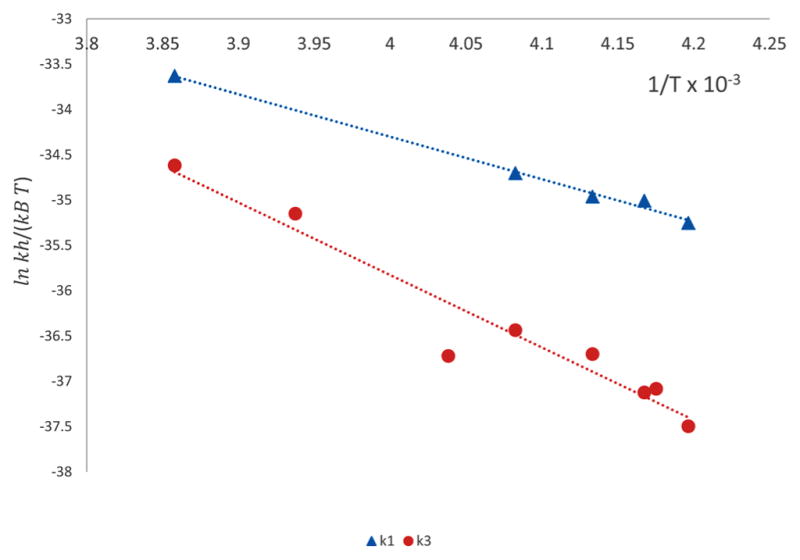
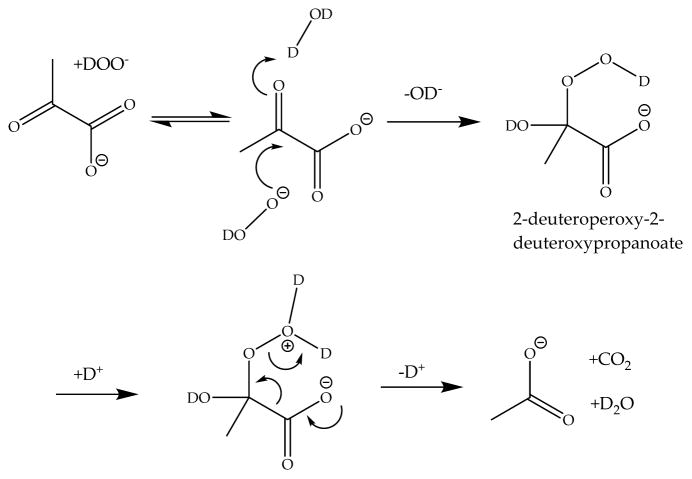
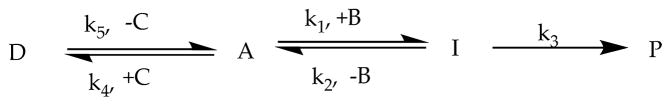
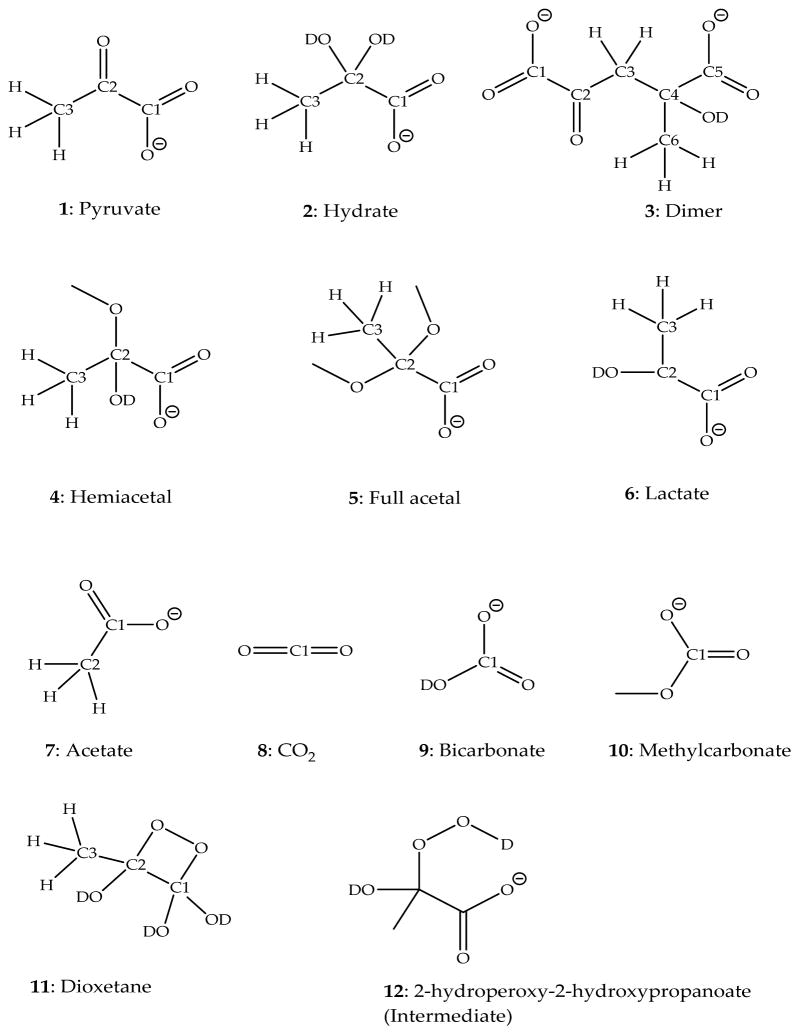
It was proposed that the reaction of sodium pyruvate and H2O2 generates the intermediate 2-hydroperoxy-2-hydroxypropanoate, which converts into acetate, CO2, and H2O ( Aleksankin et al. Kernenergie 1962 , 5 , 362 - 365 ). These conclusions were based on the products generated in (18)O-enriched water and H2O2 reacting with pyruvic acid at room temperature; however, the lifetime of 2-hydroperoxy-2-hydroxypropanoate at room temperature is too short for direct spectroscopic observation. Therefore, we applied the combination of low-temperature and (13)C NMR techniques to verify, for the first time, the formation of 2-deuteroperoxy-2-deuteroxypropanoate in mixtures of D2O and methanol-d4 and to monitor directly each species involved in the reaction between D2O2 and (13)C-enriched pyruvate. Our NMR results confirm the formation of 2-deuteroperoxy-2-deuteroxypropanoate, where the respective chemical shifts are supported by density functional theory (DFT) calculations. At near-neutral apparent pD (pD*) and -35 °C, the formation of 2-deuteroperoxy-2-deuteroxypropanoate occurred with k = 2.43 × 10(-3) dm(3)·mol(-1)·s(-1). The subsequent decomposition of 2-deuteroperoxy-2-deuteroxypropanoate into acetate, CO2, and D2O occurred with k = 2.58 × 10(-4) s(-1) at -35 °C. In order to provide a full kinetic analysis, we also monitored the equilibrium of pyruvate and methanol with the hemiacetal (2-deuteroxy-2-methoxypropanoate). The kinetics for the reaction of sodium pyruvate and D2O2 were fitted by taking into account all these equilibria and species.
Conflict of interest statement
The authors declare no competing financial interest.
Figures
References
-
- Halliwell B. Reactive Oxygen Species and the Central Nervous System. J Neurochem. 1992;59:1609–1623. - PubMed
-
- Chance B, Sies H, Boveris A. Hydroperoxide Metabolism in Mammalian Organs. Physiol Rev. 1979;59:527–605. - PubMed
-
- Andrae U, Singh J, Ziegler-Skylakakis K. Pyruvate and Related Alpha-Ketoacids Protect Mammalian Cells in Culture against Hydrogen Peroxide-Induced Cytotoxicity. Toxicol Lett. 1985;28:93–98. - PubMed
-
- Giandomenico AR, Cerniglia GE, Biaglow JE, Stevens CW, Koch CJ. The Importance of Sodium Pyruvate in Assessing Damage Produced by Hydrogen Peroxide. Free Radical Biol Med. 1997;23:426–434. - PubMed
Publication types
MeSH terms
Substances
Grants and funding
LinkOut - more resources
Full Text Sources
Other Literature Sources
