. 2015 Mar 1;128(5):878-87.
doi: 10.1242/jcs.154476. Epub 2015 Jan 14.

S1PR1 Tyr143 phosphorylation downregulates endothelial cell surface S1PR1 expression and responsiveness

Affiliations

S1PR1 Tyr143 phosphorylation downregulates endothelial cell surface S1PR1 expression and responsiveness

Alejandra Chavez et al. J Cell Sci. .

Abstract

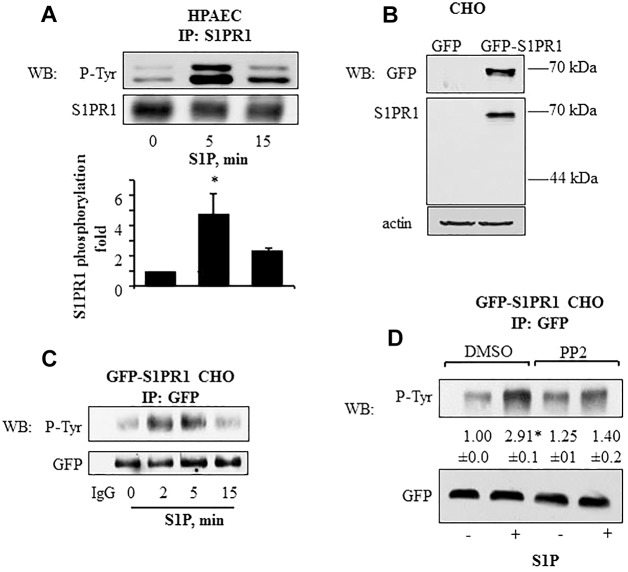
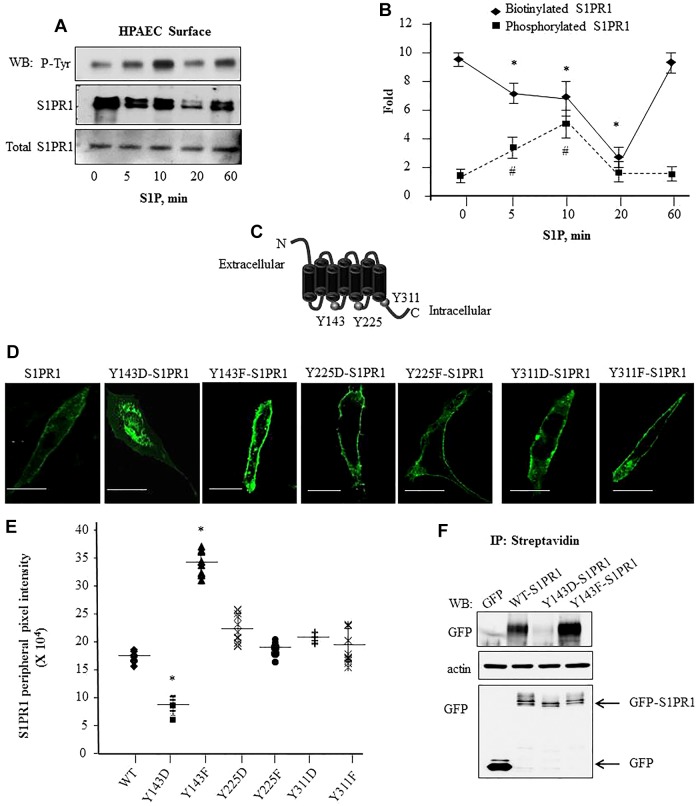
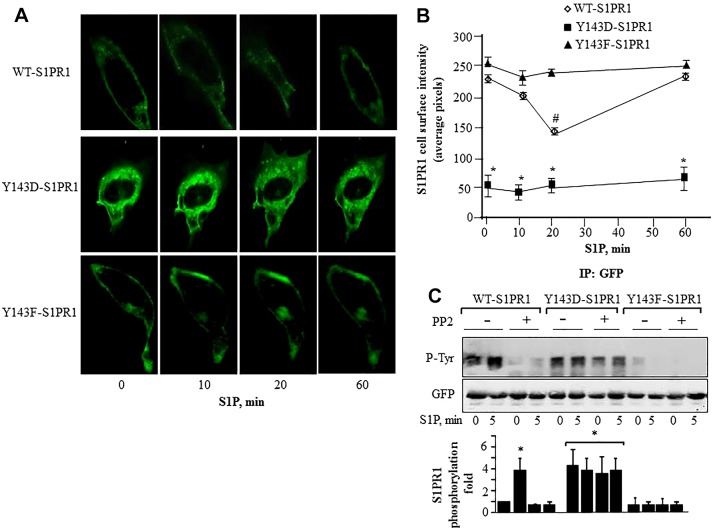
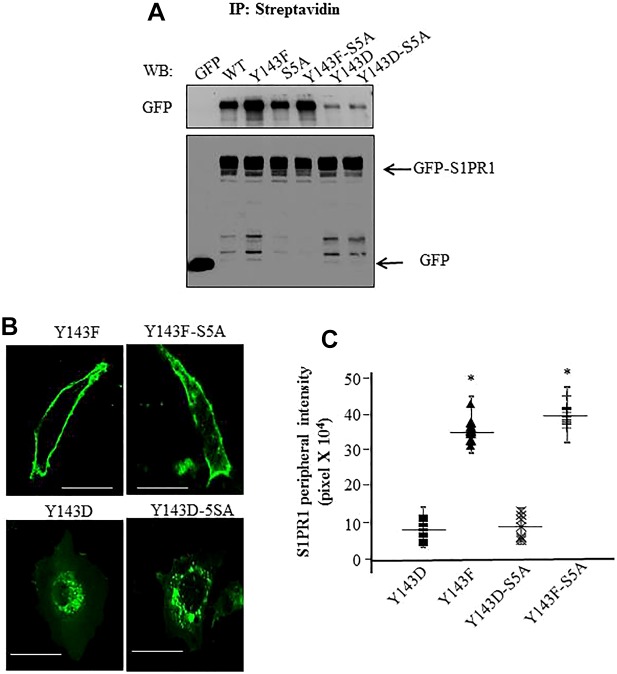
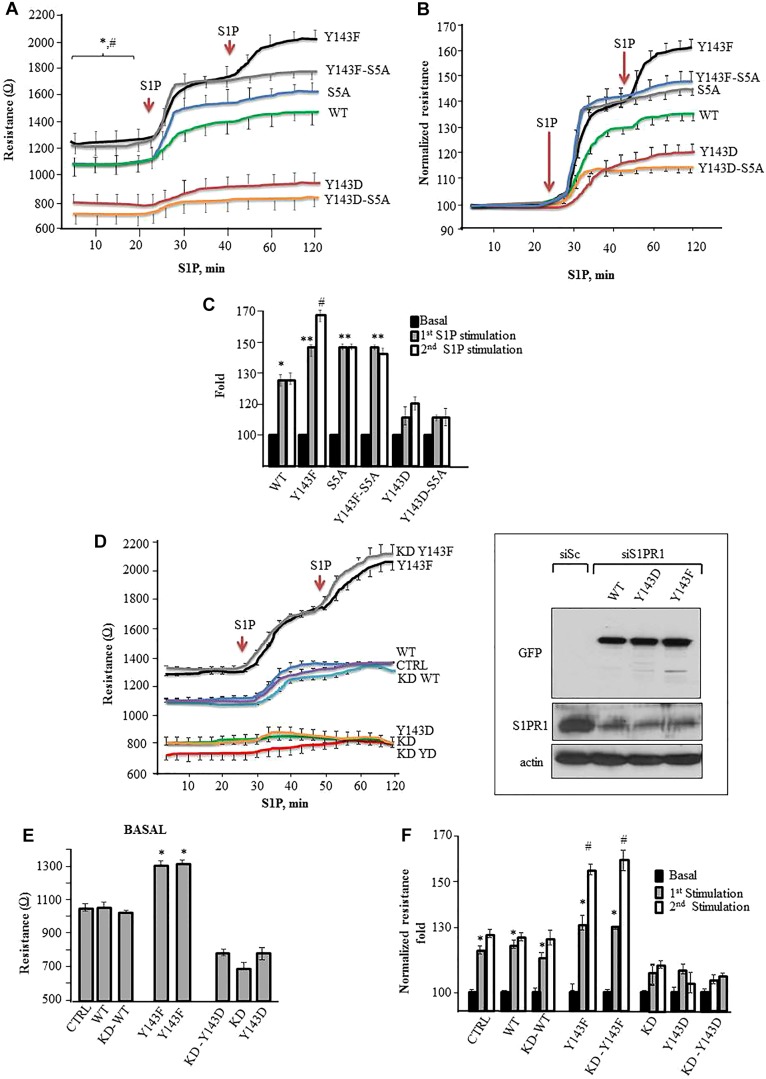
Activation of sphingosine-1-phosphate receptor 1 (S1PR1) plays a key role in repairing endothelial barrier function. We addressed the role of phosphorylation of the three intracellular tyrosine residues of S1PR1 in endothelial cells in regulating the receptor responsiveness and endothelial barrier function regulated by sphingosine 1-phosphate (S1P)-mediated activation of S1PR1. We demonstrated that phosphorylation of only Y143 site was required for S1PR1 internalization in response to S1P. Maximal S1PR1 internalization was seen in 20 min but S1PR1 returned to the cell surface within 1 h accompanied by Y143-dephosphorylation. Cell surface S1PR1 loss paralleled defective endothelial barrier enhancement induced by S1P. Expression of phospho-defective (Y143F) or phospho-mimicking (Y143D) mutants, respectively, failed to internalize or showed unusually high receptor internalization, consistent with the requirement of Y143 in regulating cell surface S1PR1 expression. Phosphorylation of the five S1PR1 C-terminal serine residues did not affect the role of Y143 phosphorylation in signaling S1PR1 internalization. Thus, rapid reduction of endothelial cell surface expression of S1PR1 subsequent to Y143 phosphorylation is a crucial mechanism of modulating S1PR1 signaling, and hence the endothelial barrier repair function of S1P.

Keywords: Adherens junctions; Endothelial barrier function; Endothelium; Serine phosphorylation; Sphingosine-1-phosphate receptor-1; Tyrosine phosphorylation.


Figures

Fig. 1.
Fig. 1.
Tyrosine phosphorylation kinetics of S1PR1 in endothelial and CHO cells. (A) S1P induces S1PR1 tyrosine phosphorylation in HPAECs. HPAECs were serum starved for 1 h after which they were stimulated with 1 µM S1P for the indicated times. Cell lysates were immunoprecipitated (IP) with anti-S1PR1 antibody and immunoblotted (WB) with anti-phosphotyrosine (P-Tyr) or anti-S1PR1 antibodies. The bar graph shows mean±s.d. (n = 4) of the fold increase in S1PR1 tyrosine phosphorylation. *P<0.05 compared with unstimulated cells. (B,C) S1P induces tyrosine phosphorylation of GFP–S1PR1 in CHO cells. (B) CHO cells were stably transfected with GFP–S1PR1 as indicated in the Materials and Methods. Untransfected CHO cells served as control. Cell lysates were immunoblotted with anti-GFP and anti-S1PR1 to confirm expression. Immunoblotting with anti-β-actin antibody was used as a loading control. (C) CHO cells stably expressing GFP–S1PR1 were serum starved for 1 h and challenged with 1 µM S1P for indicated times. Lysates were immunoprecipitated with anti-GFP antibody, and immunoblotted for phosphotyrosine or GFP (loading control). immunoprecipitation with rabbit IgG served as negative control. Representative immunoblots from three independent experiments are shown. (D) GFP–S1PR1-expressing CHO cells were serum starved for 30 min followed by exposure to 5 µM PP2 for 45 min in serum-free medium. Cells were challenged with 1 µM S1P for 5 min and lysates were immunoprecipitated with anti-GFP antibody, and immunoblotted for phosphotyrosine or GFP (loading control) to determine phosphorylation. A representative immunoblot is shown. Numbers indicate the densitometric analysis of the fold change (±s.d.) in phosphorylation over that at 0 min in control cells from three individual experiments. *P<0.05 compared with unstimulated cells.
Fig. 2.
Fig. 2.
Phosphorylation of S1PR1 at Y143 is associated with reduced cell surface S1PR1 localization. (A,B) S1P-induced tyrosine phosphorylation is coupled to reduced cell surface retention of S1PR1. HPAECs were serum starved and stimulated with 1 µM S1P for the indicated times. Cell surface proteins were biotinylated followed by immunoprecipitation (IP) with anti-S1PR1 antibody; biotin-bound S1PR1 was isolated using streptavidin–agarose beads as indicated in the Materials and Methods. Protein lysates were separated by SDS-PAGE and immunoblotted (WB) with anti-phosphotyrosine (P-Tyr) or anti-S1PR1 antibodies. Total cell lysates were assessed for S1PR1 to confirm equal protein loading. A shows a representative immunoblot blot and B shows the mean±s.d. fold change in phosphorylation or biotinylated S1PR1 versus total S1PR1 expression at each time. Fold increase was calculated taking values at ‘0’ time as 1. from multiple experiments. *P<0.05 for a reduction compared to at 0 min; #P<0.05 for an increase in compared to at 0 min. (C) Schematic showing potential tyrosine residues in S1PR1 that can be phosphorylated. (D,E) Phosphorylation at Y143 reduces GFP–S1PR1 cell surface localization. (D) CHO cells were transfected with the indicated mutants and after 24 h cells were visualized using confocal microscopy. Scale bars: 10 µm. (E) The mean pixel intensity (line) at the cell periphery from various cells was quantified as described in the Materials and Methods. Plot shows pixel intensity at the cell periphery in cells expressing the mutants from three independent experiments. In each experiment at least ten cells were counted. *P<0.05 compared with cells expressing WT-S1PR1. (F) Cell surface proteins in CHO cells transiently transfected with indicated GFP-tagged constructs were biotinylated as described in the Materials and Methods. Biotinylated proteins were immunoprecipitated with anti-GFP antibody to detect receptor cell surface expression. Lysates were immunoblotted with anti-GFP antibody to assess S1PR1 expression. Immunoblotting with anti-β-actin antibody was performed to assess equal protein loading control. A representative blot from three experiments performed independently is shown.
Fig. 3.
Fig. 3.
Relationship between S1PR1 phosphorylation at Tyr143 and cell surface S1PR1 localization. (A) CHO cells transfected with GFP-tagged WT-S1PR1, Y143D-S1PR1 or Y143F-S1PR1 for 24 h were stimulated with 1 µM S1P and images were acquired at the indicated time points. Pixel intensity was quantified at the cell membrane using linescan in MetaMorph software. (B) Numerical values indicate mean±s.d. of pixel intensity at the cell periphery from multiple cells in each experiments which were conducted more than three times (n = 3–4). *P<0.05 for a reduction compared with cells expressing GFP–WT-S1PR1 or GFP–Y143F-S1PR1; #P<0.05 for a reduction compared with cells expressing GFP–Y143F-S1PR1. (C) CHO cells expressing the indicated mutants were serum starved for 30 min followed by exposure to 5 µM PP2 for 45 min in serum-free medium. Cells were challenged with 1 µM S1P for 5 min and lysates were immunoprecipitated with anti-GFP antibody followed by immunoblotting with anti-phosphotyrosine or anti-GFP antibodies to determine phosphorylation. Top, a representative immunoblot is shown. Bottom, bar graph of densitometric analysis of fold change in phosphorylation over that at 0 min in control cells from three individual experiments. *P<0.05.
Fig. 4.
Fig. 4.
Y143-phosphorylation-dependent regulation of S1PR1 localization functions independently of serine phosphorylation of S1PR1. (A) CHO cells transiently transfected with the indicated GFP-tagged constructs were biotinylated. Cell surface proteins were immunoprecipitated (IP) with anti-streptavidin antibody followed by immunoblotting (WB) with anti-GFP antibody to detect receptor cell surface expression. Cell lysates were immunoblotted with anti-GFP antibody to assess total S1PR1 expression. A representative blot from three experiments performed independently is shown. (B,C) CHO cells were transfected with the indicated mutants and after 24 h cells were visualized using confocal microscopy. Average pixel intensity at the cell periphery from various cells was quantified as described in Methods. Scale bars: 10 µm. C shows a plot of mean±s.d. of pixel intensity at the cell periphery in cells expressing the mutants from three independent experiments. In each experiment at least ten cells were counted. *P<0.05 compared with cells expressing WT-S1PR1.
Fig. 5.
Fig. 5.
S1PR1 phosphorylation at Y143 inhibits S1P-mediated enhancement of endothelial barrier annealing. (A) HPAECs seeded on gold-plated electrodes were transfected with the indicated mutants for 24 h. Cells were serum starved for 2 h after which endothelial barrier function was determined by measuring transendothelial electrical resistance (TEER) in real time in naive monolayers and following addition of 1 µM S1P. (B,C) TEER values obtained in Fig. 5A were normalized against basal values in each setting and re-plotted. *P<0.05 compared with basal; **P<0.05 compared with WT; #P<0.05 compared with initial S1P stimulation. (D–F) HPAE cells were transfected with control (CTRL, siSc) or S1PR1 siRNA (KD, siS1PR1). After 48 h, cells were transduced with indicated S1PR1 mutants and changes in TEER was assessed under basal conditions (E) and after S1P exposure (F). The inset in D is an immunoblot showing re-expression of indicated S1PR1 mutants following knockdown of S1PR1. Lysates from endothelial cells transfected with indicated mutants and S1PR1 siRNA were immunoblotted with anti-S1PR1, anti-GFP or anti-actin antibody to assess S1PR1 depletion and the re-expression of the mutants. Immunoblotting with anti-actin antibody was used as a loading control. In F, TEER values were normalized against basal values in each setting and re-plotted as fold increase over basal following S1P exposure. *P<0.05 compared with control, **P<0.05 compared with WT; #P<0.05 compared with initial S1P stimulation. Results are mean±s.d.

References

    1. Argraves K. M., Wilkerson B. A., Argraves W. S. (2010). Sphingosine-1-phosphate signaling in vasculogenesis and angiogenesis. World J. Biol. Chem 1, 291–297 10.4331/wjbc.v1.i10.291 - DOI - PMC - PubMed
    1. Belvitch P., Dudek S. M. (2012). Role of FAK in S1P-regulated endothelial permeability. Microvasc. Res. 83, 22–30 10.1016/j.mvr.2011.08.012 - DOI - PMC - PubMed
    1. Bergelin N., Löf C., Balthasar S., Kalhori V., Törnquist K. (2010). S1P1 and VEGFR-2 form a signaling complex with extracellularly regulated kinase 1/2 and protein kinase C-alpha regulating ML-1 thyroid carcinoma cell migration. Endocrinology 151, 2994–3005. - PubMed
    1. Chen R. H., Derynck R. (1994). Homomeric interactions between type II transforming growth factor-beta receptors. J. Biol. Chem. 269, 22868–22874. - PubMed
    1. Ferguson S. S., Downey W. E., 3rd, Colapietro A. M., Barak L. S., Ménard L., Caron M. G. (1996). Role of beta-arrestin in mediating agonist-promoted G protein-coupled receptor internalization. Science 271, 363–366 10.1126/science.271.5247.363 - DOI - PubMed

Publication types

MeSH terms