. 2015 Feb 15;194(4):1446-53.
doi: 10.4049/jimmunol.1402472. Epub 2015 Jan 14.

Macronutrient deprivation modulates antigen trafficking and immune recognition through HSC70 accessibility

Affiliations

Macronutrient deprivation modulates antigen trafficking and immune recognition through HSC70 accessibility

Sarah N Deffit et al. J Immunol. .

Abstract

B lymphocytes exploit macroautophagy to capture cytoplasmic and nuclear proteins within autophagosomes. Fusion of autophagosomes with lysosomes and endosomes facilitates content proteolysis, with the resulting peptides selectively binding MHC class II (MHC II) molecules, which are displayed for recognition by T lymphocytes. Nutrient deprivation or stress amplified this pathway, favoring increased MHC II presentation of cytoplasmic Ags targeted to autophagosomes. By contrast, this stress diminished MHC II presentation of membrane Ags including the BCR and cytoplasmic proteins that use the chaperone-mediated autophagy pathway. Whereas intracellular protease activity increased with nutrient stress, endocytic trafficking and proteolytic turnover of the BCR was impaired. Addition of macronutrients such as high molecular mass proteins restored endocytosis and Ag presentation, evidence of tightly regulated membrane trafficking dependent on macronutrient status. Altering cellular levels of the cytosolic chaperone HSC70 was sufficient to overcome the inhibitory effects of nutritional stress on BCR trafficking and Ag presentation. Together, these results reveal a key role for macronutrient sensing in regulating immune recognition and the importance of HSC70 in modulating membrane trafficking pathways during cellular stress.


Figures

Figure 1
Figure 1. Macronutrient deprivation alters endogenous Ag presentation and degradation
(A) B cells were grown + serum (Cont.) or − serum and MHCII presentation of MP1 epitopes was monitored. (B) To measure MA flux, B cells were grown +/− serum and treated with CQ to stabilize and detect endogenous LC3II accumulation in autophagosomes. MA flux in Cont. cells was normalized and set to 1 (dotted line). (C) B cells were grown +/− serum and MHCII presentation of endogenous BCR epitopes detected using epitope-specific T cells. (D) B cells were cultured +/− serum for 12 h, fixed and incubated for 6 h with 10 uM BCR peptide prior to incubation with T cells and detection of Il-2. (E) B cells were grown for 12 h +/− serum and changes in the expression of surface HLA-DR (MHCII) and intracellular HLA-DM detected by flow cytometry. HLA-DM function was assessed by monitoring MHCII:CLIP surface levels. Protein levels in Cont. cells were set to 1 (dotted line) and the relative expression of DR, CLIP or DM during serum deprivation indicated. (F) B cells were grown +/− serum for 12 h and lysed for immunoblot analysis of MHCII, invariant chain, and GAPDH. (A and C) One-way ANOVA, multiple comparison. (B) Student’s T-Test, multiple comparison to Cont. cells.
Figure 2
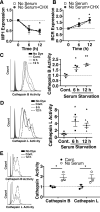
Figure 2. Macronutrient deprivation inhibits BCR turnover while activating endosomal/lysosomal proteases
(A and B) B cells were grown + serum (Cont.) or − serum and +/− cycloheximide (CHX). MP1 and BCR protein expression were determined relative to cellular GAPDH. Protein expression in Cont. cells was normalized and set to 1 (dotted line). (C and D) Real-time analysis of cathepsin B and L activity in B cells cultured as Cont. or without serum for 6 or 12 h. Fluorescence profile for no substrate treated cells is shown (gray shaded). (E) Real-time assessment of cathepsin B and L activity in human peripheral blood B cells treated as Cont. or without serum for 12 h. (A and B) Student’s T-Test, multiple comparison to Cont. cells. (C and D) One-way ANOVA, multiple comparison. (E) Two-way ANOVA, multiple comparison.
Figure 3
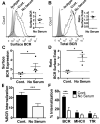
Figure 3. Macronutrient deprivation alters BCR trafficking
Flow cytometric analysis of B cells cultured + serum (Cont.) or − serum for 12 h prior to detection of surface or total BCR levels. (A) Surface BCR levels (insert: relative surface levels of BCR for B cells cultured without serum vs. Cont. cells indicated by the dotted line). (B) Total BCR levels (insert: relative ratio of surface:total BCR for cells treated with no serum vs. Cont. cells indicated by the dotted line). Fluorescence profile for cells stained with an isotype matched control Ab is shown as gray shaded area. (C and D) Peripheral blood B cells were treated +/− serum for 12 h and stained for BCR surface levels (C) and the relative ratio of surface:total BCR (D). For panels A-D flow cytometric data for Cont. cells was set equal to 1. (E) BCR endocytosis was monitored in B cells cultured +/− serum. (F) Specific endocytosis of the BCR, MHCII or transferrin receptor (TfR) was monitored in peripheral blood B cells incubated +/− serum. (A-F) Student’s T-Test.
Figure 4
Figure 4. Exogenous macromolecules restore BCR trafficking and MHCII Ag presentation
(A) BCR surface expression was determined in B cells treated for 12 h + serum (Cont.), − serum, or in serum-free media supplemented with different fractions of serum (>30kDa, <30kDa, or <10kDa). Cont. cell BCR surface expression was normalized and set to 1 (dotted line). (B) BCR surface expression was determined in B cells treated for 12 h +/− serum, or in serum-free media supplemented with BSA or 70 kDa dextran. Cont. cell BCR surface expression was normalized and set to 1 (dotted line). (C) BCR surface levels were determined in B cells cultured +/− serum or in serum-free media supplemented with various sized proteins: 14 kDa HEL, 45 kDa OVA, or 68 kDa BSA for 12 h. (D) BCR endocytosis was monitored in B cells cultured +/− serum or in serum-free media supplemented with BSA. (E) B cells were cultured +/− serum, or in serum-free media supplemented with BSA for 12 h, harvested and fixed for flow cytometric analysis of MHCII surface expression. MHCII presentation of (F) BCR epitopes, (G) MHC class I (MHCI) epitopes, and (H) MP1 epitopes was monitored in B cells treated +/− serum or in serum-free media supplemented with BSA for 12 h. (A-C) Student’s T-Test, multiple comparison * Denotes p value as compared to Cont. cells (dotted line). # denotes a One-way ANOVA, multiple comparison. (D-H) One-way ANOVA, multiple comparison.
Figure 5
Figure 5. Macronutrient deprivation alters trafficking and MHCII presentation of the endogenous GAD Ag
(A and B) B cells were grown + serum (Cont.) or − serum and MHCII presentation of endogenous GAD epitopes (A) or exogenous GAD peptide (B) was monitored. (C) B cells were grown +/− serum and +/− cycloheximide (CHX). Cellular GAD protein expression was determined relative to GAPDH. Protein expression in Cont. cells was normalized and set to 1 (dotted line). (D) Proteasome activity was monitored in B lymphoblasts grown +/− serum for 6 or 12 h using a luminescent substrate. (E and F) B cells were grown +/− serum or in media supplemented with BSA for 12 h, harvested, and lysed into cytoplasmic and membrane fractions. Lysates were resolved by SDS-PAGE and immunobloted for GAD and as a loading control GAPDH (cytoplasmic) or MHCII (membrane). (G) B cells were cultured +/− serum for up to 12 h and the mRNA levels of the LAMP2 isoforms or (H) cellular LAMP2 protein expression was assessed. (A, D-F and H) One-way ANOVA, multiple comparisons. (C) Student’s T-Test, multiple comparison to Cont. cells.
Figure 6
Figure 6. Macronutrient deprivation alters HSC70 association with endogenous Ags
(A) B cells were cultured + serum (Cont.), − serum, or in serum-free media supplemented with BSA, harvested and lysed. Lysates were incubated with GAD Ab or an isotyped-matched Ab overnight and protein G-Sephorose beads the next day. Immunoprecipitated proteins were resolved using SDS-PAGE, immunoblotted for HSC70 and GAD, and (B) densitometry was used to quantitate relative amounts of HSC70 bound to GAD. (C) B cells were grown +/− serum or in serum-free media supplemented with BSA for 12 h and lysed for immunoblot analysis of HSC70 and GAPDH. (D) Densitometry was used to quantitate relative ratios of HSC70 to GAPDH. Student’s T-Test, multiple comparisons.
Figure 7
Figure 7. Ectopic expression of HSC70 averts disruptions in Ag trafficking during macronutrient deprivation
(A) The PriessGAD (PG) B lymphobasts were transfected to ectopically express HSC70 (PG70). PG and PG70 cells were lysed for immunoblot analysis of HSC70 and GAPDH expression. Densitometry was used to quantitate relative ratio of HSC70 to GAPDH expression in these cells. (B) PG70 cells were cultured + serum (Cont.) or − serum for 12 h. Lysates from these cells were incubated with a GAD-specific Ab or an isotyped-matched Ab overnight to immunoprecipitate GAD. Immunoprecipitated proteins were resolved using SDS-PAGE, immunoblotted for HSC70 and GAD, and densitometry was used to quantitate relative amounts of HSC70 bound to GAD. (C) PG and PG70 cells were grown +/− serum and tested for MHCII presentation of endogenous GAD epitopes, (D) endogenous BCR epitopes, or (E) MP1 epitopes. (F) Flow cytometry of PG and PG70 cells cultured +/− serum for 12 h prior to detection of BCR surface levels. (G and H) PG70 cells were grown +/− serum or in media supplemented with BSA for 12 h. These cells were lysed and cytoplasmic and membrane fractions isolated. Fractions were resolved by SDS-PAGE and immunobloted for GAD and as a loading control GAPDH (cytoplasmic) or MHCII (membrane). Densitometry was used to quantitate GAD levels relative to the loading control protein. (A) Student’s T-test. (C-H) Student’s T-Test, multiple comparisons correction.

Similar articles

Cited by

References

    1. Hansen MA, Fernandes G, Good RA. Nutrition and immunity: the influence of diet on autoimmunity and the role of zinc in the immune response. Annual review of nutrition. 1982;2:151–177. - PubMed
    1. Scrimshaw NS, Taylor CE, Gordon JE. Interactions of nutrition and infection. Monograph series. World Health Organization. 1968;57:3–329. - PubMed
    1. Taiwo OO, Thomas KD. Plasma biochemical parameters in Nigerian children with protein energy malnutrition. East African medical journal. 1992 Aug;69:428–432. - PubMed
    1. Cripps AW, Otczyk DC, Barker J, Lehmann D, Alpers MP. The relationship between undernutrition and humoral immune status in children with pneumonia in Papua New Guinea. Papua and New Guinea medical journal. 2008 Sep-Dec;51:120–130. - PubMed
    1. Najera O, Gonzalez C, Toledo G, Lopez L, Ortiz R. Flow cytometry study of lymphocyte subsets in malnourished and well-nourished children with bacterial infections. Clinical and diagnostic laboratory immunology. 2004 May;11:577–580. - PMC - PubMed

Publication types

Substances