. 2014 Dec 11:2:168.
doi: 10.1186/s40478-014-0168-9.

Transcript profiling of different types of multiple sclerosis lesions yields FGF1 as a promoter of remyelination

Affiliations

Transcript profiling of different types of multiple sclerosis lesions yields FGF1 as a promoter of remyelination

Hema Mohan et al. Acta Neuropathol Commun. .

Abstract

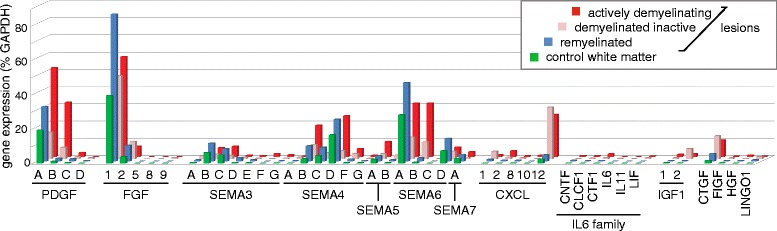
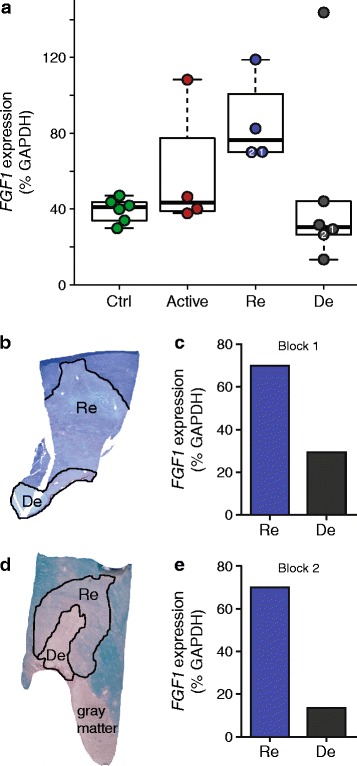
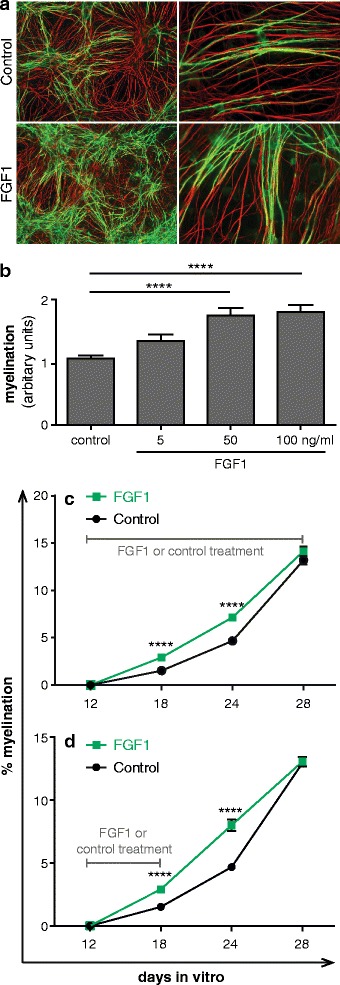
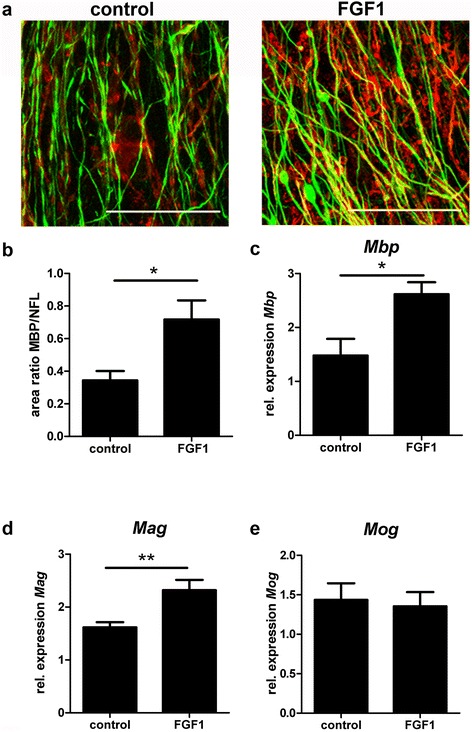
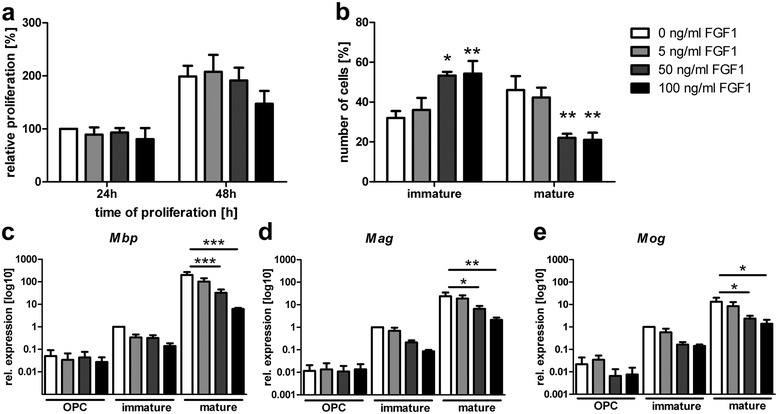
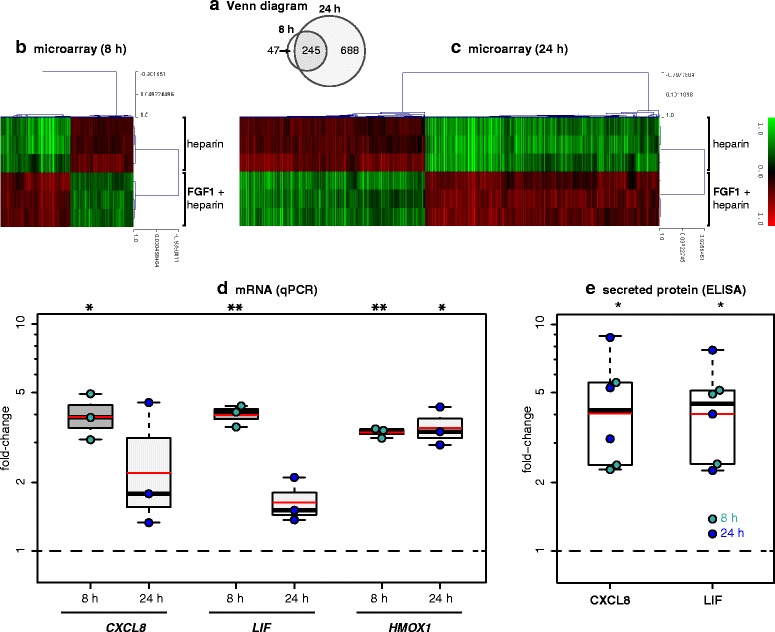
Chronic demyelination is a pathological hallmark of multiple sclerosis (MS). Only a minority of MS lesions remyelinates completely. Enhancing remyelination is, therefore, a major aim of future MS therapies. Here we took a novel approach to identify factors that may inhibit or support endogenous remyelination in MS. We dissected remyelinated, demyelinated active, and demyelinated inactive white matter MS lesions, and compared transcript levels of myelination and inflammation-related genes using quantitative PCR on customized TaqMan Low Density Arrays. In remyelinated lesions, fibroblast growth factor (FGF) 1 was the most abundant of all analyzed myelination-regulating factors, showed a trend towards higher expression as compared to demyelinated lesions and was significantly higher than in control white matter. Two MS tissue blocks comprised lesions with adjacent de- and remyelinated areas and FGF1 expression was higher in the remyelinated rim compared to the demyelinated lesion core. In functional experiments, FGF1 accelerated developmental myelination in dissociated mixed cultures and promoted remyelination in slice cultures, whereas it decelerated differentiation of purified primary oligodendrocytes, suggesting that promotion of remyelination by FGF1 is based on an indirect mechanism. The analysis of human astrocyte responses to FGF1 by genome wide expression profiling showed that FGF1 induced the expression of the chemokine CXCL8 and leukemia inhibitory factor, two factors implicated in recruitment of oligodendrocytes and promotion of remyelination. Together, this study presents a transcript profiling of remyelinated MS lesions and identified FGF1 as a promoter of remyelination. Modulation of FGF family members might improve myelin repair in MS.


Figures

Figure 1
Figure 1
Oligodendrocyte regulators are differentially expressed in various lesion types. MS lesions were dissected from frozen tissue and the expression level of the indicated mediators regulating oligodendrocytes were determined by qPCR. The absolute expression levels are given in terms of % GAPDH. Displayed is the mean of 6 normal white matter specimens, 6 demyelinated inactive, 4 demyelinated active, and 4 remyelinated lesion areas.
Figure 2
Figure 2
FGF1 expression is elevated in remyelinated lesions. (a) FGF1 gene expression was analyzed by quantitative PCR TLDA relative to GAPDH in individual lesion areas (Re: remyelinated, De: demyelinated inactive, Active: actively demyelinating areas) and control white matter specimens (Ctrl.). Each symbol represents a single dissected area. Medians (bars) and 1st/3rd quartiles (boxes) are shown. Whiskers extend to the range up to 1.5 times of the interquartile range; values beyond were regarded as outliers. We noted one outlier in the six analyzed demyelinated inactive lesions, but we cannot explain why this one lesion had a higher FGF1 level than all others. Regarding the primary topic of remyelination in this study, we compared the remyelinated lesions with the other groups of tissue specimens; Mann–Whitney U test showed a significant difference between the remyelinated areas and controls (p < 0.01), while the differences between remyelinated vs. demyelinated inactive areas (p = 0.1) and remyelinated vs. actively demyelinating areas (p = 0.2) did not reach statistical significance. (b-d) In two blocks, adjacent de- and remyelinated areas were present within the same lesion and excised for quantitative PCR TLDA analysis (labelled as Block 1 and 2 for Figure 2a-e). FGF1 expression normalized to GAPDH is shown. Fold-changes of FGF1 expression between the re- and demyelinated areas in each block were calculated for the different housekeeping genes. The geometric mean of these fold-changes obtained by normalization to the three housekeeping genes was 2.1× for block 1 and 4.1× for block 2.
Figure 3
Figure 3
FGF1 is expressed in re- and demyelinated lesions as well as in neurons and oligodendroglia in control brain and NAWM. (a) LFB staining of an MS tissue specimen with demyelinated (De), remyelinated (Re) lesion areas along with normal appearing white mater (NAWM) and gray matter (GM). The FGF staining was more prominent in the remyelinated area (b) compared to the chronic inactive demyelinated area (c). In control brain, FGF1 staining was detected in neurons of gray matter (d) and cells appearing as oligodendrocytes in white matter (e, f). Scale bars: 20 μm.
Figure 4
Figure 4
FGF1 is displayed by astrocytes, microglia/macrophages and lymphocytes. Double immunofluorescence staining of FGF1 with GFAP (a, b), Iba-1 (c), CD3 (d), and CD20 (e). Pictures were taken from different areas, namely a chronic inactive demyelinated lesion (a), NAWM (b), chronic active lesion (c), and perivascular cuffs in an active lesion (d, e). Scale bars: a and b 12.5 μm; (c, d) and (e) 25 μm.
Figure 5
Figure 5
FGF1 promotes myelination in dissociated spinal cord cultures. Myelinating cultures were treated with different concentrations of FGF1 from 22 DIV to 26 DIV and then stained for myelin (MBP in green) and axons (SMI-31 in red). (a) FGF1 treated cultures showed enhanced levels of MBP+ myelin sheath as compared to the control cultures. Magnification: left panel = 10X, right panel = 40X. (b) Quantitative evaluation: FG1 promotes myelination ****P <0.0001. Error bars represent SEM of two experiments. Myelinating cultures were treated with 100 ng/ml FGF1 for different time periods. Axonal density calculated as pixel for NFL (different FGF1 dosages/control) were 1.17 for 5 ng/ml FGF1, 1.2 for 50 ng/ml FGF1 and 1.06 for 50 ng/ml FGF1. (c) 16 days (12 DIV to 28 DIV) and (d) 6 days (12 DIV to 18 DIV). The myelination was enhanced at day 18 and 24, but unaltered at day 28. ****P <0.0001. Significance of data values was analyzed using T-test. Error bars represent SEM from three independent experiments. The axonal densities (FGF1/control) ranged between 0.98 and 1.02 in the experiments shown in (c) and (d).
Figure 6
Figure 6
FGF1 enhances remyelination in organotypic cerebellar slice cultures. After toxic demyelination, cerebellar slice cultures were allowed to remyelinate for 14 days in the absence or presence of 100 ng/ml FGF1. Myelination was assessed by immunostaining (a, b) and quantitative PCR (c–e). (a) Mpb (red), NFL (green) scale bar = 50 μm (b) Quantification of Mpb +/NFL+ area ratio in FGF1 treated slices compared to untreated controls. Mpb + myelin formation is promoted by FGF1. Students t-test *P = 0.0341. (c-e) After 14 days RNA was extracted, cDNA obtained and transcript levels of (c) Mpb, (d) Mag and (e) Mog were measured by qPCR. One-way ANOVA **P < 0.01; *P < 0.05; All error bars represent SEM from three independent experiments.
Figure 7
Figure 7
FGF1 decelerates differentiation of monocultured oligodendrocytes. (a) FGF1 does not affect proliferation of primary murine OPCs but (b) decelerates the differentiation into myelinating oligodendrocytes as determined by morphology; Two-way ANOVA with Bonferroni post correction **p < 0.01; *p < 0.05. The expression of myelin-associated genes was assessed by qPCR on samples from OPCs (6 h), immature (24 h) and mature cells (48 h). The expression levels of (c) Mbp, (d) Mag and in (e) Mog are reduced due to increasing FGF1 concentrations; one-way ANOVA with Bonferroni post correction *** p < 0.001 **P < 0.01; *P = <0.05; error bars represent SEM from three independent experiments.
Figure 8
Figure 8
FGF1-induced gene expression in human primary astrocytes. (a-c) Gene expression was analysed after 8 h (a,b) and 24 h (a,c) with and without FGF1 (10 ng/ml). In all experiments, FGF1 was applied together with heparin (5 U/ml); control cultures contained heparin only. Only differentially expressed probes (corrected p-value <0.05, fold-change > 1.4-fold up or down, and normalized mean expression intensity ≥ 100 in any one of the two groups) are shown. The number of differentially expressed probes is shown in (a). CXCL8 and LIF were among the genes upregulated at both time points (see also Additional file 5: Table S3). (d) For validation, the gene expression of CXCL8, LIF, and the positive control HMOX1 were analysed by qPCR after 8 h and 24 h with FGF1 (10 ng/ml). (e) Secreted CXCL8 and LIF protein were measured by ELISA in the supernatant after 8 and 24 h with and without 10 ng/ml FGF1. In (d,e), the fold-change compared to unstimulated control cultures is displayed. Black bars and boxes indicate medians and 1st/3rd quartiles, respectively. Whiskers extend to the most extreme samples up to 1.5× of the IQR. Red bars indicate means. Fold-changes were analysed by two-sided one-sample tests against the control samples (μ = 1; t-test for FGF1 mRNA, U test for FGF1 protein because of non-normal distribution). *: p < 0.05, **: p < 0.01.

References

    1. Tripathi RB, Rivers LE, Young KM, Jamen F, Richardson WD. NG2 glia generate new oligodendrocytes but few astrocytes in a murine experimental autoimmune encephalomyelitis model of demyelinating disease. J Neurosci. 2010;30(48):16383–16390. doi: 10.1523/JNEUROSCI.3411-10.2010. - DOI - PMC - PubMed
    1. Franklin RJ. Why does remyelination fail in multiple sclerosis? Nature Rev Neurosci. 2002;3(9):705–714. doi: 10.1038/nrn917. - DOI - PubMed
    1. Piaton G, Williams A, Seilhean D, Lubetzki C. Remyelination in multiple sclerosis. Prog Brain Res. 2009;175:453–464. doi: 10.1016/S0079-6123(09)17530-1. - DOI - PubMed
    1. Redford EJ, Kapoor R, Smith KJ. Nitric oxide donors reversibly block axonal conduction: demyelinated axons are especially susceptible. Brain. 1997;120(Pt 12):2149–2157. doi: 10.1093/brain/120.12.2149. - DOI - PubMed
    1. Nave KA, Trapp BD. Axon-glial signaling and the glial support of axon function. Annu Rev Neurosci. 2008;31:535–561. doi: 10.1146/annurev.neuro.30.051606.094309. - DOI - PubMed

Publication types

MeSH terms