. 2015 Mar 6;12(104):20141055.
doi: 10.1098/rsif.2014.1055.

Lateral assembly of N-cadherin drives tissue integrity by stabilizing adherens junctions

Affiliations

Lateral assembly of N-cadherin drives tissue integrity by stabilizing adherens junctions

S Garg et al. J R Soc Interface. .

Abstract

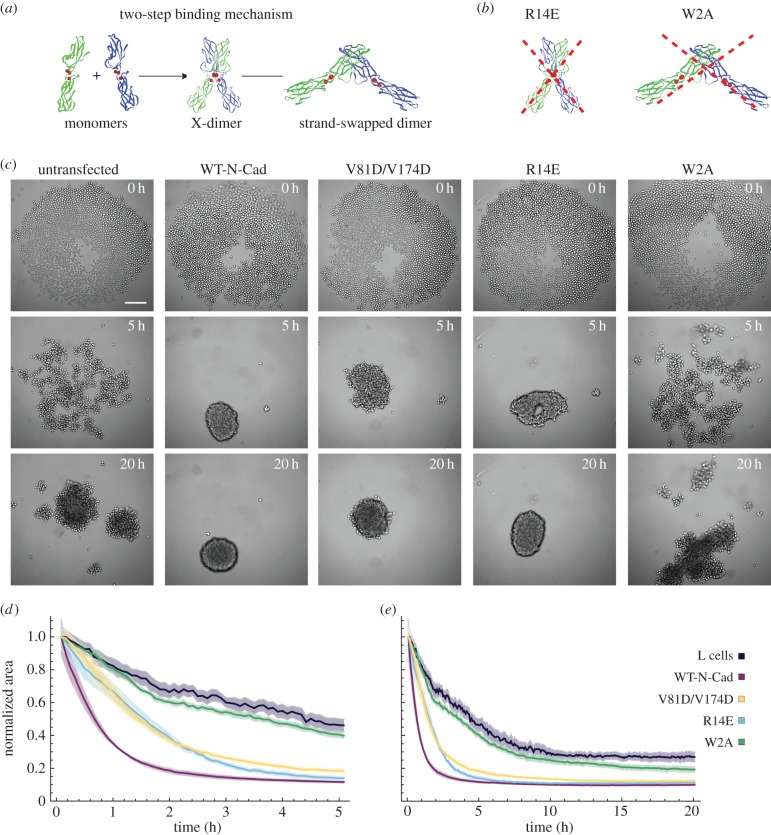
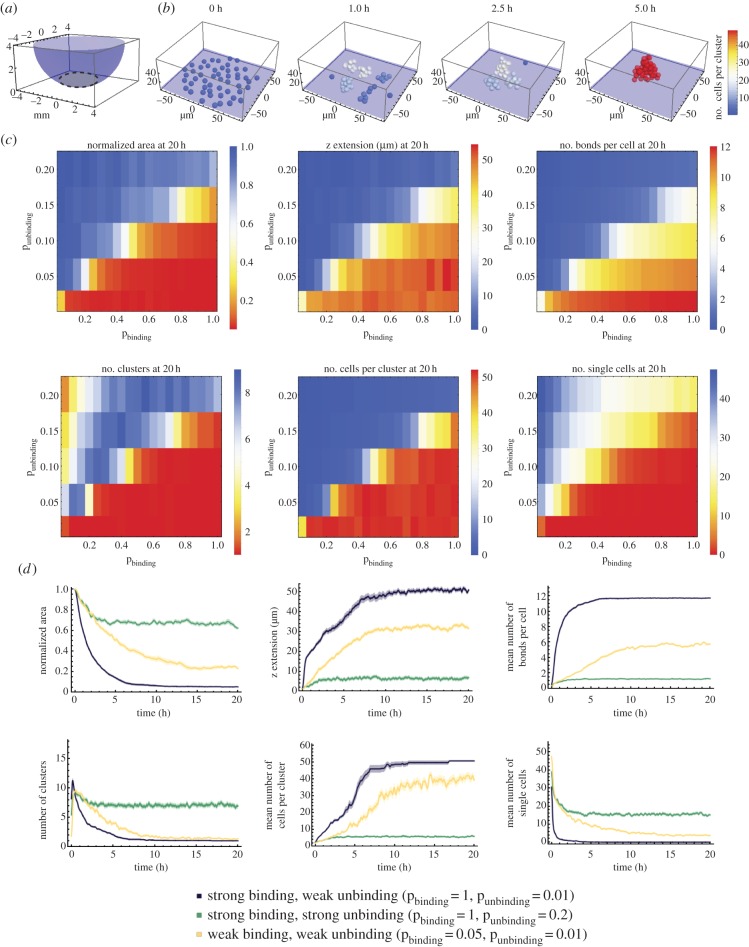
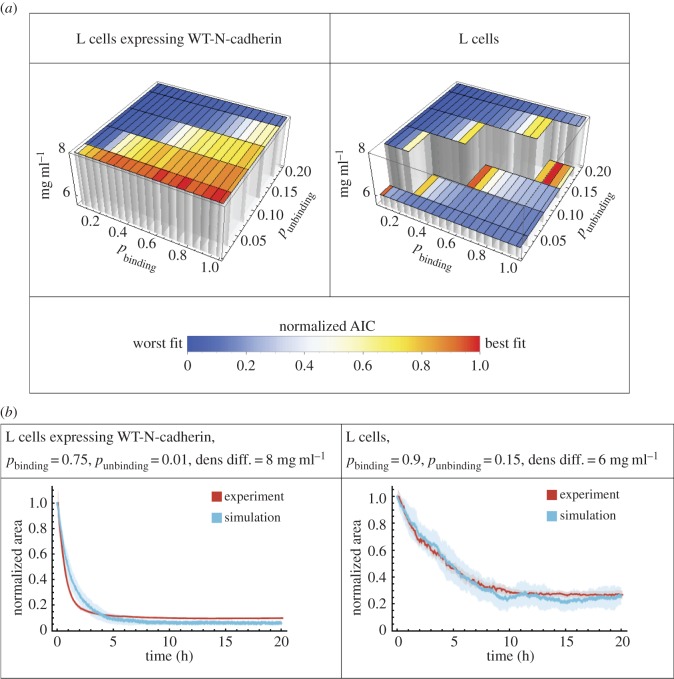
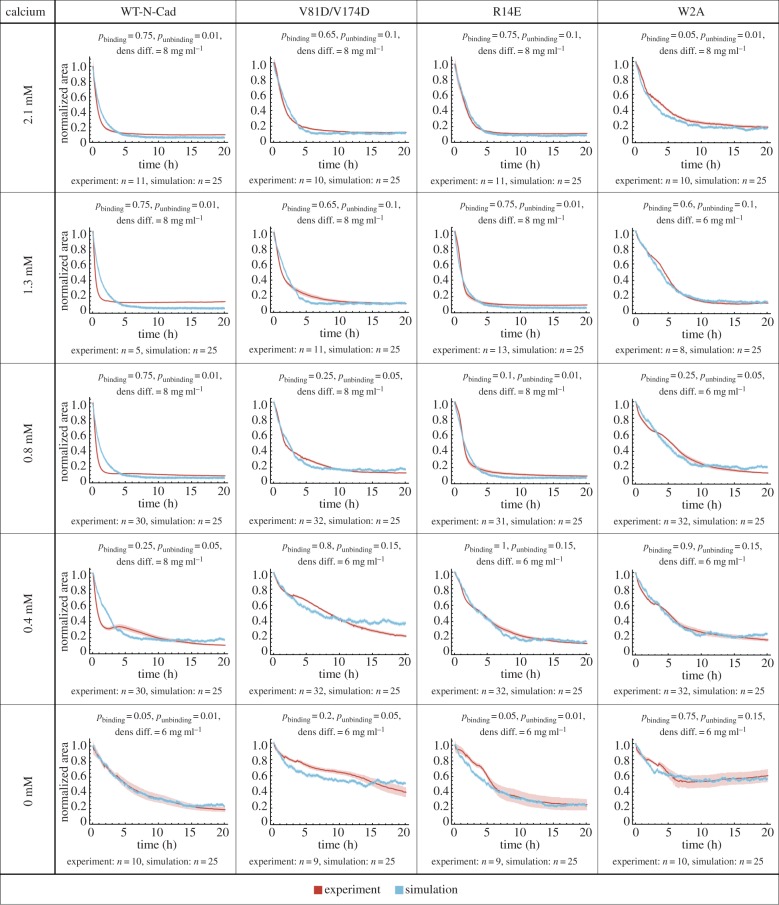
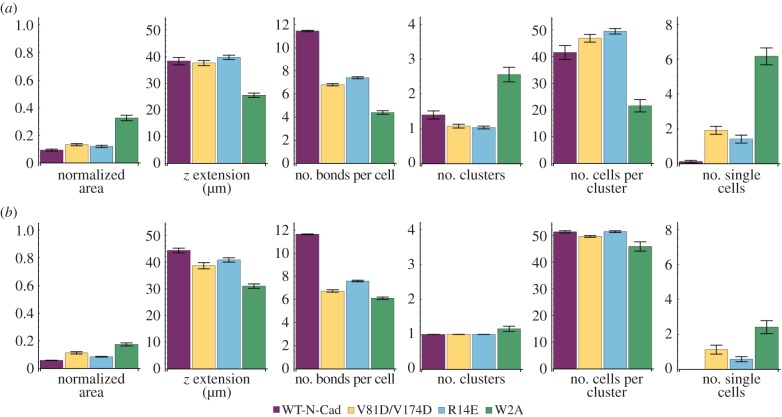
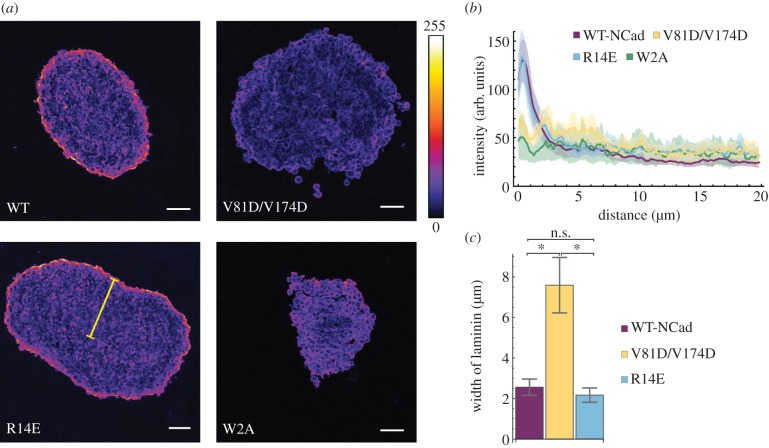
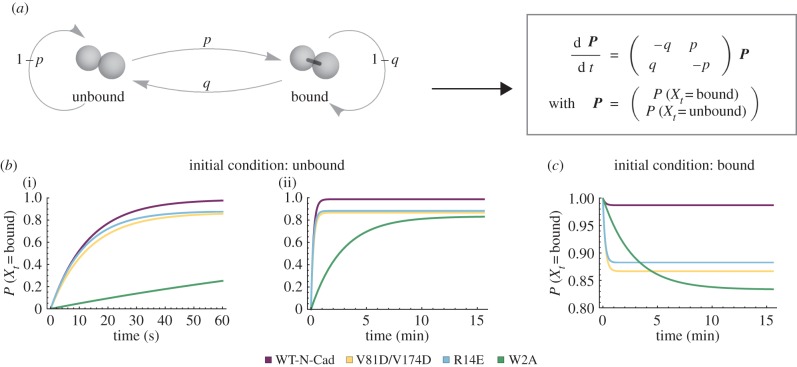
Cadherin interactions ensure the correct registry and anchorage of cells during tissue formation. Along the plasma membrane, cadherins form inter-junctional lattices via cis- and trans-dimerization. While structural studies have provided models for cadherin interactions, the molecular nature of cadherin binding in vivo remains unexplored. We undertook a multi-disciplinary approach combining live cell imaging of three-dimensional cell assemblies (spheroids) with a computational model to study the dynamics of N-cadherin interactions. Using a loss-of-function strategy, we demonstrate that each N-cadherin interface plays a distinct role in spheroid formation. We found that cis-dimerization is not a prerequisite for trans-interactions, but rather modulates trans-interfaces to ensure tissue stability. Using a model of N-cadherin junction dynamics, we show that the absence of cis-interactions results in low junction stability and loss of tissue integrity. By quantifying the binding and unbinding dynamics of the N-cadherin binding interfaces, we determined that mutating either interface results in a 10-fold increase in the dissociation constant. These findings provide new quantitative information on the steps driving cadherin intercellular adhesion and demonstrate the role of cis-interactions in junction stability.

Keywords: cell adhesion; data analysis; image analysis; long-term live cell imaging; mathematical modelling.


Figures

Figure 1.
Figure 1.
Cadherin-dependent spheroid formation of L cells. (a) Scheme of the two-step binding mechanism for cadherin trans-interactions. (b) Illustration of the effects of the R14E and W2A mutations. The R14E mutation inhibits the formation of the X-dimer; the W2A mutation prevents strand-swap dimerization. (c) Images of spheroid formation at various time points for untransfected L cells and L cells expressing WT-N-cadherin or different cadherin mutants (V81D/V174D, R14E or W2A). The seed number was 2000 cells per well. Microscope: Zeiss CellObserver; objective lens: CZ 5×/N.A. 0.13; scale bar, 200 µm. (d,e) Dynamics of the area occupied by the cells from individual cell lines normalized to the area at time 0 h, plotted with two different time scales. (d) 0–5 h (highlighting the initial dynamics) and (e) 0–20 h. Shaded regions represent the standard error of the mean (s.e.m.). Note that in some cases, due to the small error, the shaded region is not visible. Number (n) of independent experiments: L cells: n = 11; WT-N-Cad: n = 11; V81D/V174D: n = 10; R14E: n = 11; W2A: n = 10. Further statistical analyses of the data are presented in the electronic supplementary material, figure S1.
Figure 2.
Figure 2.
Computational model of spheroid formation. (a) Initially, cells are distributed at the bottom (grey-shaded region) of a well (purple). (b) Exemplary simulation of spheroid formation for 50 cells with a binding probability pbinding = 1, unbinding probability punbinding = 0.01 and a density difference of the cells relative to the medium of 6 mg ml−1. (c) Parameter scan for the binding and unbinding probabilities and cell-to-medium density difference of 6 mg ml−1. Each matrix represents the mean values for a measurement based on 25 simulations. The colour code indicates the quality of the spheroid formation from successful in red to unsuccessful in blue. A successfully formed spheroid has a low normalized area, a high z extension, a large number of bonds per cell, one cluster with a large number of cells and a minimal number of single/unclustered cells (table 1). The binding probability pbinding ranges between 0.05 and 1 with increments of 0.05, while the unbinding probability punbinding is varied from 0.01 to 0.20 with increments of 0.05. Unbinding probability values above 0.2 yielded no cell aggregation and thus were not tested further. (d) Measurements based on 25 simulations are plotted over a period of 20 h. The density difference between cells and medium is 6 mg ml−1 and three different parameter combinations for the binding and unbinding probabilities were considered. The curves were smoothed with a mean filter with a range of 5 min. Shaded regions represent the s.e.m. Owing to the small error, some shaded regions are not visible.
Figure 3.
Figure 3.
Fitting the model to experimental data for L cells expressing WT-N-cadherin and untransfected L cells, i.e. expressing no cadherins. (a) Three-dimensional bar graphs representing the results from fitting the model to the data by varying the cell-to-medium density difference as indicated by the height and the binding and unbinding probabilities. The goodness of the fit is shown by the normalized AIC values for fitting of the model to data from L cells expressing WT-N-cadherin (left) or untransfected L cells (right), where blue is the worst fit while red is the best fit. (b) The best-fit curves according to the model (blue, mean of 25 simulations) and the experimental data curves (red, mean of 11 experiments) for L cells expressing WT-N-cadherin (left) or untransfected L cells (right) for the normalized area over time. Shaded regions represent the s.e.m. Owing to the small error, some shaded regions are not visible. In both cases, the best-fit parameters are shown in the heading.
Figure 4.
Figure 4.
Fitting the model to experimental data for L cells expressing WT-N-cadherin or a cadherin mutant for various calcium concentrations in the medium. Spheroids were formed from L cells expressing WT-N-cadherin or a cadherin mutant (V81D/V174D, R14E or W2A) at varying EC calcium concentrations (0, 0.4, 0.8, 1.3 and 2.1 mM). The mean measured normalized area (red) and mean simulated normalized area (blue) was plotted over time. Shaded regions represent the s.e.m. Note that in some cases, due to the small error, the shaded region is not visible. In all cases, the number of simulations is 25, the number of experiments is at least 5 and is indicated for the various conditions individually. For each case, the best-fit parameters are shown in the heading.
Figure 5.
Figure 5.
Properties of the best-fit simulations for WT-N-cadherin, V81D/V174D, R14E and W2A. Measurements of geometrical and cluster formation properties of the cellular aggregates from 25 simulations for the best-fit parameters for WT-N-cadherin, V81D/V174D, R14E and W2A at (a) 5 h and (b) 20 h. The error bars indicate the s.e.m. Results of pairwise comparisons are shown in the electronic supplementary material, figure S4.
Figure 6.
Figure 6.
Laminin intensity around spheroids. (a) Example images for laminin stained cryo-sections of 72 h old spheroids formed by seeding 2000 cells. Microscope: LSM780; objective lens: CZ 20×/N.A. 0.8; ex: 561 nm; em: 565–630 nm; scale bars: 50 µm. (b) Intensity profile of laminin along a line from the edge of the spheroid section to the centre for L cells expressing WT-N-cadherin or one of the cadherin mutants (V81D/V174D, R14E or W2A). In (a) an example of such a line is shown in yellow. For details of the analysis, see Material and methods. Mean ± s.e.m. are shown. (c) Bars show the mean distance (±s.e.m.) from the edge of a spheroid section to the location at which the laminin intensity dropped by 60% of its maximum value. For details of the analysis, see Material and methods. Asterisks indicate significant differences (*p < 0.05). The details of the test are provided in the Material and methods. In (b,c), the number of spheroids n are WT-N-Cad: n = 8; V81D/V174D: n = 6; R14E: n = 7; W2A: n = 5.
Figure 7.
Figure 7.
Junction dynamics. (a) Illustration and differential equations for a simple model, which represents junction formation between two cells. The cells can be either bound or unbound. The transition from the unbound state to the bound state has probability p and from the bound state to the unbound state probability q. (b) Probability of the bound state over time if the cells are initially unbound at two different time scales ((i) 60 s; (ii) 15 min). (c) Probability of the bound state over time if the cells are initially bound. (b,c) The curves represent the solutions of the differential equations for the parameters p and q, which are determined by the best-fit parameters for spheroid formation of L cells expressing WT-N-cadherin (p = 0.75, q = 0.01), V81D/V174D (p = 0.65, q = 0.1), R14E (p = 0.75, q = 0.1) and W2A (p = 0.05, q = 0.01) (see also figure 4).

References

    1. Becker SF, Langhe R, Huang C, Wedlich D, Kashef J. 2012. Giving the right tug for migration: cadherins in tissue movements. Arch. Biochem. Biophys. 524, 30–42. (10.1016/j.abb.2012.02.013) - DOI - PubMed
    1. Takeichi M. 1995. Morphogenetic roles of classic cadherins. Curr. Opin. Cell Biol. 7, 619–627. (10.1016/0955–0674(95)80102-2) - DOI - PubMed
    1. Takeichi M. 1990. Cadherins: a molecular family important in selective cell–cell adhesion. Annu. Rev. Biochem. 59, 237–252. (10.1146/annurev.bi.59.070190.001321) - DOI - PubMed
    1. Harrison OJ, et al. 2011. The extracellular architecture of adherens junctions revealed by crystal structures of type I cadherins. Structure 19, 244–256. (10.1016/j.str.2010.11.016) - DOI - PMC - PubMed
    1. Harrison OJ, et al. 2010. Two-step adhesive binding by classical cadherins. Nat. Struct. Mol. Biol. 17, 348–357. (10.1038/nsmb.1784) - DOI - PMC - PubMed

Publication types

LinkOut - more resources