. 2015 Jan 14;35(2):527-43.
doi: 10.1523/JNEUROSCI.2923-14.2015.

Hypoxia silences retrotrapezoid nucleus respiratory chemoreceptors via alkalosis

Affiliations

Hypoxia silences retrotrapezoid nucleus respiratory chemoreceptors via alkalosis

Tyler M Basting et al. J Neurosci. .

Abstract

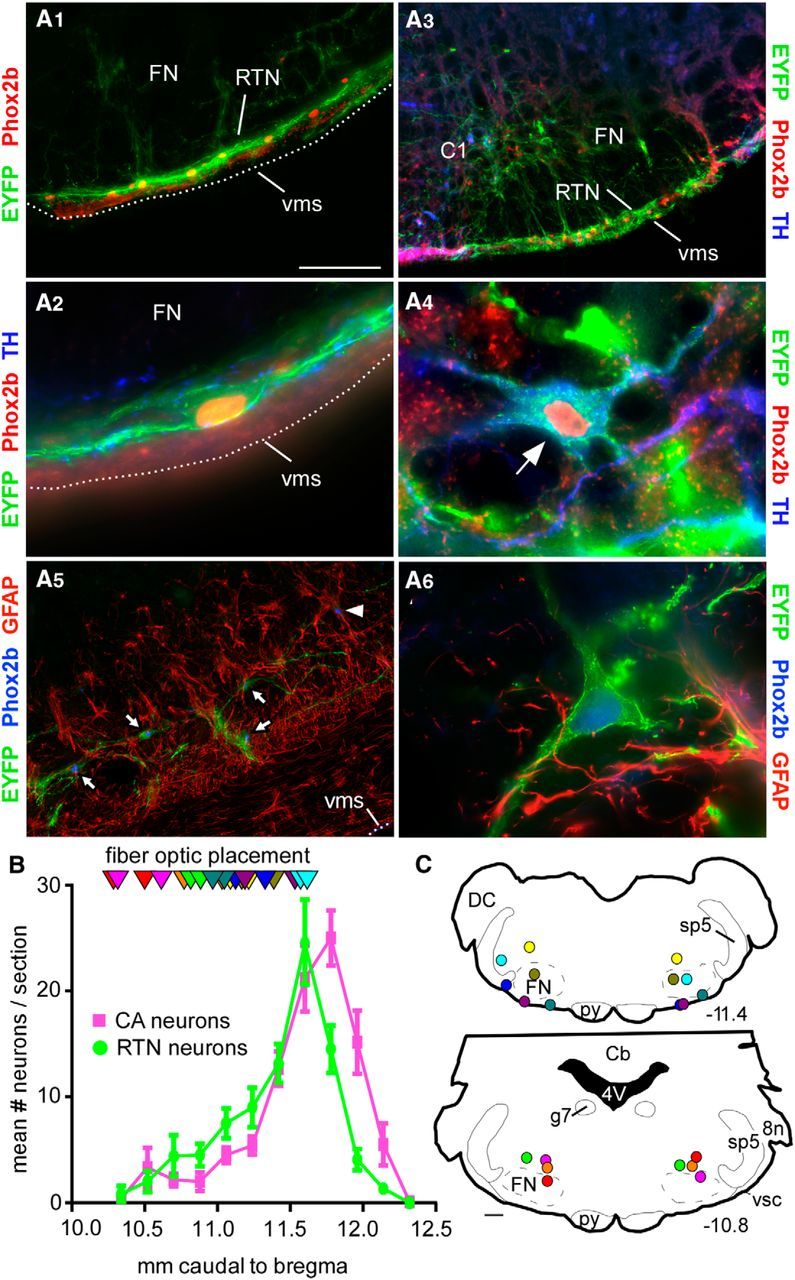
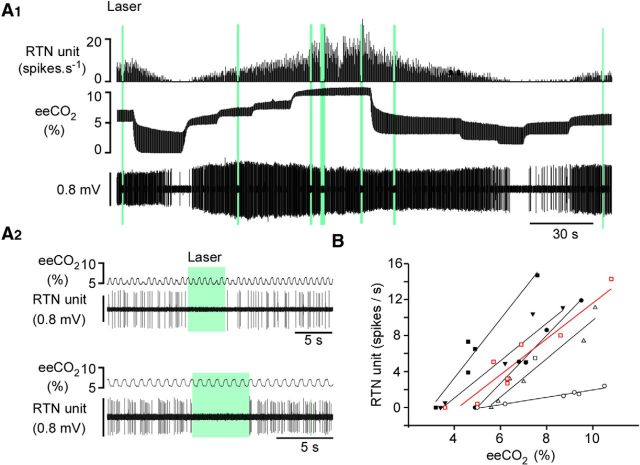
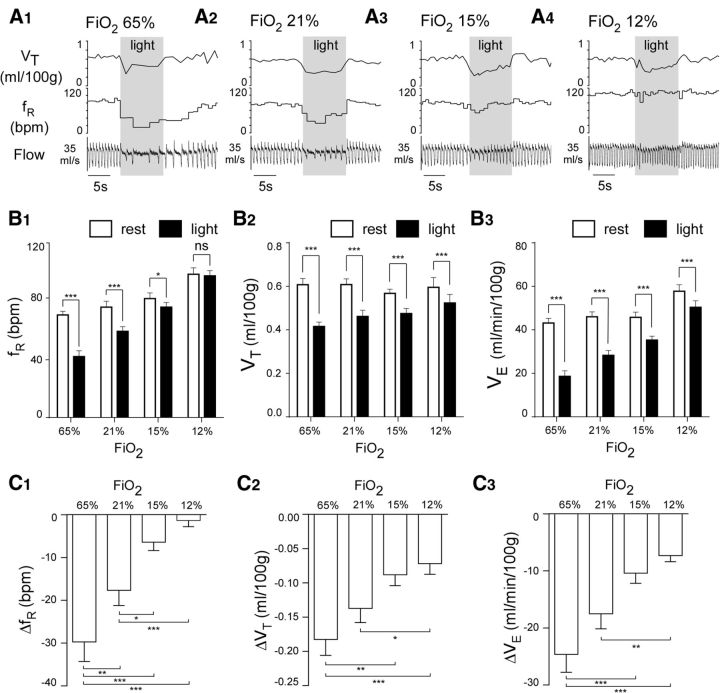
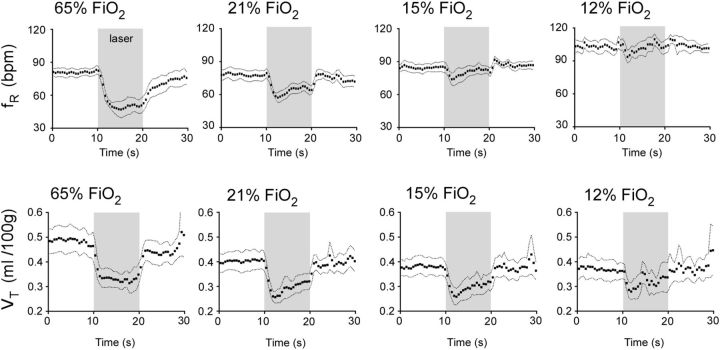
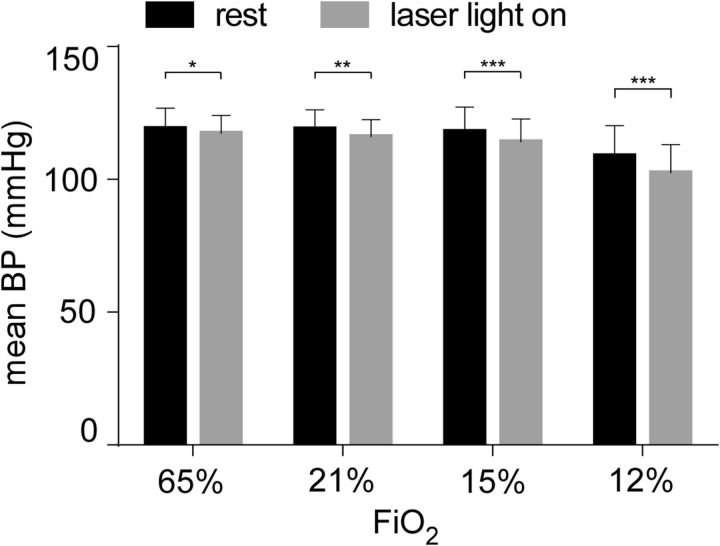
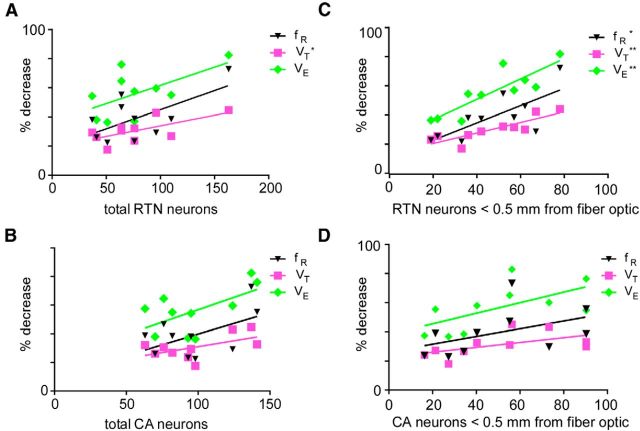
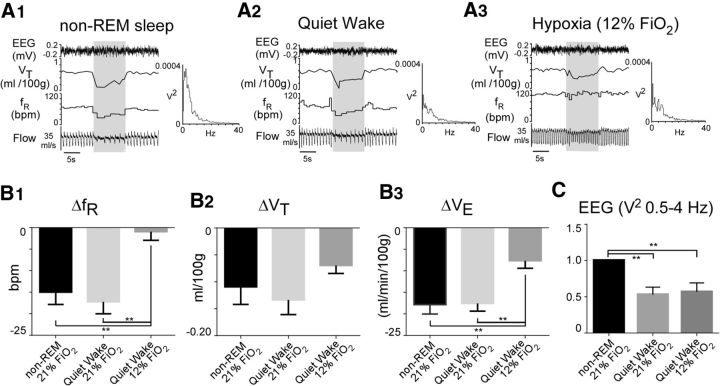
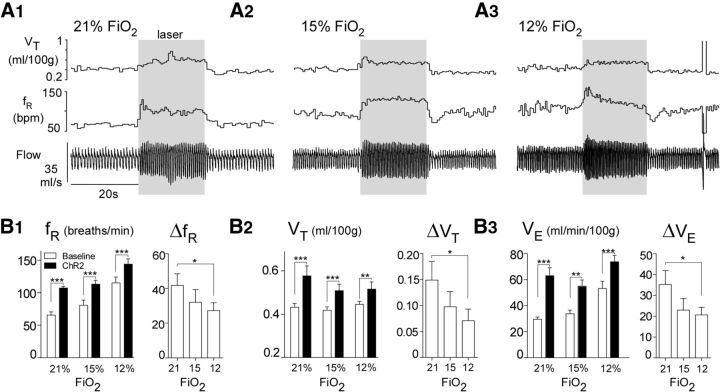
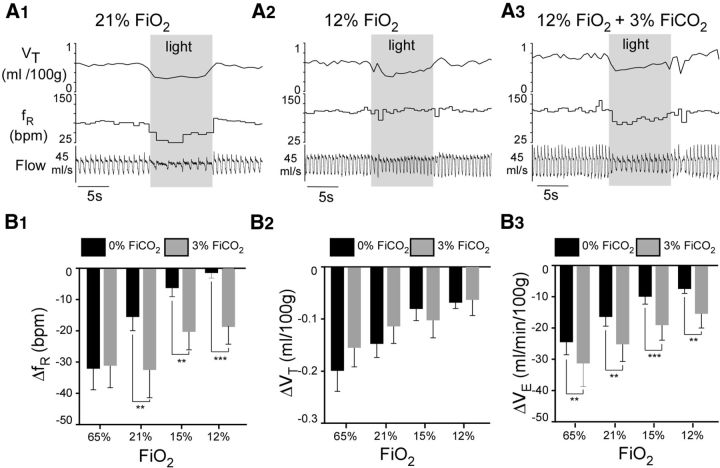
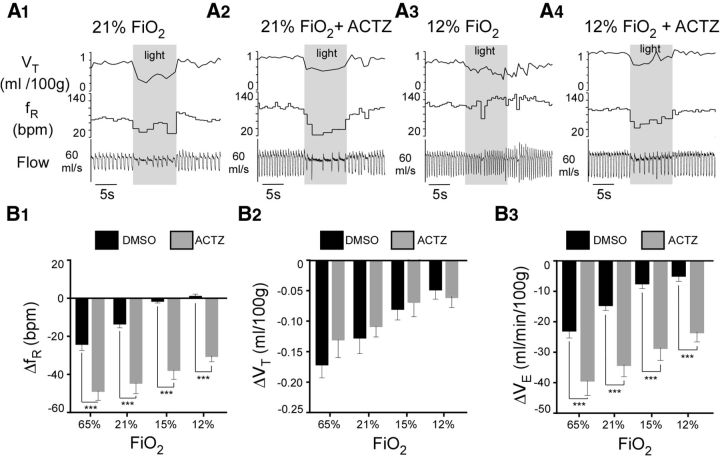
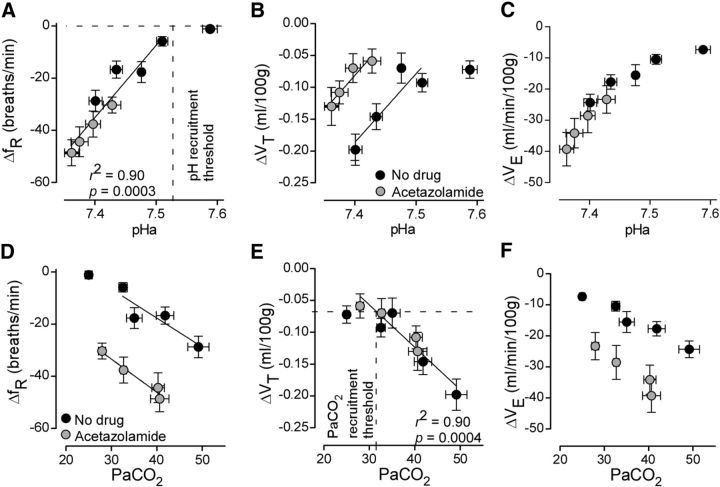
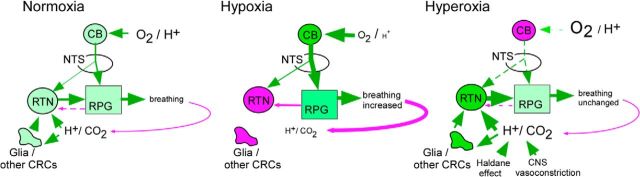
In conscious mammals, hypoxia or hypercapnia stimulates breathing while theoretically exerting opposite effects on central respiratory chemoreceptors (CRCs). We tested this theory by examining how hypoxia and hypercapnia change the activity of the retrotrapezoid nucleus (RTN), a putative CRC and chemoreflex integrator. Archaerhodopsin-(Arch)-transduced RTN neurons were reversibly silenced by light in anesthetized rats. We bilaterally transduced RTN and nearby C1 neurons with Arch (PRSx8-ArchT-EYFP-LVV) and measured the cardiorespiratory consequences of Arch activation (10 s) in conscious rats during normoxia, hypoxia, or hyperoxia. RTN photoinhibition reduced breathing equally during non-REM sleep and quiet wake. Compared with normoxia, the breathing frequency reduction (Δf(R)) was larger in hyperoxia (65% FiO2), smaller in 15% FiO2, and absent in 12% FiO2. Tidal volume changes (ΔV(T)) followed the same trend. The effect of hypoxia on Δf(R) was not arousal-dependent but was reversed by reacidifying the blood (acetazolamide; 3% FiCO2). Δf(R) was highly correlated with arterial pH up to arterial pH (pHa) 7.5 with no frequency inhibition occurring above pHa 7.53. Blood pressure was minimally reduced suggesting that C1 neurons were very modestly inhibited. In conclusion, RTN neurons regulate eupneic breathing about equally during both sleep and wake. RTN neurons are the first putative CRCs demonstrably silenced by hypocapnic hypoxia in conscious mammals. RTN neurons are silent above pHa 7.5 and increasingly active below this value. During hyperoxia, RTN activation maintains breathing despite the inactivity of the carotid bodies. Finally, during hypocapnic hypoxia, carotid body stimulation increases breathing frequency via pathways that bypass RTN.

Keywords: Archaerhodopsin; Phox2b; chemoreflex; medulla oblongata; optogenetics; ventrolateral medulla.


Figures

Figure 1.
Figure 1.
Location of Arch-transduced neurons and fiber optic tips. A1, Coronal section through the medulla (level ∼11.4 mm caudal to bregma) illustrating the selective expression of ArchT-EYFP by RTN neurons. RTN is identified by the line of strongly Phox2b-ir nuclei close to the ventral medullary surface (Takakura et al., 2006). A2, Higher-power photograph of an ArchT-transduced RTN neuron. This neuron had a Phox2b-immunoreactive (ir) nucleus, was negative for TH, but had close appositions from TH-ir synaptic boutons. A3, Coronal section (level ∼11.7 mm caudal to bregma) showing transduced RTN neurons (on the ventral medullary surface) and catecholamine (CA, presumably C1) cells dorsal to the latter. A4, Example of a transduced CA neuron containing EYFP and TH immunoreactivity plus a Phox2b-ir nucleus. A5, GFAP-ir cells (astrocytes, glia) are not ArchT-EYFP-ir. Arrows point to ArchT-EYFP-expressing neurons that are Phox2b-ir. Arrowhead indicates a nontransduced cell with a Phox2b-ir nucleus. A6, Higher-power photograph of an ArchT-transduced neuron. The GFAP-ir cells and processes are in very close proximity and do not contain EYFP. Scale bars: A1, A5, 100 μm; A3, 200 μm; A2, A4, A6, 20 μm. FN, Facial motor nucleus; vms, ventral medullary surface. B, Rostrocaudal distribution of transduced RTN and CA neurons following bilateral injections of PRSx8-ArchT-EYFP lentiviral vector under the caudal end of the facial motor nucleus (30-μm-thick sections, 180 μm apart). 8n, Eighth nerve root; Cb, cerebellum; DC, dorsal cochlear nucleus; FN, facial motor nucleus; g7, genu of the seventh nerve; py, pyramidal tract; sp5, spinal trigeminal tract; vsc, ventral spinocerebellar tract. The FN extends from −12.0 to −10 mm caudal to bregma. C, Location of the bilateral fiber optic tips identified in 10 rats. These sites are plotted on two transverse brain sections closest to their location; unique colors represent unique subjects. The exact transverse plane in which the fiber optic tips were found is also represented in B (triangles, same color code as in C). Stereotaxic coordinates (transverse planes posterior to bregma) correspond to the atlas of Paxinos and Watson (2005).
Figure 2.
Figure 2.
Arch photoactivation silences RTN neurons in anesthetized rats. A1, Example of one extracellularly recorded RTN neuron. Top, Integrated rate histogram (bin size: 1 s). Middle, eeCO2. Bottom, Extracellular action potentials. eeCO2 was changed by adding variable concentrations of CO2 to the breathing mixture; 532 nm continuous laser light was delivered in the vicinity of the neuron via a fiberoptic (green bars). The light produced immediate and complete inhibition of the neuron. A2, Expanded scale excerpts showing that the neuron was instantly and reversibly silenced by the light under lower (top) or higher eeCO2 (bottom). B, relationship between unit discharge rate and eeCO2 for 6 RTN units that were silenced by green light (the cell shown in A1 and A2 is represented in red).
Figure 3.
Figure 3.
Arch photoactivation reduces breathing rate and amplitude to different extents in conscious rats exposed to normoxia, hyperoxia, or hypoxia. A, Hypoventilation caused by bilateral Arch photoactivation (10 s) in a conscious Sprague Dawley rat under hyperoxia (65% FiO2, A1), normoxia (21% FiO2, A2), mild hypoxia (15% FiO2, A3), and moderate hypoxia (12% FiO2, A4). B, Ventilation parameters at rest and during Arch photostimulation in rats exposed to four levels (percentages) of O2 in the breathing mixture (FiO2): group data (9 rats). B1, fR at rest and during Arch photostimulation. B2, VT at rest and during Arch photostimulation. B3, VE at rest and during Arch photostimulation. C, Change in ventilation parameters elicited by Arch photostimulation across four levels of FiO2: group data (same 9 rats as in B). C1, Effect of FiO2 on ΔfR. C2, Effect of FiO2 on ΔVT . C3, Effect of FiO2 on ΔVE . *p < 0.05. **p < 0.01. ***p < 0.001.
Figure 4.
Figure 4.
Kinetics of the hypoventilatory response at four different levels of FiO2. Event-triggered averaged ventilatory responses to bilateral activation of Arch. Five or six responses were collected at each FiO2 in every rat (N = 5) to generate a single average response per rat. Five such responses were averaged. The mean and 5% confidence intervals are shown.
Figure 5.
Figure 5.
Effect of hypoxia on resting BP and on the BP response to Arch stimulation. BP measurements at rest (black bars) and during Arch stimulation (gray bars) in 4 Sprague Dawley rats under hyperoxia (65% FiO2), normoxia (21% FiO2), mild hypoxia (15% FiO2), and moderate hypoxia (12% FiO2). *p < 0.05. **p < 0.01. ***p < 0.001.
Figure 6.
Figure 6.
Relationship determined by linear regression between Arch-induced hypoventilation and the number of Arch-transduced neurons. A, Relationship between number of all RTN neurons transduced (counted in a 1:6 coronal series) and percentage decrease of fR, VT, and VE elicited by Arch photostimulation for 10 Sprague Dawley rats. B, Relationship between number of all catecholaminergic (CA) neurons transduced and percentage decrease of fR, VT, and VE (for the same 10 Sprague Dawley rats as in A) elicited by Arch photostimulation. C, Relationship between numbers of RTN neurons within 0.5 mm of the coronal plane containing the fiber optic tip. D, Relationship between numbers of CA neurons within 0.5 mm of the coronal plane containing the fiber optic tip. *p < 0.05. **p < 0.01.
Figure 7.
Figure 7.
Arousal does not account for the reduction of Arch-triggered hypoventilation during hypoxia. A, Hypoventilation caused by bilateral Arch photoactivation (10 s, gray shaded bars) in one Sprague Dawley rat during non-REM sleep (A1), quiet wake (A2), and hypoxia (12% FiO2, A3). Each panel also depicts the EEG power (FFT, 0–40 Hz) recorded during a 30 s window that included the photostimulus period and the preceding 20 s. B, Group data (5 rats). B1, Light-evoked fR reduction during non-REM sleep, quiet wake, and hypoxia (12% FiO2). B2, VT reduction during non-REM sleep, quiet wake, and hypoxia (12% FiO2). B3, VE reduction during non-REM sleep, quiet wake, and hypoxia (12% FiO2). C, EEG power (0.5–4 Hz only) during periods of quiet wake in normoxia or during hypoxia expressed as a fraction of the power recorded during periods of non-REM sleep (same 5 rats). *p < 0.05. **p < 0.01.
Figure 8.
Figure 8.
Activation of ChR2-expressing RTN/C1 neurons increases breathing in normoxia and hypoxia. A, Hyperventilation caused by unilateral ChR2 photoactivation (20 s, 20 Hz, 5 ms pulse width) in a conscious Sprague Dawley rat under normoxia (21% FiO2, A1), mild hypoxia (15% FiO2, A2), and moderate hypoxia (12% FiO2, A3). B, Left, Ventilation parameters at rest and during ChR2 photostimulation in rats exposed to three different amounts of O2 in the breathing mixture (FiO2). Right, Change in ventilation parameters evoked by ChR2 activation (6 rats). B1, fR. B2, VT at rest and during ChR2 photostimulation. B3, VE at rest and during photostimulation *p < 0.05. **p < 0.01. ***p < 0.001.
Figure 9.
Figure 9.
Hypercapnia restores Arch-induced hypoventilation under hypoxia. A, Sprague Dawley rat in normoxia (A1, 21% FiO2), hypoxia (A2, 12% FiO2), and during combined hypoxia and hypercapnia (A3, 12% FiO2 + 3% FiCO2). Arch stimulation at gray shaded bars. B, Hypoventilation elicited by Arch stimulation as a function of FiO2 and with the addition of 3% FiCO2: group data (5 rats). B1, Change in fR elicited by Arch photostimulation in the absence or presence of 3% FiCO2. B2, Change in VT elicited by Arch photostimulation in the absence or presence of 3% FiCO2. B3, Change in VE elicited by Arch photostimulation in the absence or presence of 3% FiCO2. **p < 0.01. ***p < 0.001.
Figure 10.
Figure 10.
Acetazolamide (ACTZ) restores Arch-induced hypoventilation under hypoxia. A1, A2, Sprague Dawley rat under normoxia (21% FiO2) treated with DMSO (A1, control) or ACTZ (A2). Arch activation with laser light during gray shaded regions. A3, A4, Same rat under hypoxia (12% FiO2) after DMSO (A3) or ACTZ (A4). B, Group data (N = 6, Control = 7). B1, Reduction in fR elicited by Arch activation at different FiO2 in control (DMSO) and ACTZ-treated rats. B2, Reduction in VT elicited by Arch activation at different FiO2 in control (DMSO) and ACTZ-treated rats. B3, Reduction of VE elicited by Arch activation at different FiO2 in control (DMSO) and ACTZ-treated rats. ***p < 0.001.
Figure 11.
Figure 11.
Relationship between arterial pH or PaCO2 and breathing drive contributed by Arch-transduced RTN neurons. A–C, x-y plots of pHa versus Arch-induced reductions in ΔfR, ΔVT, and ΔVE. Gray-filled circles represent data from acetazolamide-treated rats. Black-filled circles represent data from drug-free rats. D–F, Plots of PaCO2 versus Arch-induced ΔfR, ΔVT, and VE. Note the tight linear relationships between ΔfR and pHa and between ΔVT and PaCO2 across all experimental conditions. The calculated pH recruitment threshold (i.e., pHa below which RTN is active) was 7.53. This value was determined by the intersection of the regression line and the zero horizontal line (A). The data point at 12% FiO2 (no drug) was excluded from the linear regression analysis because ΔfR was zero and pHa (7.6) was clearly beyond the recruitment threshold. The PaCO2 recruitment threshold (i.e., PaCO2 above which RTN becomes active) was 32 mmHg. This value was obtained from E as the intersection between the linear part of the regression curve and the plateau defined by the invariant values of ΔVT measured at PaCO2 values below the estimated recruitment threshold (E). Physiological data: four levels of FiO2 (N = 9), 12% FiO2 with 3% FiCO2 (N = 7), four levels of FiO2 with acetazolamide (N = 6). Arterial blood gas: four levels of FiO2 (N = 6), 12% FiO2 with 3% FiCO2 (N = 4), four levels of FiO2 with acetazolamide (N = 4).
Figure 12.
Figure 12.
Summary and interpretations. During eupnea (regular involuntary breathing as during non-REM sleep and quiet wake), breathing rate and amplitude are generated by a network of pontomedullary structures called the respiratory pattern generator (RPG). Under normoxia, eupneic breathing is activated by inputs (green arrows) from RTN and from the CBs. The CB pathway relays in the nucleus of the solitary tract (NTS). The CBs activate breathing via RTN and independently of RTN. RTN neurons are subject to several feedback regulations (pink lines). At rest, the most powerful regulation of RPG operates via CO2/pH. Alkalization caused by hyperventilation withdraws the direct and astrocyte-dependent excitatory effect of acid on RTN neurons. Alkalization may also reduce excitatory inputs to RTN from other CNS acid-activated neurons and activate inhibitory inputs from unidentified acid-inhibited CNS neurons. Additional feedback (pink lines) originates from lung stretch receptors (not illustrated) and the RPG (illustrated) and may protect the lungs against hyperinflation. During hypocapnic hypoxia, the CBs are highly active, drive the RPG vigorously, which increases breathing and lowers PaCO2 and arterial [H+]. The increased ventilation further activates the inhibitory feedback to RTN (solid pink lines) causing these cells to become silent. The chemical feedback (via alkalization of RTN) is the most powerful and causes RTN neurons to become silent under hypoxia despite increased excitatory input from the CBs. During hyperoxia, the CBs are inactive, but CNS [H+] and PCO2 increase because ventilation is reduced (in rats only) and because hyperoxia reduces cerebral blood flow and facilitates CO2 dumping from erythrocytes (Haldane effect). The resulting brain acidification activates RTN further; and because of the loss of the respiratory drive that originates from the CBs, RTN contributes a much larger portion of the respiratory drive than under normoxia. Green arrows indicate excitatory pathways or stimulatory effects. Dashed lines indicate weak inputs. Solid lines of increasing thickness indicate stronger input. Pink arrows indicate inhibitory pathways or feedback (intensity also coded with dashes and lines of increasing thickness). Pale green circles or boxes represent moderately active cell groups. Dark green represents high activity. Pink represents inactivity (as in CBs during hyperoxia).

References

    1. Abbott SB, Stornetta RL, Socolovsky CS, West GH, Guyenet PG. Photostimulation of channelrhodopsin-2 expressing ventrolateral medullary neurons increases sympathetic nerve activity and blood pressure in rats. J Physiol. 2009a;587:5613–5631. doi: 10.1113/jphysiol.2009.177535. - DOI - PMC - PubMed
    1. Abbott SB, Stornetta RL, Fortuna MG, Depuy SD, West GH, Harris TE, Guyenet PG. Photostimulation of retrotrapezoid nucleus phox2b-expressing neurons in vivo produces long-lasting activation of breathing in rats. J Neurosci. 2009b;29:5806–5819. doi: 10.1523/JNEUROSCI.1106-09.2009. - DOI - PMC - PubMed
    1. Abbott SB, Stornetta RL, Coates MB, Guyenet PG. Phox2b-expressing neurons of the parafacial region regulate breathing rate, inspiration, and expiration in conscious rats. J Neurosci. 2011;31:16410–16422. doi: 10.1523/JNEUROSCI.3280-11.2011. - DOI - PMC - PubMed
    1. Abbott SB, Kanbar R, Bochorishvili G, Coates MB, Stornetta RL, Guyenet PG. C1 neurons excite locus coeruleus and A5 noradrenergic neurons along with sympathetic outflow in rats. J Physiol. 2012;590:2897–2915. doi: 10.1113/jphysiol.2012.232157. - DOI - PMC - PubMed
    1. Abbott SB, DePuy SD, Nguyen T, Coates MB, Stornetta RL, Guyenet PG. Selective optogenetic activation of rostral ventrolateral medullary catecholaminergic neurons produces cardiorespiratory stimulation in conscious mice. J Neurosci. 2013;33:3164–3177. doi: 10.1523/JNEUROSCI.1046-12.2013. - DOI - PMC - PubMed

Publication types

MeSH terms

LinkOut - more resources