. 2015 Jan 14;35(2):748-60.
doi: 10.1523/JNEUROSCI.2405-14.2015.

CCR2 antagonism alters brain macrophage polarization and ameliorates cognitive dysfunction induced by traumatic brain injury

Affiliations

CCR2 antagonism alters brain macrophage polarization and ameliorates cognitive dysfunction induced by traumatic brain injury

Josh M Morganti et al. J Neurosci. .

Abstract

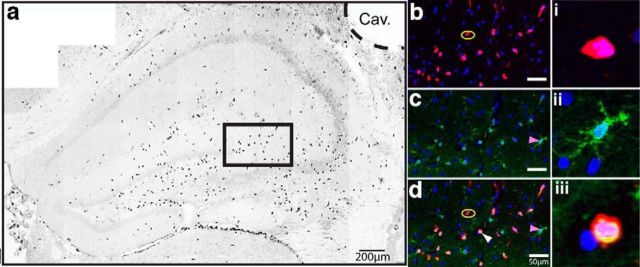
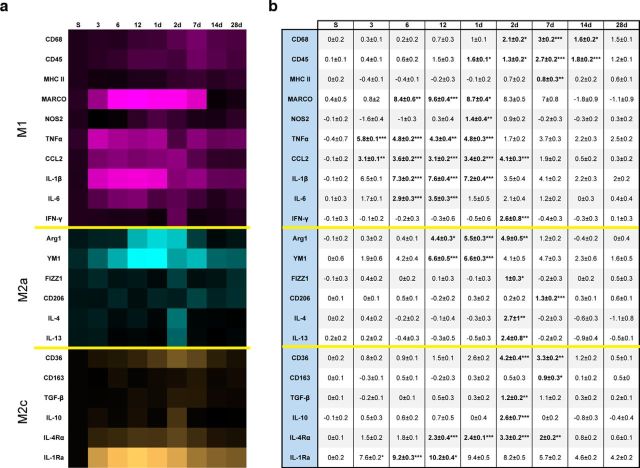
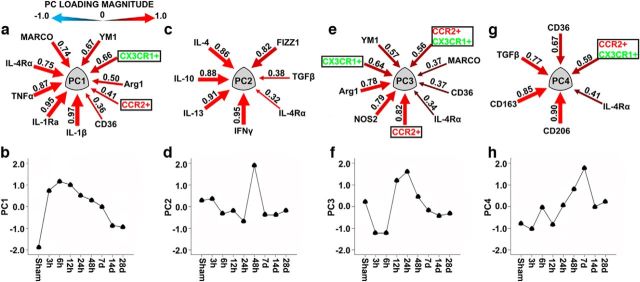
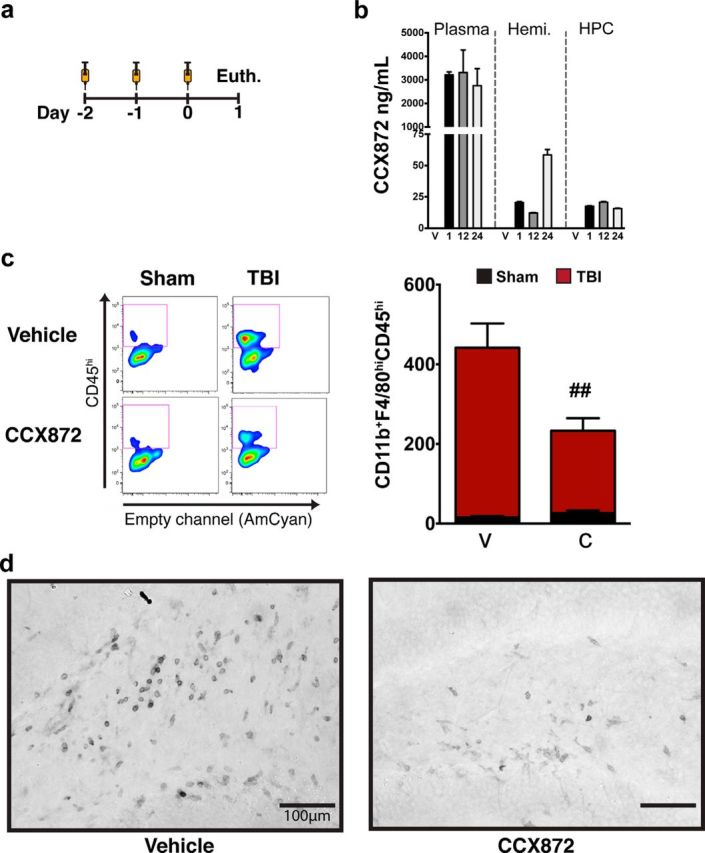
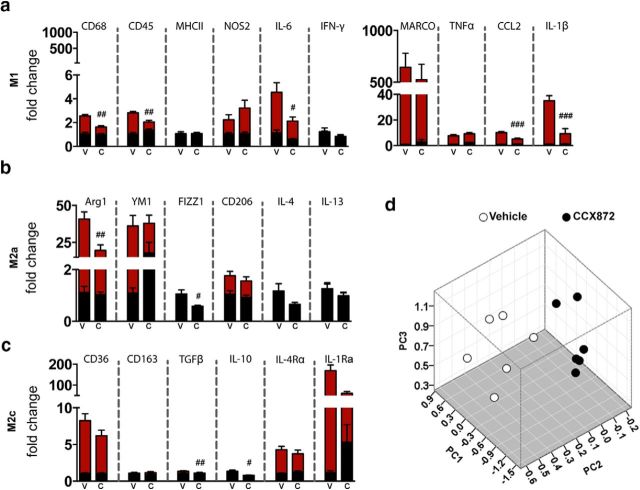
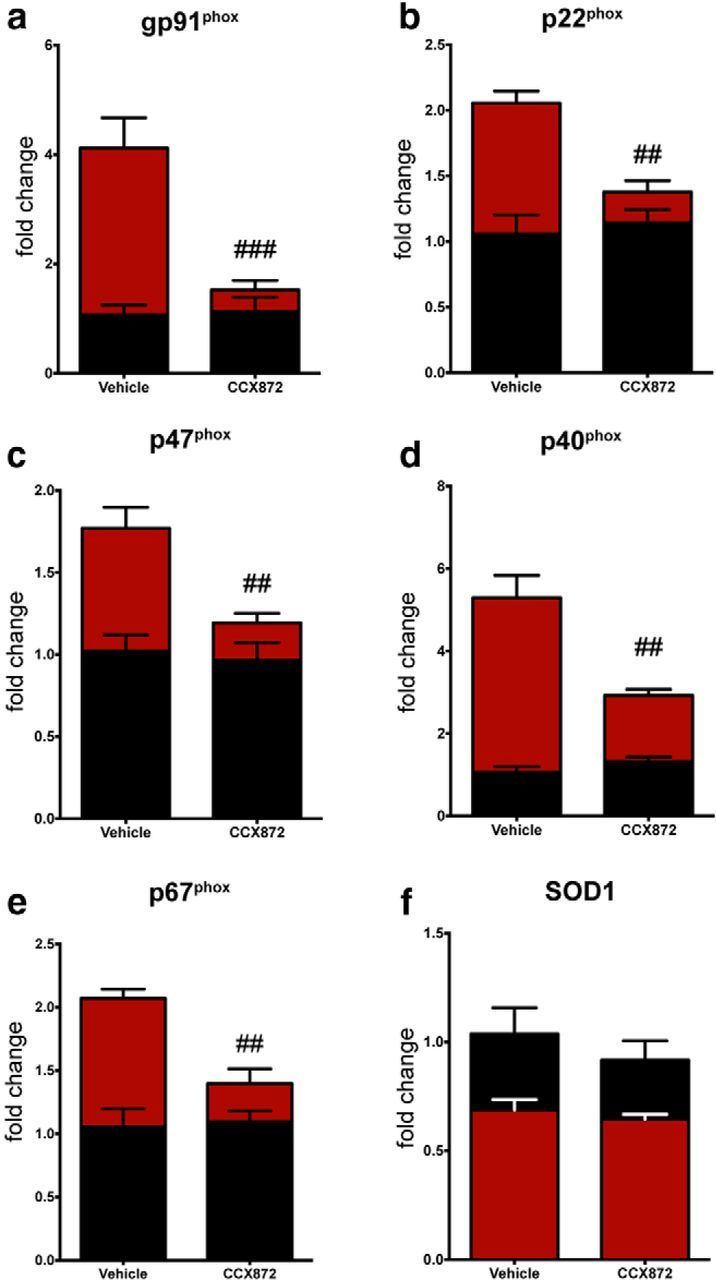
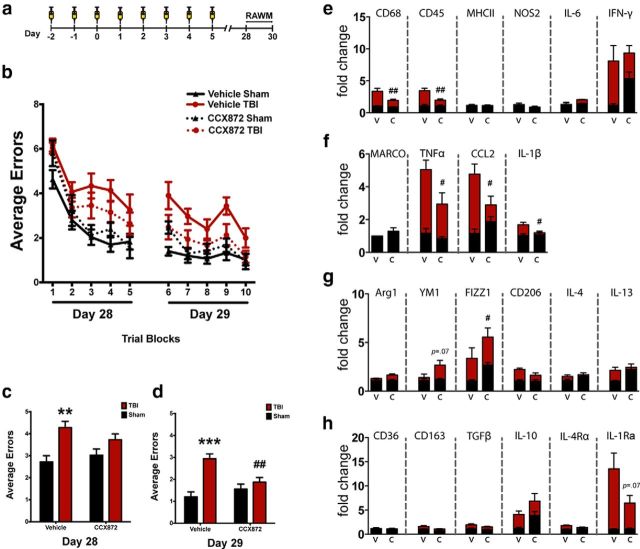
Traumatic brain injury (TBI) is a major risk factor for the development of multiple neurodegenerative diseases. With respect to the increasing prevalence of TBI, new therapeutic strategies are urgently needed that will prevent secondary damage to primarily unaffected tissue. Consistently, neuroinflammation has been implicated as a key mediator of secondary damage following the initial mechanical insult. Following injury, there is uncertainty regarding the role that accumulating CCR2(+) macrophages play in the injury-induced neuroinflammatory sequelae and cognitive dysfunction. Using CX3CR1(GFP/+)CCR2(RFP/+) reporter mice, we show that TBI initiated a temporally restricted accumulation of peripherally derived CCR2(+) macrophages, which were concentrated in the hippocampal formation, a region necessary for learning and memory. Multivariate analysis delineated CCR2(+) macrophages' neuroinflammatory response while identifying a novel therapeutic treatment window. As a proof of concept, targeting CCR2(+) macrophages with CCX872, a novel Phase I CCR2 selective antagonist, significantly reduced TBI-induced inflammatory macrophage accumulation. Concomitantly, there was a significant reduction in multiple proinflammatory and neurotoxic mediators with this treatment paradigm. Importantly, CCR2 antagonism resulted in a sparing of TBI-induced hippocampal-dependent cognitive dysfunction and reduced proinflammatory activation profile 1 month after injury. Thus, therapeutically targeting the CCR2(+) subset of monocytes/macrophages may provide a new avenue of clinical intervention following TBI.

Keywords: CCR2; PCA; TBI; inflammation; macrophage; therapeutic.


Figures

Figure 1.
Figure 1.
Peripheral CCR2+ macrophage accumulation in the brain parenchyma is temporally restricted following TBI. Flow cytometric data were obtained from CX3CR1+/GFPCCR2+/RFP adult mice ∼6 months of age at the time of injury. a, Representative pseudocolored scatterplots (n = 5 mice per time point, except 48 h, which had n = 4) of ipsilateral CD11b+F4/80hi macrophages over a time course covering acute through chronic time points. CD11b+F4/80hi macrophages were delineated by the expression of CCR2 (RFP+) along the x-axis and CX3CR1 (GFP+) along the y-axis, with the upper-right quadrant representing CX3CR1+CCR2+ double-positive macrophages. b, Accumulation of CD11b+F4/80hiCX3CR1CCR2+ macrophages was confined to 12–24 h following injury before returning to sham levels by 2 d after injury. c, Increased numbers of differentiated CD11b+F4/80hiCX3CR1+CCR2+ macrophages began to accumulate at 12 h following injury and persisted at significant levels through 7 d before returning to sham levels. d, Accumulation of CD11b+F4/80hiCX3CR1+CCR2 macrophages began at 3 h before peaking at 12 h following injury, however, an elevated trend that persisted through 28 d. e, Serum levels of CCL2 (n = 4/group) increased acutely and peaked by 12–24 h after injury, although there was an elevated trend compared with sham for the remaining time points following injury. Data were analyzed using one-way ANOVA with Dunnett's correction for multiple comparisons wherein the means for each time point were compared with mean of the sham group. Data are mean ± SEM. Dumbell-style bars represent the same level of significance among the those data points relative to sham. *p < 0.05. **p < 0.01. ***p < 0.001.
Figure 2.
Figure 2.
Controlled cortical impact model of TBI induces the accumulation of CCR2+ cells in the hippocampus. a, One day following controlled cortical impact, CCR2+ macrophages (black) are distributed throughout the dorsal hippocampus but primarily within the CA3/4 and hilar subregions of the dentate gyrus. However, concentrations of CCR2+ macrophages can be seen in the third ventricle yet more diffuse in number around the cavitation (Cav.). b–d, Inset magnification (black box) of dentate/CA3 macrophages in their respective pseudocolor images and merged with DAPI nuclei. b, Yellow ovals highlight CX3CR1CCR2+ cells. c, Magenta arrowheads indicate CX3CR1+CCR2 cells. d, White arrowhead indicates CX3CR1+CCR2+ cells. i–iii, Single-cell magnification with DAPI. i, CX3CR1CCR2+ cell. ii, CX3CR1+CCR2 cell. iii, CX3CR1+CCR2+ cell. Representative image is a stitched mosaic of multiple individual high-magnification images using mCherry (RFP), FITC (GFP), and ultraviolet (DAPI) epifluorescent filter sets. Pseudocolored image was converted to black and white.
Figure 3.
Figure 3.
Isolated leukocytes from the ipsilateral hemisphere (n = 4 or 5 per time point) exhibit a broad-spectrum of M1–M2 polarization mRNA gene expression following TBI. a, Log2-converted fold change from sham of M1 (magenta), M2a (turquoise), and M2c (orange) mRNA gene expression. Heat map visualization reveals that the soluble proinflammatory ligands of TNFα, CCL2, and IL-1β along with the cellular marker MARCO represented the greatest induction following TBI relative to all other M1 measures. Similarly, we found the greatest induction of M2a mRNA in Ym1 and Arg1 relative to all other M2a measures and IL-1Ra for M2c. b, Average of Log2-converted values for each fold change with their respective significance relative to sham indicated. Bold type indicates statistically significant fold change values. Data were analyzed using one-way ANOVA with Dunnett's correction for multiple comparisons wherein the means for each time point were compared with mean of the sham group. Data are mean ± SEM. *p < 0.05. **p < 0.01. ***p < 0.001.
Figure 4.
Figure 4.
Inflammation patterns in the brain after TBI revealed by PCA. PCA uncovered four orthogonal PC groups that together accounted for 82.7% of the total variance. Data are an analysis of both cell infiltration data (black boxes) obtained from flow cytometry in conjunction with gene expression. a, PC1 (28.8% variance) reflects increased accumulation of both CX3CR1+ and CCR2+ macrophages and their associated genes in the brain following injury. As both macrophage subsets increased in number, a corresponding increase occurred in gene expression for IL-1β, IL-1Ra, TNFα, IL-4Rα, and MARCO, with YM1, Arg1, and CD36 to a lesser degree. b, PC1 peaked dramatically early after injury, gradually waning over time (F = 130.67, p < 0.00001). c, PC2 (19.5% variance) was not linked to changes in the numbers of any accumulating macrophage subsets; however, there the PC2 group did predominantly cluster with M2a and M2c genes. Interestingly, within this cluster, IFNγ was the most strongly correlated, followed by IL-13, IL-10, IL-4, and FIZZ1, with TGFβ and IL-4Rα to lesser degrees. d, PC2 displayed a mild biphasic response, such that there was a minor repression followed by a delayed induction peaking at 2 d following injury (F = 3.909, p = 0.002). e, PC3 (15.1% variance) reflects increased accumulation of all three macrophage subsets; CCR2+, CX3CR1+, and CCR2+CX3CR1+, with CCR2+ macrophages representing the greatest association, and their gene expression spanned the M1–M2 continuum, with NOS2 and Arg1 predominantly associated. f, Temporally, PC3 exhibited a significant biphasic response, such that in the acute phases it was repressed followed by a significant induction in the subacute time frame before waning at later phases (F = 30.230, p < 0.00001). g, PC4 represents increased accumulation of CCR2+CX3CR1+ differentiated macrophages and their respective genes. As CCR2+CX3CR1+ differentiated macrophages increased in number, there was a parallel increase in gene expression of both M2a and M2c, primarily with CD206, CD163, TGFβ, and CD36. h, PC4 had a delayed response increasing by 2 d and peaking on 7 d following injury before returning to basal levels (F = 10.691, p < 0.00001). Arrows indicate PC loading magnitude (equivalent to Pearson correlations between individual variables and PCs). Arrow gauge indicates loading magnitude. Heat reflects loading directionality: red represents positive; blue represents inverse.
Figure 5.
Figure 5.
CCR2 antagonism ameliorates TBI-induced peripheral macrophage response 24 h after injury. a, CCX872 and vehicle subcutaneous injection schedule. Each animal received a single injection of CCX872 or vehicle once per day. CCX872-treated mice received three total injections at 100 mg/kg volume by weight; vehicle-treated mice received injection volumes analogous to that of CCX872 animals with respect to their weight. b, Pharmacokinetic profile of CCX872 following three subcutaneous injections shows that CCX872 concentration remains significantly higher in the plasma (n = 6/time point) at all time points relative to both the ipsilateral hemibrain (n = 3/time point) and hippocampus (n = 3/time point). c, CCX872 significantly decreased the accumulation of CD11b+F4/80hiCD45hi macrophages 24 h following injury. This resulted in an ∼50% decrease in the average number of ipsilateral F4/80hiCD45hi macrophages compared with vehicle-treated TBI mice. d, Representative images of CD45+ cells (dark gray) within the hilar subregions of the dentate gyrus 1 d after injury for both vehicle- and CCX872-treated animals. Mirroring flow cytometric data, CCX872 treatment visibly decreased the number of CD45+ cells in the hilar region of the hippocampus compared with vehicle-treated TBI animals. Flow cytometric data were analyzed using two-way ANOVA with Tukey's HSD correction for multiple comparisons. Data are mean ± SEM. # #p < 0.01, pairwise comparison for vehicle-TBI versus CCX872-TBI. Hemi, Ipsilateral hemisphere; HPC, ipsilateral hippocampus; V, vehicle; 1, 1 h; 12, 12 h; 24, 24 h; C, CCX872.
Figure 6.
Figure 6.
Acute treatment with CCX872 reduced neuroinflammatory response following TBI. Data were obtained from leukocytes (n = 6/group) isolated from the ipsilateral hemisphere. a, CCX872 treatment ameliorated TBI-induced proinflammatory/M1 response 24 h after injury. Specifically, CCX872 significantly reduced CD68, CD45, CCL2, IL-1β, and IL-6 gene expression compared with vehicle-TBI animals. b, CCX872 treatment also reduced the expression of the M2a mediators Arg1 and FIZZ1. c, Further, this treatment paradigm also decreased TBI-induced response in two anti-inflammatory M2c cytokines (TGFβ and IL-10) at this time point. d, Effect of CCR2 antagonism on multidimensional inflammation within the PC1–3 space. MANOVA revealed a significant cumulative multivariate effect on PC1–3 (Wilks λ = 0.087, F = 6.57, p < 0.001). Post hoc univariate ANOVAs revealed a significant effect on PC1 (F = 19.0, p < 0.001), PC2 (F = 4.74, p < 0.05), and PC3 (F = 3.92, p < 0.05). The effect on PC4 did not reach significance (p > 0.05). Gene expression for all groups is relative to vehicle-sham values. Data were analyzed using two-way ANOVA with Tukey's HSD correction for multiple comparisons. Data are mean ± SEM. #p < 0.05,(pairwise comparison for vehicle-TBI versus CCX872-TBI. ##p < 0.01, pairwise comparison for vehicle-TBI versus CCX872-TBI. ###p < 0.001, pairwise comparison for vehicle-TBI versus CCX872-TBI. Black bars represent sham. Red bars represent TBI. V, Vehicle; C, CCX872.
Figure 7.
Figure 7.
CCR2 antagonism mitigates TBI-induced upregulation of the NOX2 subunits. All data were obtained from leukocytes (n = 6/group) isolated from the ipsilateral hemisphere. a–e, mRNA gene expression for the multiple subunits associated with NOX2 activation, which results in increased ROS production, were downregulated in CCX872-treated TBI animals compared with vehicle-treated TBI. f, However, CCX872 treatment was unable to rescue TBI-induced downregulation of SOD1. Data were analyzed using two-way ANOVA with Tukey's HSD correction for multiple comparisons. Data are mean ± SEM. ##p < 0.01, pairwise comparison for vehicle-TBI versus CCX872-TBI. ###p < 0.001, pairwise comparison for vehicle-TBI versus CCX872-TBI. Black bars represent sham. Red bars represent TBI.
Figure 8.
Figure 8.
CCR2 antagonism abrogates TBI-induced hippocampal-dependent cognitive dysfunction 28 d following injury. a, Experimental timeline. b, Over the course of the 2 d paradigm, all four groups were able to learn the RAWM paradigm as exhibited by a progressive decrease in the average number of errors in relation to time spent in the maze. c, TBI induced a significant increase in the average number of errors during the first day (experimental day 28) of RAWM in the vehicle-treated group compared with sham. TBI did not increase the average errors for CCX872-treated mice compared with sham CCX872 animals; however, this trend was not significantly different from vehicle-treated TBI mice. d, By day 2 (experimental day 29), vehicle-treated TBI animals had persistently increased errors compared with their respective sham controls. Conversely, CCX872-treated mice exhibited no difference in the average errors compared with their respective sham operated controls but did have significantly fewer errors compared with vehicle-treated TBI mice. e–h, CCR2 antagonism abrogates TBI-induced chronic activation of proinflammatory response (e, f) while promoting increased expression of M2a mediators (g). Specifically, CD68, CD45, TNFα, CCL2, and IL-1β were all significantly downregulated in CCX872-treated TBI mice compared with vehicle-treated TBI animals, whereas CCX872 treatment induced the upregulation of several M2-associated markers at this chronic time point following injury. Notably, FIZZ1 and Arg1 were significantly increased, whereas positive trends were observed for IL-10 and Ym1, which was almost significant. All gene expression data were obtained from isolated hippocampi of WT mice following completion of RAWM. Gene expression values are relative to vehicle-sham. Data are mean ± SEM. **p < 0.01 and ***p < 0.001 for pairwise comparison between vehicle-Sham and vehicle-TBI. #p < 0.05, pairwise comparison for vehicle-TBI versus CCX872-TBI. ##p < 0.01, pairwise comparison for vehicle-TBI versus CCX872-TBI. Black bars represent sham. Red bars represent TBI. V, Vehicle; C, CCX872.

References

    1. Alamed J, Wilcock DM, Diamond DM, Gordon MN, Morgan D. Two-day radial-arm water maze learning and memory task: robust resolution of amyloid-related memory deficits in transgenic mice. Nat Protoc. 2006;1:1671–1679. doi: 10.1038/nprot.2006.275. - DOI - PubMed
    1. Auffray C, Fogg D, Garfa M, Elain G, Join-Lambert O, Kayal S, Sarnacki S, Cumano A, Lauvau G, Geissmann F. Monitoring of blood vessels and tissues by a population of monocytes with patrolling behavior. Science. 2007;317:666–670. doi: 10.1126/science.1142883. - DOI - PubMed
    1. Auffray C, Sieweke MH, Geissmann F. Blood monocytes: development, heterogeneity, and relationship with dendritic cells. Annu Rev Immunol. 2009;27:669–692. doi: 10.1146/annurev.immunol.021908.132557. - DOI - PubMed
    1. Beauchamp K, Mutlak H, Smith WR, Shohami E, Stahel PF. Pharmacology of traumatic brain injury: where is the “golden bullet?”. Mol Med. 2008;14:731–740. doi: 10.2119/2008-00050.Beauchamp. - DOI - PMC - PubMed
    1. Belarbi K, Arellano C, Ferguson R, Jopson T, Rosi S. Chronic neuroinflammation impacts the recruitment of adult-born neurons into behaviorally relevant hippocampal networks. Brain Behav Immun. 2012;26:18–23. doi: 10.1016/j.bbi.2011.07.225. - DOI - PMC - PubMed

Publication types

MeSH terms