. 2015 Jan 14;35(2):795-806.
doi: 10.1523/JNEUROSCI.3768-14.2015.

Distinguishing the central drive to tremor in Parkinson's disease and essential tremor

Affiliations

Distinguishing the central drive to tremor in Parkinson's disease and essential tremor

John-Stuart Brittain et al. J Neurosci. .

Abstract

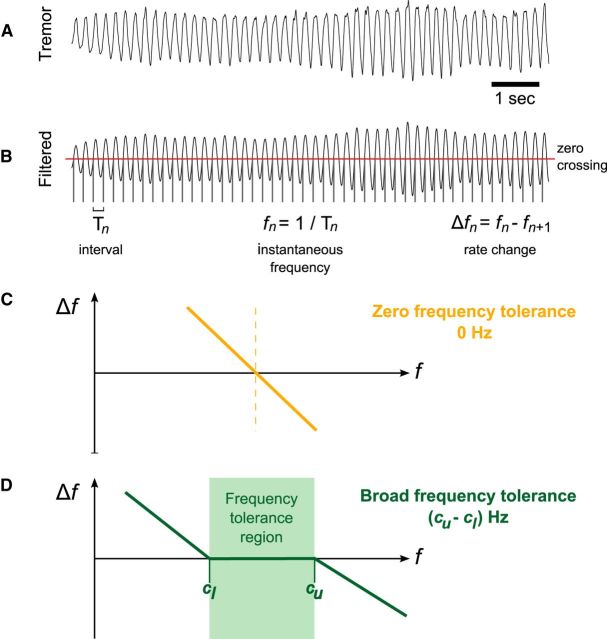
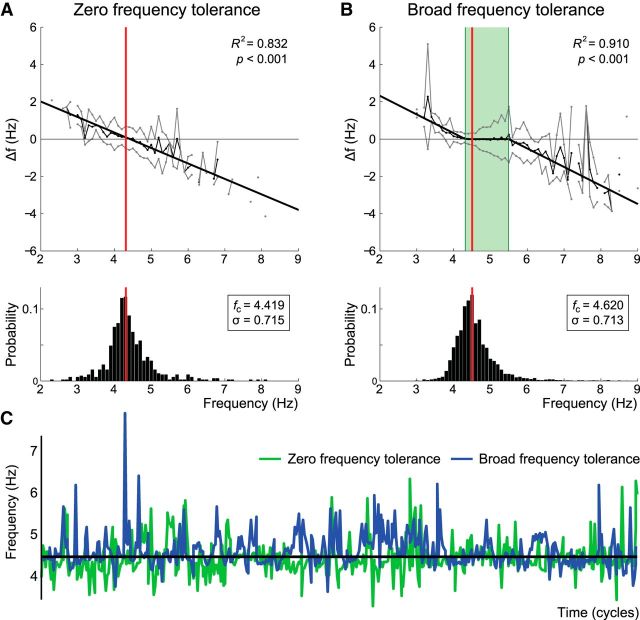
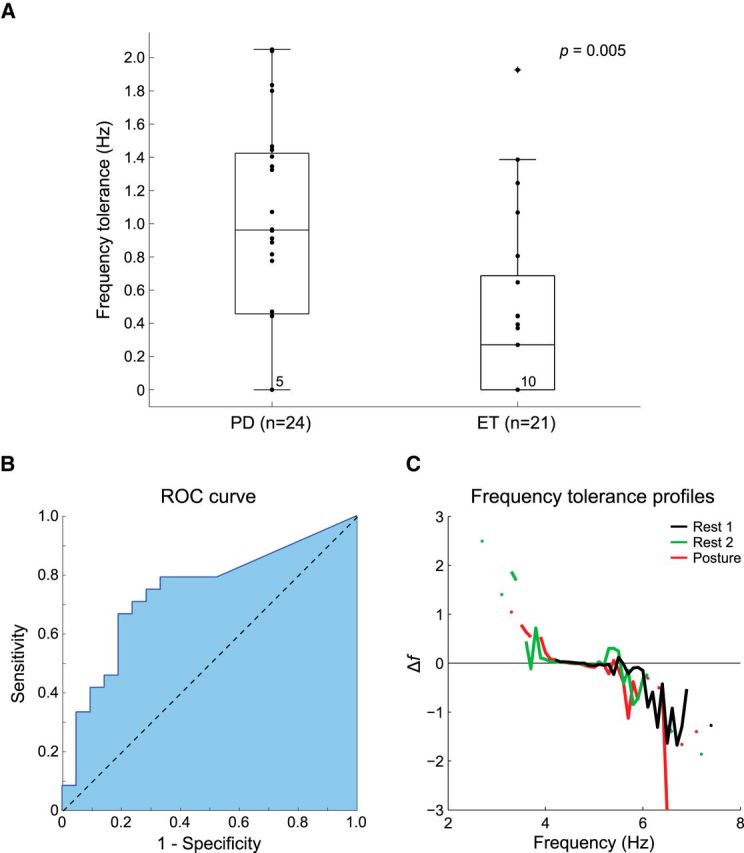
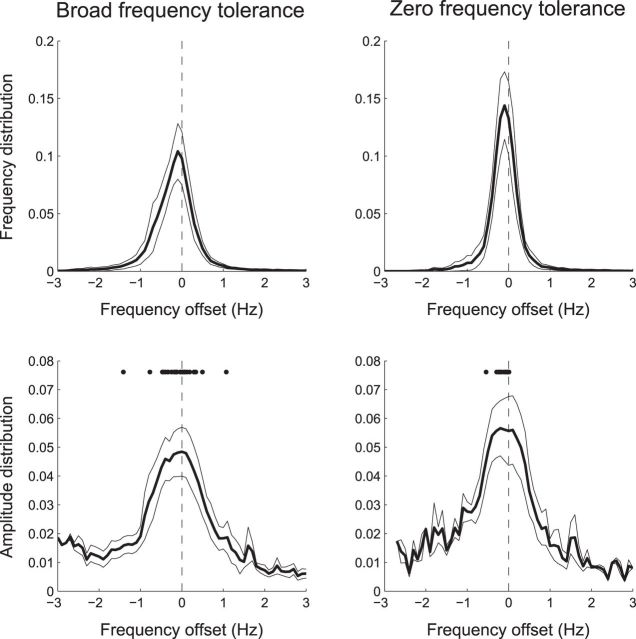
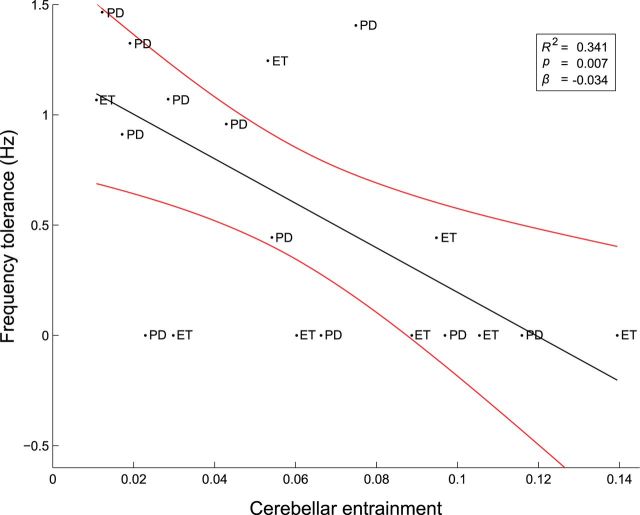
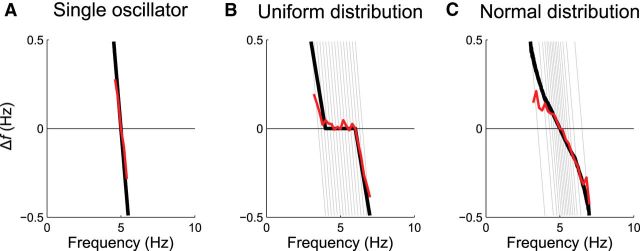
Parkinson's disease (PD) and essential tremor (ET) are the two most common movement disorders. Both have been associated with similar patterns of network activation leading to the suggestion that they may result from similar network dysfunction, specifically involving the cerebellum. Here, we demonstrate that parkinsonian tremors and ETs result from distinct patterns of interactions between neural oscillators. These patterns are reflected in the tremors' derived frequency tolerance, a novel measure readily attainable from bedside accelerometry. Frequency tolerance characterizes the temporal evolution of tremor by quantifying the range of frequencies over which the tremor may be considered stable. We found that patients with PD (N = 24) and ET (N = 21) were separable based on their frequency tolerance, with PD associated with a broad range of stable frequencies whereas ET displayed characteristics consistent with a more finely tuned oscillatory drive. Furthermore, tremor was selectively entrained by transcranial alternating current stimulation applied over cerebellum. Narrow frequency tolerances predicted stronger entrainment of tremor by stimulation, providing good evidence that the cerebellum plays an important role in pacing those tremors. The different patterns of frequency tolerance could be captured with a simple model based on a broadly coupled set of neural oscillators for PD, but a more finely tuned set of oscillators in ET. Together, these results reveal a potential organizational principle of the human motor system, whose disruption in PD and ET dictates how patients respond to empirical, and potentially therapeutic, interventions that interact with their underlying pathophysiology.

Keywords: Parkinson's disease; accelerometery; cerebellum; essential tremor; transcranial alternating current stimulation; tremor.


Figures

Figure 1.
Figure 1.
Frequency tolerance estimation method. A, The first principle component of hand tremor was extracted from triaxial accelerometer data and selected for further analysis. B, The tremor signal was filtered around its central frequency (±2 Hz) and a zero-crossing threshold applied. This isolated the interval between successive crossings and thus provided a measure of “instantaneous” frequency (on a cycle-by-cycle basis). Instantaneous frequency follows as the reciprocal of interval (fn = 1/Tn), with the rate of change in frequency given by Δfn = fnfn+1. C, Graph of schematic frequency tolerance profile, where the rate of change in frequency, Δf, is displayed against instantaneous frequency, f, in the simple linear case where there is zero frequency tolerance. D, Graph of schematic frequency tolerance profile for the piecewise-linear case where there is broad frequency tolerance. The upper and lower intercepts (cu and cl, respectively) encompass the frequency tolerance region (highlighted in green) where Δf = 0.
Figure 2.
Figure 2.
Frequency tolerance patterns. Frequency tolerance plots are presented for representative ET (A) and PD (B) patients above their respective instantaneous frequency histograms. A, The ET patient was best fit by simple linear regression, where the zero-crossing coincides with median tremor frequency. B, The PD patient was best fit by a three component piecewise-linear function (see Materials and Methods; Fig. 1). Thin black lines indicate the mean instantaneous frequency difference (Δf) plotted against instantaneous frequency (see Materials and Methods). Gray lines indicate ± SD about the mean. Bold black lines indicate the best fit solution. Red vertical bars represent median tremor frequency in each case. Green highlight on the piecewise-linear fit represents the frequency tolerance region (cucl Hz). These examples were chosen to highlight divergent tolerance behavior despite approximately matched median tremor frequencies (fc) and frequency SDs (σ). C, Temporal evolution of frequency for the first 500 cycles of the ET (green) and PD (blue) datasets.
Figure 3.
Figure 3.
Frequency tolerance distinguishes parkinsonian tremor from ET. A, Frequency tolerance is presented for the combined cohort of PD (n = 24) and ET (n = 21) patients. Box-plots delineate the 25th and 75th percentiles with medians represented by horizontal bars. Whiskers extend 1.5 times the interquartile range beyond the 25th and 75th percentiles. Individual dots indicate patient data. The number of subjects in each group best fit by simple linear regression is stated at the zero crossing. The group split in the combined cohort is highly significant (Wilcoxon rank sum, z = −2.794, p = 0.005). B, ROC curve depicting the sensitivity and specificity of frequency tolerance as a diagnostic differentiator between PD and ET. C, Frequency tolerance profiles for a representative patient with PD contrasting their resting tremor (Rest 1) with resting tremor on a subsequent visit (Rest 2) and postural tremor (Posture).
Figure 4.
Figure 4.
Group average of tremor frequency and amplitude distributions. Top row, Mean frequency distributions (±95% confidence intervals about the mean) realigned to the center of the frequency tolerance region. Bottom row, Mean amplitude distributions realigned to the center of the frequency tolerance region. Dots indicate the frequency of each subject's median amplitude. Tremor frequency and amplitude show peaked distributions that center within their frequency tolerance region.
Figure 5.
Figure 5.
Baseline frequency tolerance predicts the degree of cerebellar entrainment. Entrainment was quantified by the phase synchronization index. PD, PD patient; ET, ET patient. Inset, Regression line (black) and its 95% confidence limits (red) are shown together with goodness of fit.
Figure 6.
Figure 6.
The coupling distribution of multiple oscillators dictates tremor characteristics. A, Expected frequency tolerance (black line) and simulation result (red line) of a single oscillator. By summing the effects of a mass of neural oscillators, each resonating at a slightly different frequency, we can reproduce both piecewise-linear (B) and simple linear (C) frequency tolerance profiles. For a uniformly distributed range of oscillator frequencies, the superposed frequency tolerance profile is piecewise-linear. For a normally distributed span of frequencies, the superposed frequency tolerance profile approaches a straight line with a shallow gradient.

References

    1. Bain PG, Findley LJ, Atchison P, Behari M, Vidailhet M, Gresty M, Rothwell JC, Thompson PD, Marsden CD. Assessing tremor severity. J Neurol Neurosurg Psychiatry. 1993;56:868–873. doi: 10.1136/jnnp.56.8.868. - DOI - PMC - PubMed
    1. Benabid AL, Pollak P, Gervason C, Hoffmann D, Gao DM, Hommel M, Perret JE, de Rougemont J. Long-term suppression of tremor by chronic stimulation of the ventral intermediate thalamic nucleus. Lancet. 1991;337:403–406. doi: 10.1016/0140-6736(91)91175-T. - DOI - PubMed
    1. Ben-Pazi H, Bergman H, Goldberg JA, Giladi N, Hansel D, Reches A, Simon ES. Synchrony of rest tremor in multiple limbs in Parkinson's disease: evidence for multiple oscillators. J Neural Transm. 2001;108:287–296. doi: 10.1007/s007020170074. - DOI - PubMed
    1. Brittain JS, Brown P. The many roads to tremor. Exp Neurol. 2013;250:104–107. doi: 10.1016/j.expneurol.2013.09.012. - DOI - PubMed
    1. Brittain JS, Probert-Smith P, Aziz TZ, Brown P. Tremor suppression by rhythmic transcranial current stimulation. Curr Biol. 2013;23:436–440. doi: 10.1016/j.cub.2013.01.068. - DOI - PMC - PubMed

Publication types