Multicenter Study
. 2015 Apr;10(4):682-90.
doi: 10.1097/JTO.0000000000000456.

Relationship between tumor size and survival in non-small-cell lung cancer (NSCLC): an analysis of the surveillance, epidemiology, and end results (SEER) registry

Affiliations
Multicenter Study

Relationship between tumor size and survival in non-small-cell lung cancer (NSCLC): an analysis of the surveillance, epidemiology, and end results (SEER) registry

Jianjun Zhang et al. J Thorac Oncol. 2015 Apr.

Abstract

Introduction: Tumor size is a known prognostic factor for early stage non-small-cell lung cancer (NSCLC), but its significance in node-positive and locally invasive NSCLC has not been extensively characterized. We queried the Surveillance, Epidemiology, and End Results database to evaluate the prognostic value of tumor size for early stage and node-positive and locally invasive NSCLC.

Methods: Patients in Surveillance, Epidemiology, and End Results registry with NSCLC diagnosed between 1998 and 2003 were analyzed. Tumor size was analyzed as a continuous variable. Other demographic variables included age, gender, race, histology, primary tumor extension, node status, and primary treatment modality (surgery vs. radiation). The Kaplan-Meier method was used to estimate overall survival (OS). Cox proportional hazard model was used to evaluate whether tumor size was an independent prognostic factor.

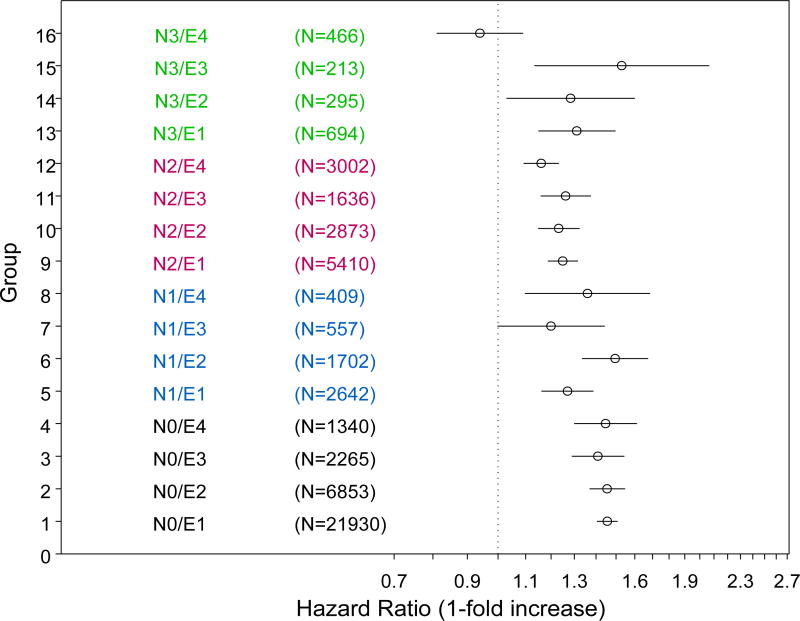
Results: In all, 52,287 eligible patients were subgrouped based on tumor extension and node status. Tumor size had a significant effect on OS in all subgroups defined by tumor extension or node status. In addition, tumor size also had statistically significant effect on OS in 15 of 16 subgroups defined by tumor extension and nodal status after adjustment for other clinical variables. Our model incorporating tumor size had significantly better predictive accuracy than our alternative model without tumor size.

Conclusions: Tumor size is an independent prognostic factor, for early stage and node-positive and locally invasive disease. Prediction tools, such as nomograms, incorporating more detailed information not captured in detail by the routine tumor, node, metastasis classification, may improve prediction accuracy of OS in NSCLC.


Figures

Figure 1
Figure 1
The effect of tumor size on OS according to tumor extension groups (A) and N stages (B). Patients in each nodal or extension group were separated into 4 subgroups based on the tumor size ≤ 2 cm; 2–5 cm; 5–7 cm; and > 7cm. OS was analyzed in each subgroup as a function of tumor size.
Figure 1
Figure 1
The effect of tumor size on OS according to tumor extension groups (A) and N stages (B). Patients in each nodal or extension group were separated into 4 subgroups based on the tumor size ≤ 2 cm; 2–5 cm; 5–7 cm; and > 7cm. OS was analyzed in each subgroup as a function of tumor size.
Figure 2
Figure 2
Hazard ratio of death per one-fold increase in tumor size in 16 subgroups based on tumor extension and nodal status. The circles represent the point estimates of hazard ratios of death and the bars show the 95% confidence intervals. It indicates increased risks of death if hazard ratio >1 while decreased risks of death if hazard ratio <1. For example, for subgroup 1 (N0E1), one-fold increase in tumor size is associated with 1.456 (1.406–1.508) fold risks of death.
Figure 3
Figure 3
A. Nomogram for predicting OS. Instructions: for each parameter (tumor size, age, gender, race, histology, node status, and tumor extension), read the points assigned on a 0 to 100 scale and add these points. Read the results on the ‘Total Points’ scale and then read the corresponding predictions below it. Example: an African American 60 year-old male patient with an N1, 8cm adenocarcinoma involving the chest wall, would score a total of 161 points: 9 (black) + 7 (male) + 44 (age) + 21 (adenocarcinoma) + 15 (extension 60, chest wall invasion) + 11 (N1) + 54 (8 cm size). His predicted 2-year survival rate and median survival time would be about 35% and about 15 months, respectively. Extension codes: 10 (tumor confined to one lung), 20/40 (tumor involving pleura or main stem bronchus ≥ 2 cm from carina), 50/60/73 (tumor involving chest wall or main stem bronchus < 2 cm from carina), 70 (tumor invading mediastinum). B. Calibration plot for the nomogram. The dashed line indicates the ideal reference line where predicted probabilities would match the observed survival rates. The dots are calculated from subcohorts of our data and represent the performance of the nomogram based on the Cox model. The X marks indicate bootstrap based, bias-corrected predictions, representing the performance of the nomogram on future new data. The closer the solid line is to the dashed line, the more accurately the model predicts OS.
Figure 3
Figure 3
A. Nomogram for predicting OS. Instructions: for each parameter (tumor size, age, gender, race, histology, node status, and tumor extension), read the points assigned on a 0 to 100 scale and add these points. Read the results on the ‘Total Points’ scale and then read the corresponding predictions below it. Example: an African American 60 year-old male patient with an N1, 8cm adenocarcinoma involving the chest wall, would score a total of 161 points: 9 (black) + 7 (male) + 44 (age) + 21 (adenocarcinoma) + 15 (extension 60, chest wall invasion) + 11 (N1) + 54 (8 cm size). His predicted 2-year survival rate and median survival time would be about 35% and about 15 months, respectively. Extension codes: 10 (tumor confined to one lung), 20/40 (tumor involving pleura or main stem bronchus ≥ 2 cm from carina), 50/60/73 (tumor involving chest wall or main stem bronchus < 2 cm from carina), 70 (tumor invading mediastinum). B. Calibration plot for the nomogram. The dashed line indicates the ideal reference line where predicted probabilities would match the observed survival rates. The dots are calculated from subcohorts of our data and represent the performance of the nomogram based on the Cox model. The X marks indicate bootstrap based, bias-corrected predictions, representing the performance of the nomogram on future new data. The closer the solid line is to the dashed line, the more accurately the model predicts OS.

References

    1. Motta G, Carbone E, Spinelli E, et al. Considerations about tumor size as a factor of prognosis in NSCLC. Ann Ital Chir. 1999;70:893–7. - PubMed
    1. Goldstraw P, Crowley J, Chansky K, et al. The IASLC Lung Cancer Staging Project: proposals for the revision of the TNM stage groupings in the forthcoming (seventh) edition of the TNM Classification of malignant tumours. J Thorac Oncol. 2007;2:706–14. - PubMed
    1. Groome PA, Bolejack V, Crowley JJ, et al. The IASLC Lung Cancer Staging Project: validation of the proposals for revision of the T, N, and M descriptors and consequent stage groupings in the forthcoming (seventh) edition of the TNM classification of malignant tumours. J Thorac Oncol. 2007;2:694–705. - PubMed
    1. Postmus PE, Brambilla E, Chansky K, et al. The IASLC Lung Cancer Staging Project: proposals for revision of the M descriptors in the forthcoming (seventh) edition of the TNM classification of lung cancer. J Thorac Oncol. 2007;2:686–93. - PubMed
    1. Rami-Porta R, Ball D, Crowley J, et al. The IASLC Lung Cancer Staging Project: proposals for the revision of the T descriptors in the forthcoming (seventh) edition of the TNM classification for lung cancer. J Thorac Oncol. 2007;2:593–602. - PubMed

Publication types