. 2015 Jan 15;10(1):e0113170.
doi: 10.1371/journal.pone.0113170. eCollection 2015.

Deep sequencing of the murine olfactory receptor neuron transcriptome

Affiliations

Deep sequencing of the murine olfactory receptor neuron transcriptome

Ninthujah Kanageswaran et al. PLoS One. .

Abstract

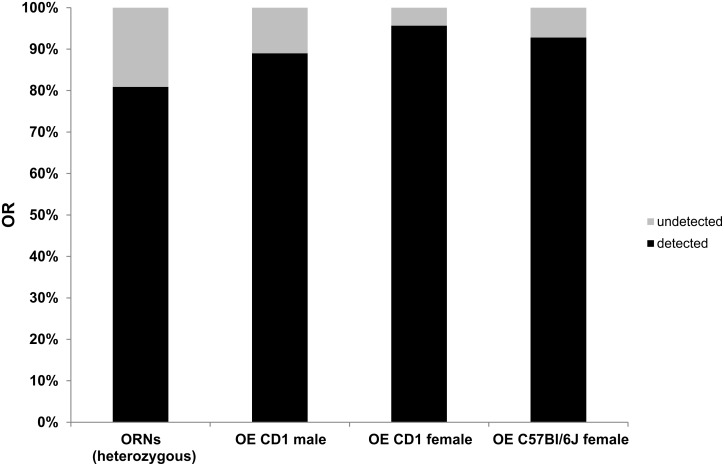
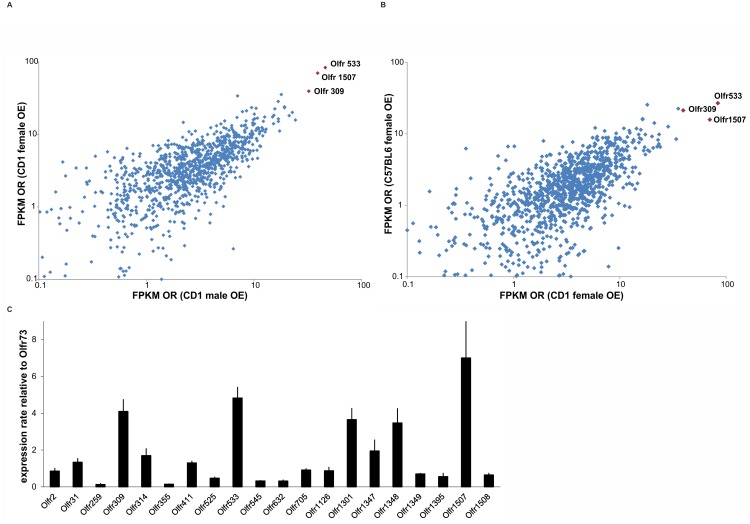
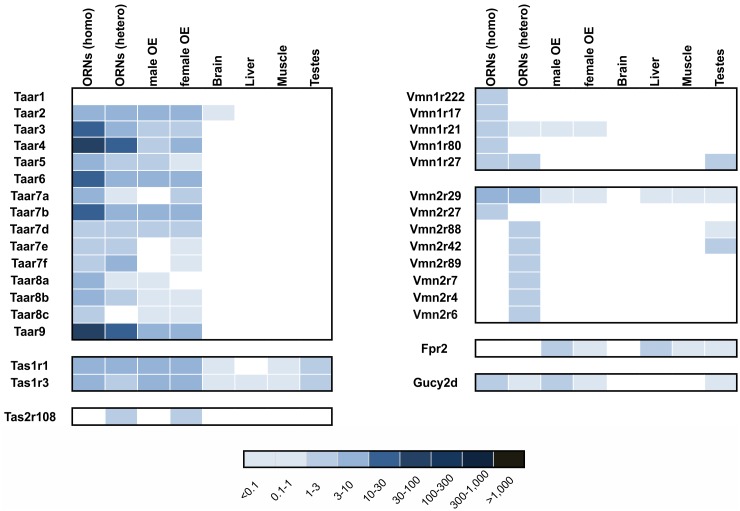
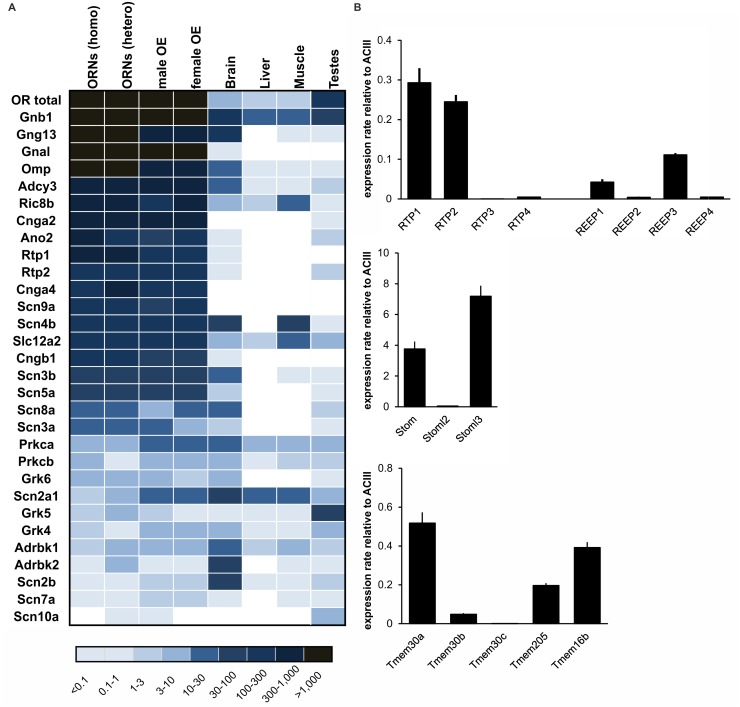
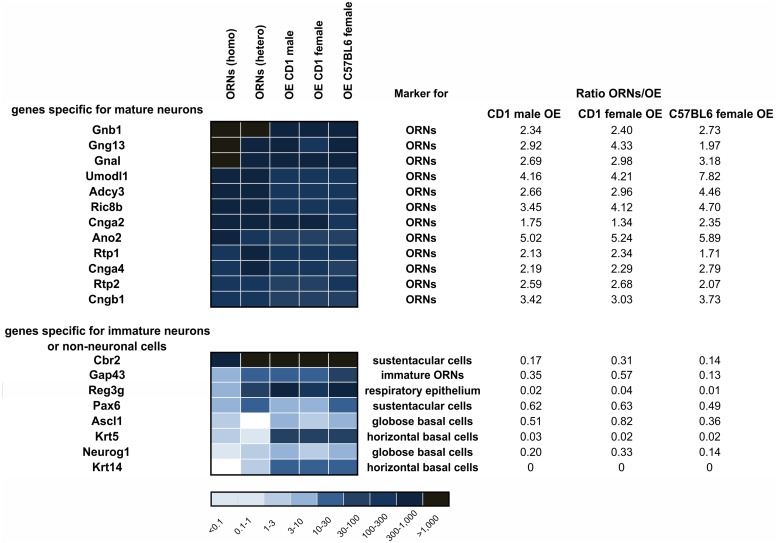
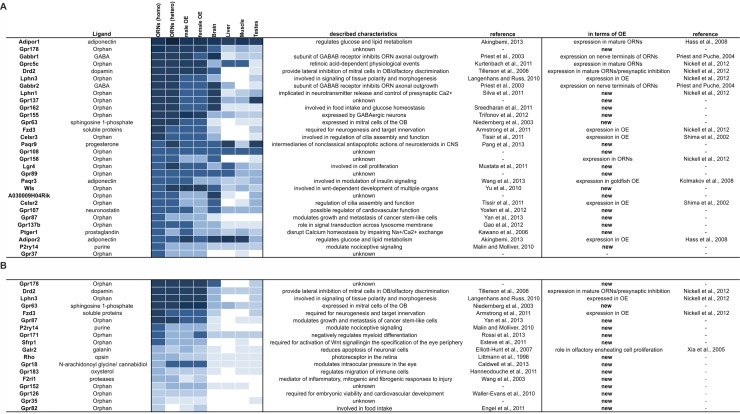
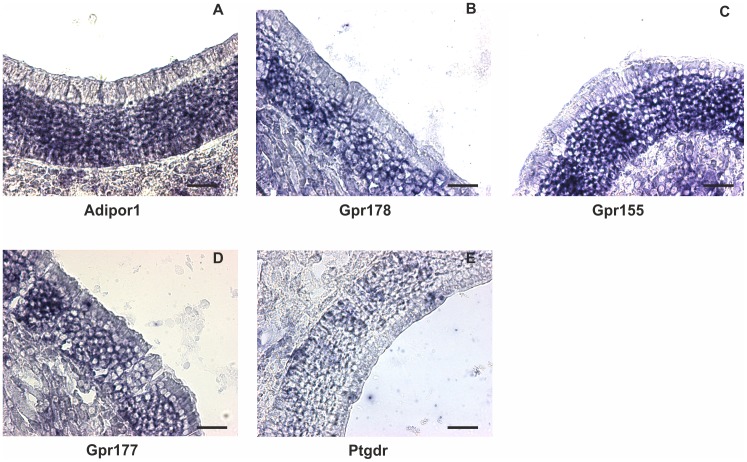
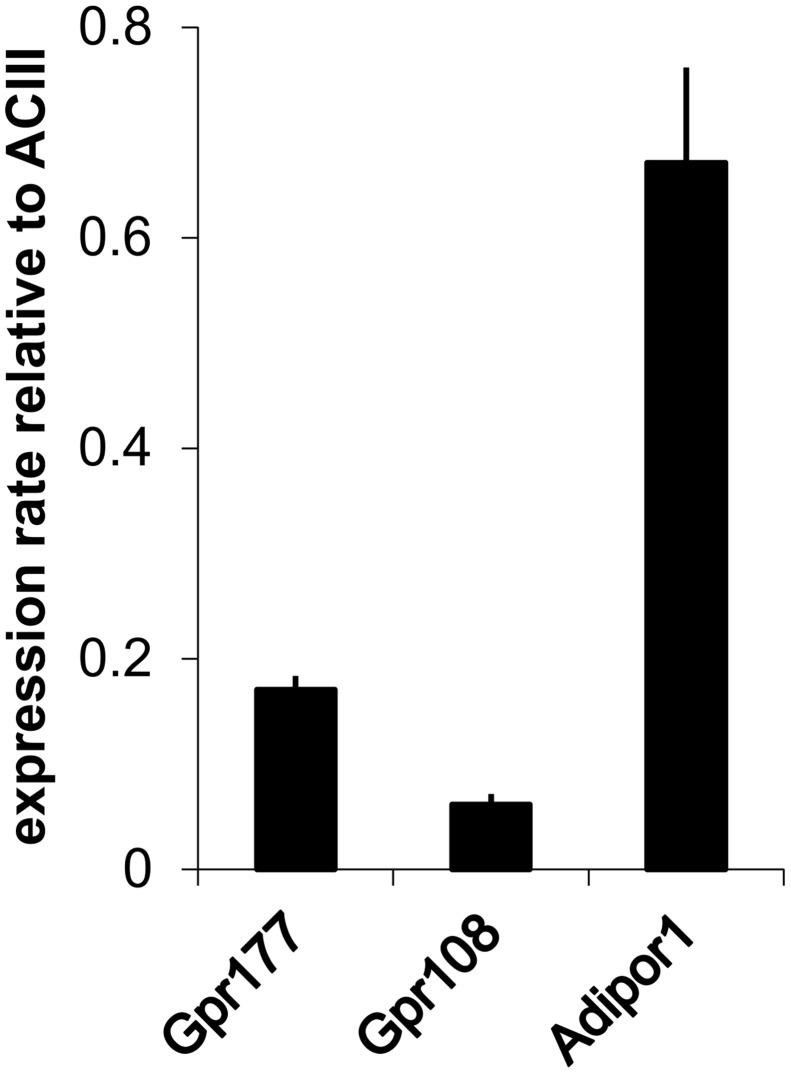
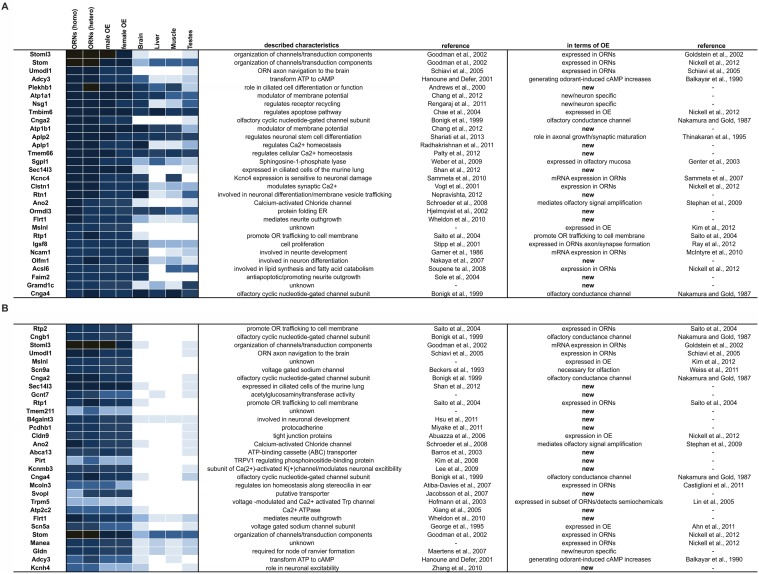
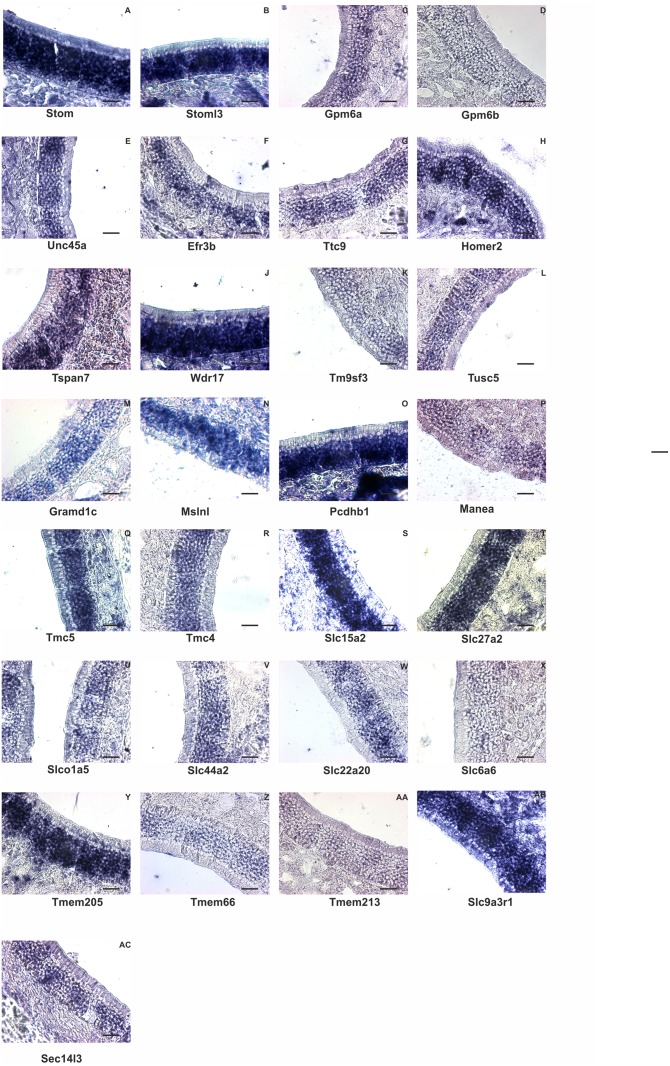
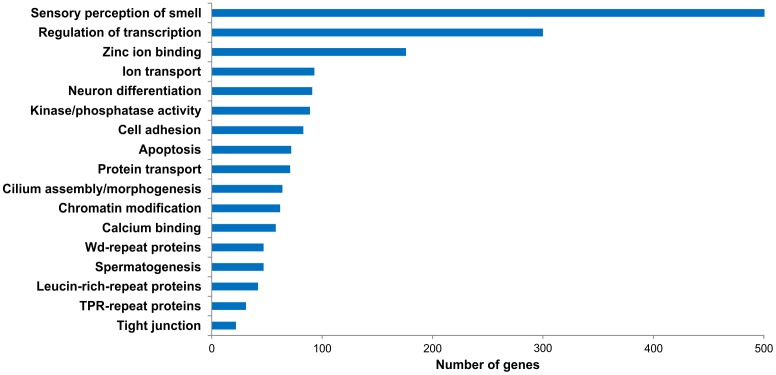
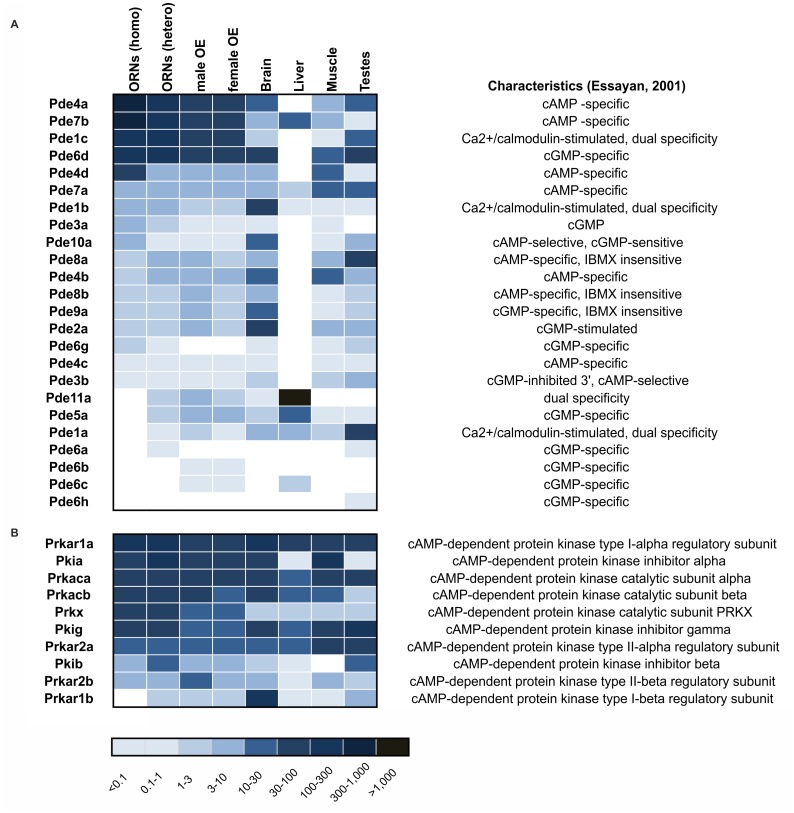
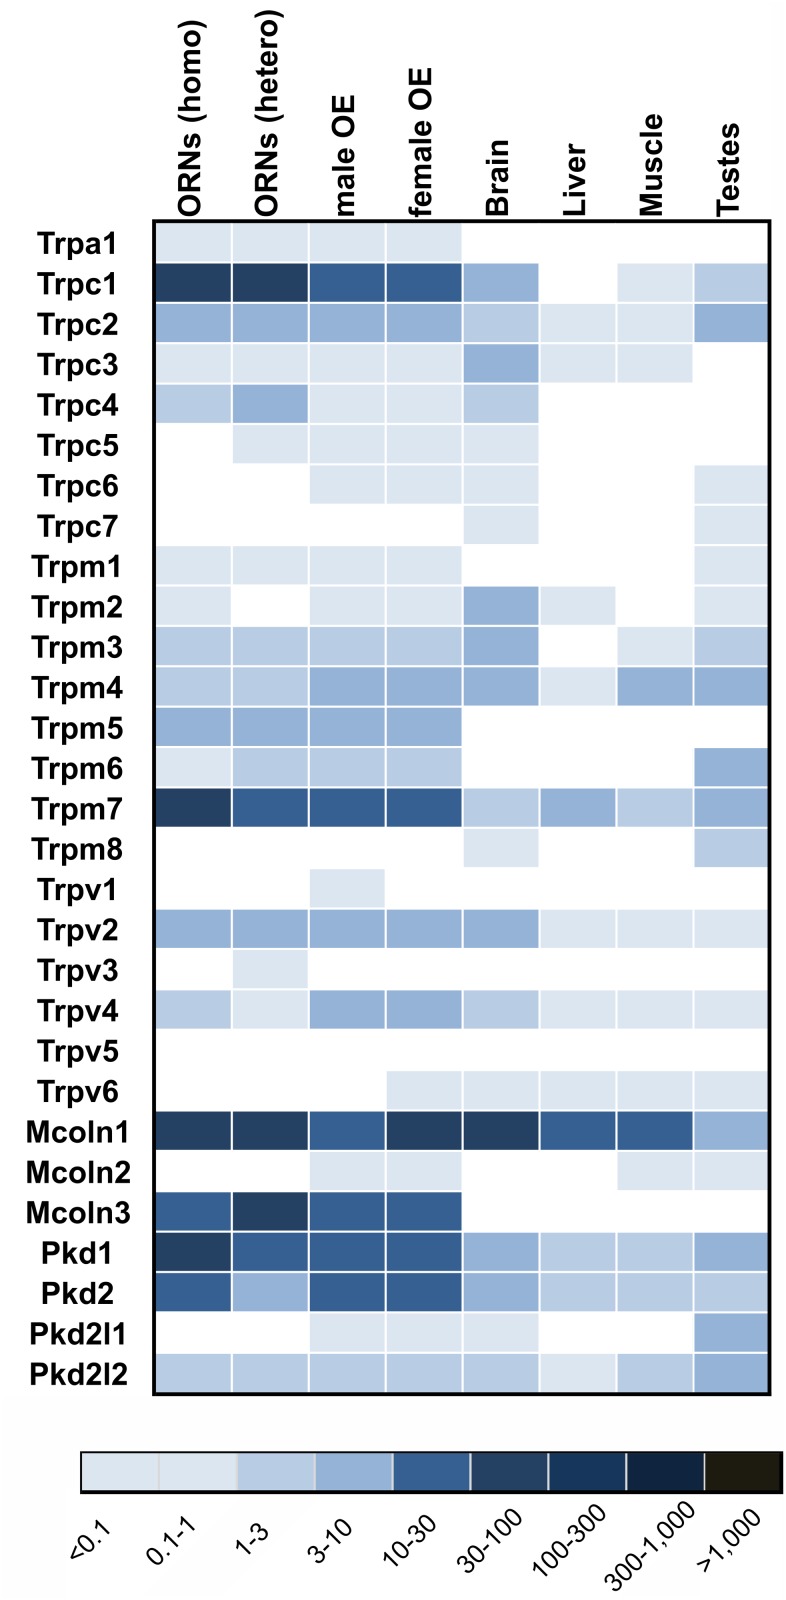
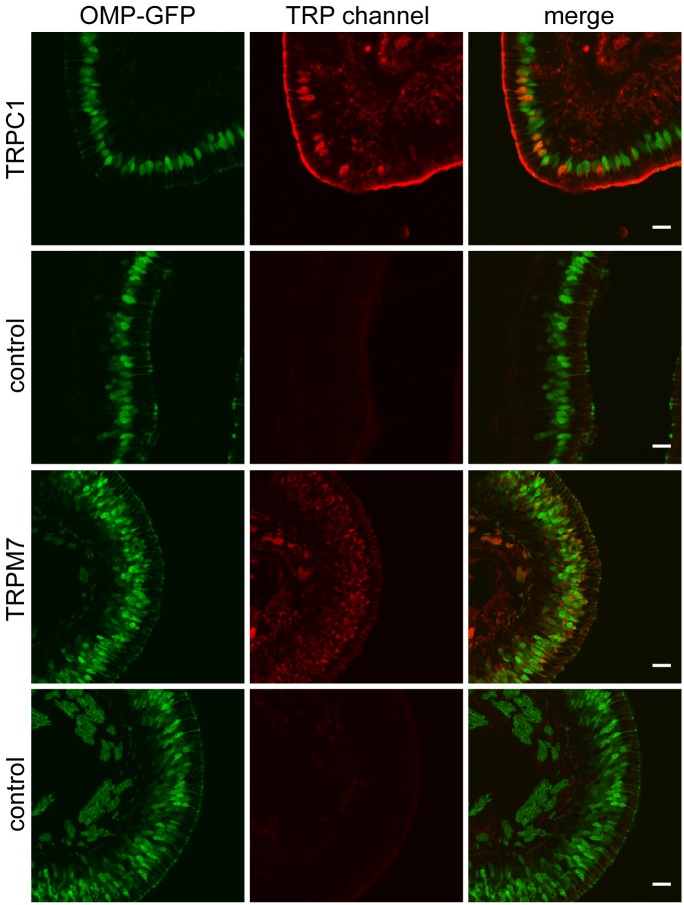
The ability of animals to sense and differentiate among thousands of odorants relies on a large set of olfactory receptors (OR) and a multitude of accessory proteins within the olfactory epithelium (OE). ORs and related signaling mechanisms have been the subject of intensive studies over the past years, but our knowledge regarding olfactory processing remains limited. The recent development of next generation sequencing (NGS) techniques encouraged us to assess the transcriptome of the murine OE. We analyzed RNA from OEs of female and male adult mice and from fluorescence-activated cell sorting (FACS)-sorted olfactory receptor neurons (ORNs) obtained from transgenic OMP-GFP mice. The Illumina RNA-Seq protocol was utilized to generate up to 86 million reads per transcriptome. In OE samples, nearly all OR and trace amine-associated receptor (TAAR) genes involved in the perception of volatile amines were detectably expressed. Other genes known to participate in olfactory signaling pathways were among the 200 genes with the highest expression levels in the OE. To identify OE-specific genes, we compared olfactory neuron expression profiles with RNA-Seq transcriptome data from different murine tissues. By analyzing different transcript classes, we detected the expression of non-olfactory GPCRs in ORNs and established an expression ranking for GPCRs detected in the OE. We also identified other previously undescribed membrane proteins as potential new players in olfaction. The quantitative and comprehensive transcriptome data provide a virtually complete catalogue of genes expressed in the OE and present a useful tool to uncover candidate genes involved in, for example, olfactory signaling, OR trafficking and recycling, and proliferation.


Conflict of interest statement

Competing Interests: The authors have declared that no competing interests exist.

Figures

Figure 1
Figure 1. OR detection using RNA-Seq: Bar chart showing the percentage of detected OR genes in female and male OE tissue and FACS-sorted ORNs.
Percentages were calculated based on the 1,125 OR genes annotated in the Refseq based gene model.
Figure 2
Figure 2. Correlations of expression levels plotted for each detected OR gene.
A. Correlation of the OR gene expression patterns between male and female CD1 mice. Only OR genes with detectable expression levels (FPKM>0.1) are shown. The FPKM values are logarithmically presented. The Pearson correlation coefficient of r = 0.83 confirmed the strong correlation of OR gene expression patterns between female and male CD1 mice. The three ORs (Olfr533, Olfr1507 and Olfr309) with the highest expression levels were also the most highly expressed in the RNA-Seq data from both sexes. B. Correlation of OR gene expression patterns between females of strain CD1 and C57BL6. The Pearson correlation coefficient of r = 0.75 confirmed the strong correlation between the expression patterns of OR genes between the different strains; however, these patterns exhibited greater divergence between strains than between the sexes of the CD1 strain. The most highly expressed ORs, Olfr533 and Olfr309, had the same expression ranking, and Olfr1507 was among the ten most highly expressed OR genes in both strains. C. Verification of RNA-Seq results for ORs by real time RT-PCR. Expression levels are relative to mOREG (Olfr73). Error bars represent the SEM.
Figure 3
Figure 3. Expression pattern of chemoreceptor genes.
Heatmap showing the expression levels of the following chemoreceptor classes: TAARs, VNO receptors, GC-D, taste receptors and FPR in olfactory (male and female OE, and FACS-sorted ORNs) and non-olfactory tissue (brain, muscle, liver and testes). Higher FPKM values are indicated by deeper colors. Only genes with a FPKMs >1 are represented in this chart.
Figure 4
Figure 4. Expression pattern of known genes of the olfactory signal transduction.
A. Heatmap showing the expression levels of genes known to be involved in olfactory signaling and other genes known to be highly expressed in ORNs as determined by NGS. The FPKM of OR total represents the accumulated gene expression of all ORs and shows that the OR is the most highly expressed gene in the OE. The main components of the signal transduction scheme were among the 200 most highly expressed genes. The FPKM values shown for OMP in sorted ORNs (homozygous) are rough estimations based on the calculation of reads located in the 3’-untranslated regions of OMP and are therefore only valid to a limited extent. Higher FPKM values are indicated by deeper colors. B. RT-PCR verification of the highly expressed genes in the OE. Gene expression was normalized to the level of adenylyl cyclase type III (ACIII) RNA. The Investigated genes were RTP1–4, REEP1–4, Stom, Stoml2–3 and transmembrane proteins, including ANO2 (Tmem16b). Error bars represent the SEM.
Figure 5
Figure 5. Differences in the gene expression patterns between ORNs and the OE.
Comparison of FACS-sorted ORNs and the OE (CD1 OE both sexes; C57BL6 female OE) revealed that genes that are known to be expressed in mature ORNs were expressed in ORNs at levels that were about two to three-fold higher those of the OE. Genes specific for non-neuronal cell types were expressed at levels that were at least two to 119-fold greater in the OE.
Figure 6
Figure 6. Expression ranking of non-olfactory GPCRs (nGPCR).
A. Heatmap showing the ranking of the 30 most highly expressed nGPCRs in the FACS-sorted ORNs. Only six nGPCRs were among the 1,000 most highly expressed genes (Adipor1, Gpr178, Gabbr1, Gprc5c, Drd2, and Lphn3). Of the 30 most highly expressed genes, the expression of 17 in the OE was no previously known. B. Heat map showing the ranking of nGPCRs that are specifically enriched in ORNs according the criteria that the nGPCRs’ FPKMs were greater than 1 and 5 times greater in the ORNs than in non-olfactory tissue (brain, liver, muscle and testes). A total of 18 specifically enriched nGPCRs were found in ORNs. Excluding the specifically enriched candidates that were already presented in the list of the 30 most highly expressed genes, an additional 10 genes were found to be specifically enriched and are new in terms of olfaction. Regarding the genes that were among the 30 most highly expressed and were specifically enriched in ORNs, 60% had neither been shown to be expressed in the OE or been ascribed any function in the OE in any previous study with the exception of for several candidates in a tabular form in a recent transcriptome-wide study of the total OE [52].
Figure 7
Figure 7. In situ hybridization for nGPCRs mRNA.
A: Adipor1 (adiponectin receptor 1) B: Gpr178; C: Gpr155; D: Gpr177 (aka Wls); E: Ptgdr (prostaglandin D receptor). All transcripts were detected in the mature ORN cell layer as predicted by the expression levels observed in sorted ORNs. Scale bar = 30 µm.
Figure 8
Figure 8. Expression levels of GPCRs by real time RT-PCR.
Bar chart shows the relative expression levels of selected GPCRs relative to adenylyl cyclase type III (ACIII) as determined by RT-PCR. In accordance with our RNA-Seq data, the most highly expressed GPCR was Adipor1. Error bars represent the SEM.
Figure 9
Figure 9. Expression patterns and ranking of genes coding for non-GPCR membrane proteins.
A. Heatmap showing the ranking of the 30 most highly expressed genes in the FACS-sorted ORNs. B. Heatmap showing the ranking of the 30 most highly expressed genes that were specifically enriched in ORNs according to criteria that their FPKMs > 1 and their expression level in ORNs was at least 5x greater than that in non-olfactory tissue (brain, liver, muscle and testes).
Figure 10
Figure 10. In situ hybridization for mRNA of non-GPCR membrane proteins.
A: Stom (stomatin), B: Stoml3: Stomatin-like protein 3, C: Gpm6a (glycoprotein m6a), D: Gpm6b (glycoprotein m6b), E: Unc45a (protein unc-45 homolog A), F: Efr3b (EFR3 homolog B), G: Ttc9 (tetratricopeptide repeat domain 9), H: Homer2 (homer protein homolog 2), I: Tspan7 (tetraspanin 7), J: Wdr17 (WD repeat domain 17), K: Tm9sf3 (transmembrane 9 superfamily member 3), L: Tusc5 (tumor suppressor candidate 5), M: Gramd1c (GRAM domain-containing protein 1), N: Mslnl (mesothelin-like protein precursor), O: Pcdhb1 (protocadherin beta 1), P: Manea (glycoprotein endo-alpha-1,2-mannosidase), Q: Tmc5 (transmembrane channel-like gene family 5), R: Tmc4 (transmembrane channel-like gene family 4), S: Slc15a2 (solute carrier family 15 (H+/peptide transporter), member 2), T: Slc27a2 (solute carrier family 27 (fatty acid transporter), member 2), U: Slco1a5 (solute carrier organic anion transporter family, member 1a5), V: Slc44a2 (solute carrier family 44, member 2 / choline transporter-like protein 2), W: Slc22a20 (solute carrier family 22 member 20), X: Slc6a6 (sodium- and chloride-dependent taurine transporter), Y: Tmem205 (transmembrane protein 205), Z: Tmem66 (transmembrane protein 66), AA: Tmem213 (transmembrane protein 213), AB: Slc9r3a1 (solute carrier family 9 (sodium/hydrogen exchanger), member 3 regulator 1, AC: Sec14l3 (Sec14-like protein 3). All transcripts were detected in the mature ORN cell layer as predicted by the expression in sorted ORNs. Scale bar = 30 µm
Figure 11
Figure 11. Classification of GO terms enriched in ORNs.
Based on results from Ontologizer [88], specifically enriched GO terms are represented in this bar chart. For simplification, related classes were combined.
Figure 12
Figure 12. Expression patterns of genes involved in cAMP-dependent signaling.
A. Expression patterns of cyclic nucleotide phosphodiesterase (PDE) genes. Heatmap showing the expression levels of PDEs in olfactory tissue and non-olfactory tissues (brain, liver, muscle and testes). B. Expression patterns of cAMP-dependent protein kinases and associated regulatory proteins in olfactory tissue and non-olfactory tissues (brain, liver, muscle and testes). Higher FPKM values are indicated by deeper colors.
Figure 13
Figure 13. Expression pattern of TRP channel genes.
Heatmap showing the expression levels of annotated TRP channels in olfactory (male and female OE, and FACS-sorted ORNs) and non-olfactory tissues (brain, muscle, liver and testes). Higher FPKM values are indicated by deeper colors.
Figure 14
Figure 14. Expression of TRPC1 and TRPM7 in the OE.
Protein expression was assessed staining coronal sections of OMP-GFP mice with anti-TRPC1 and TRPM7 antibodies. TRPC1 immunoreactvity was observed in a few ORNs in 1 of 3 stained sections, while TRPM7 immunoreactivity was detected in a larger number of ORNs (1 stained section). Omission of the primary antibody served as control. Scale bar, 20 μm.

References

    1. Godfrey PA, Malnic B, Buck LB (2004) The mouse olfactory receptor gene family. Proc. Natl. Acad. Sci. U.S.A. 101 (7): 2156–2161. 10.1073/pnas.0308051100 - DOI - PMC - PubMed
    1. Mombaerts P (2004) Odorant receptor gene choice in olfactory sensory neurons: the one receptor-one neuron hypothesis revisited. Curr. Opin. Neurobiol. 14 (1): 31–36. 10.1016/j.conb.2004.01.014 - DOI - PubMed
    1. Buck L, Axel R (1991) A novel multigene family may encode odorant receptors: a molecular basis for odor recognition. Cell 65 (1): 175–187. 10.1016/0092-8674(91)90418-X - DOI - PubMed
    1. Glusman G, Yanai I, Rubin I, Lancet D (2001) The complete human olfactory subgenome. Genome Res. 11 (5): 685–702. 10.1101/gr.171001 - DOI - PubMed
    1. Niimura Y, Nei M (2007) Extensive gains and losses of olfactory receptor genes in mammalian evolution. PLoS ONE 2 (8): e708 10.1371/journal.pone.0000708 - DOI - PMC - PubMed

Publication types