. 2015 Apr 1;191(7):775-85.
doi: 10.1164/rccm.201409-1646OC.

Divergent, coexisting Pseudomonas aeruginosa lineages in chronic cystic fibrosis lung infections

Affiliations

Divergent, coexisting Pseudomonas aeruginosa lineages in chronic cystic fibrosis lung infections

David Williams et al. Am J Respir Crit Care Med. .

Abstract

Rationale: Pseudomonas aeruginosa, the predominant cause of chronic airway infections of patients with cystic fibrosis, exhibits extensive phenotypic diversity among isolates within and between sputum samples, but little is known about the underlying genetic diversity.

Objectives: To characterize the population genetic structure of transmissible P. aeruginosa Liverpool Epidemic Strain in chronic infections of nine patients with cystic fibrosis, and infer evolutionary processes associated with adaptation to the cystic fibrosis lung.

Methods: We performed whole-genome sequencing of P. aeruginosa isolates and pooled populations and used comparative analyses of genome sequences including phylogenetic reconstructions and resolution of population structure from genome-wide allele frequencies.

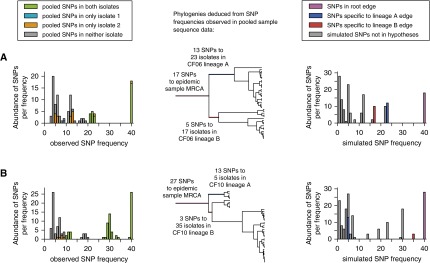
Measurements and main results: Genome sequences were obtained for 360 isolates from nine patients. Phylogenetic reconstruction of the ancestry of 40 individually sequenced isolates from one patient sputum sample revealed the coexistence of two genetically diverged, recombining lineages exchanging potentially adaptive mutations. Analysis of population samples for eight additional patients indicated coexisting lineages in six cases. Reconstruction of the ancestry of individually sequenced isolates from all patients indicated smaller genetic distances between than within patients in most cases.

Conclusions: Our population-level analysis demonstrates that coexistence of distinct lineages of P. aeruginosa Liverpool Epidemic Strain within individuals is common. In several cases, coexisting lineages may have been present in the infecting inoculum or assembled through multiple transmissions. Divergent lineages can share mutations via homologous recombination, potentially aiding adaptation to the airway during chronic infection. The genetic diversity of this transmissible strain within infections, revealed by high-resolution genomics, has implications for patient segregation and therapeutic strategies.

Keywords: bacteria; genomics; homologous recombination; population genetics.


Figures

Figure 1.
Figure 1.
Pseudomonas aeruginosa Liverpool Epidemic Strain population structure in cystic fibrosis sputum sample CF03 consists of two divergent, recombining lineages. Rooted neighbor-joining (BIONJ) phylogenetic reconstruction of 40 isolate genome sequences obtained from a single cystic fibrosis sputum sample (CF03, collected 2009) calculated from a distance matrix of single-nucleotide polymorphism (SNP) counts. SNPs among whole-genome sequence short reads mapped to the P. aeruginosa LESB58 reference genome sequence (collected 1988), which also serves as an outgroup for rooting. The three support values for each edge are the percent split frequency among a nonparametric bootstrap replicate sample of BIONJ and maximum-likelihood phylogenies and among a Bayesian sample of phylogenies. Only edges with at least 80% support by all three measures are labeled with the respective split frequencies. The isolate sequences sharing homoplasies are indicated with circles in the right-most columns, which correspond to circled variants in Figure 2; the column numbers relate to row numbers in Table 1.
Figure 2.
Figure 2.
Chromosome positions and predicted effects of mutations within and between CF03 lineages A and B. Genome map of mutations in 40 isolate genome sequences (outer lanes) obtained from a single sputum sample (CF03, collected 2009). Lanes are ordered by phylogenetic relationships in the neighbor-joining phylogeny from Figure 1, adapted and plotted at the lower left, and rooted using the LESB58 reference genome (collected 1988) as outgroup. The outer 13 lanes correspond to CF03 lineage A and the 27 lanes inward to CF03 lineage B. The next, wider, lane corresponds to the LESB58 reference genome sequence with prophage (light brown) and genomic island (dark green) regions indicated at their positions relative to the origin of replication indicated by the outer scale. The innermost lane is a plot of percent guanine-cytosine (GC) in 5-kbp regions calculated every 2.5 kbp and filled red above and below 50% GC. For each isolate genome sequence, the mutations identified from sequenced reads aligned to the reference sequence were classified as single-nucleotide polymorphisms (SNP), small insertions, or small deletions. Those that occurred in protein-coding regions are further classified by the predicted effects on transcription to mRNA and translation to protein sequences. Mutation classes are plotted on the genome map in different colors indicated in the key. Regions in which no reads mapped to the reference chromosome for an isolate sample are indicated by gaps in the corresponding lane. Homoplasies are circled and correspond to those described in Figure 1 and Table 1. ORF = open reading frame.
Figure 3.
Figure 3.
Simulation of sequence evolution is useful for corroboration of phylogenetic hypotheses deduced from single-nucleotide polymorphism (SNP) frequency distributions. (Left) Histogram of observed SNP frequencies among individual genome sequences of 40 isolates in two divergent lineages. (Center) Neighbor-joining (BIONJ) phylogenetic reconstruction of the 40 isolates adapted from Figure 1. (Right) Histogram of SNP frequencies among sequences simulated along the phylogeny in the center. The phylogeny is rooted using the inferred most recent common ancestor (MRCA) of all isolates in this study as an outgroup. Edge highlight colors correspond to histogram peak colors (solid) according to the SNPs represented: frequency of peak (position on x-axis) corresponds to edge length, whereas area of peak (abundance) corresponds to the number of tips descendant from the edge. The simulation accurately reproduces the SNP frequency distribution (right) observed in the sequence data (left) and is thus useful to corroborate phylogenetic hypotheses deduced from SNP frequencies among isolates (see Figure 4). The red and blue hatched peaks in the histograms represent diversity within, not between, each of the two deepest lineages (A and B) and are not relevant to a hypothesis of two divergent, coexisting lineages.
Figure 4.
Figure 4.
Pseudomonas aeruginosa Liverpool Epidemic Strain populations in six of eight other sputum samples from a patient with cystic fibrosis (CF) consist of two divergent lineages. A further eight patients provided a sputum sample from each of which genomic DNA of 40 isolates was sequenced in equimolar pools. Single-nucleotide polymorphism (SNP) analysis revealed that six samples consisted of two divergent lineages shown in A–F (CF01, CF04, CF05, CF07, CF08, and CF09). (Left) Histograms of SNP frequency distributions observed among pooled genome sequences of 40 isolates. (Center) Hypotheses of root edge and lineage edges plotted as phylogenies deduced from the observed SNP frequency distributions. Only the root and lineage edges are relevant to the hypothesis of two divergent lineages. (Right) Histogram of SNP frequencies among sequences simulated along each phylogeny, recapitulating observed SNP peaks corresponding to the root and deepest edges (indicated by purple, red, and blue). For each sample two isolates were sequenced separately, the observed SNP frequencies for which are indicated among the 40 in each pool with green, turquoise, and orange (left). Edges within clades of lineages are not relevant to the hypotheses. The SNP mutations in the root edges are shared and derived in all descendants (i.e., fixed in the population), and thus appear at the maximum frequency of 40: both the root edge and corresponding peak in the simulated SNP frequency histograms (right) are colored purple. The red and blue peaks in the simulation histograms correspond to the lineage edges arising from the patient’s most recent common ancestor (MRCA) at the deepest bifurcation and should be at frequencies that sum to the total isolates (40). In all of these samples the deepest pair of lineages were considered divergent because they had more mutations since their MRCA (red and blue peaks) than their MRCA had to that of all samples in the study (the outgroup; peak at frequency 40, purple on the right). Except for CF04 (B), the pairs of isolates were representatives of each divergent lineage so that the highest-frequency peak in the distribution of observed SNPs exclusive to each isolate (orange or turquoise) corresponds to one of the lineage peaks in the distribution of simulated SNPs (red or blue).
Figure 5.
Figure 5.
Pseudomonas aeruginosa Liverpool Epidemic Strain populations in two of eight other sputum samples from patients with cystic fibrosis (CF) consist of a single lineage. The sampling approach, analysis, and plotting is as described for Figure 4. For these two samples (CF06 and CF10) the deepest pair of lineages were not considered divergent because both had fewer mutations since their most recent common ancestor (MRCA; red and blue edges and peaks) than their MRCA had to that of all samples in the study (purple peak edges and peaks): the purple peak was larger than the red and blue peaks. SNP = single-nucleotide polymorphism.
Figure 6.
Figure 6.
Complex patterns of Pseudomonas aeruginosa Liverpool Epidemic Strain transmission among chronically infected patients with cystic fibrosis (CF). Neighbor-joining (BIONJ) phylogenetic reconstruction of 40 P. aeruginosa isolate genome sequences from a patient CF03 sputum sample and two P. aeruginosa isolate genome sequences from eight other patient sputum samples, all collected in 2009. The distance matrix consisted of raw counts of shared single-nucleotide polymorphisms (SNP). Mutations are relative to the P. aeruginosa LESB58 genome, collected in 1988, which also serves as an outgroup for rooting. Support for each edge is as described in Figure 1. The 13 sequences representing CF03 lineage A and the 27 sequences representing CF03 lineage B each form a monophyletic clade and are represented as blue and red triangles, respectively. The edges to CF05 isolate 2 and CF09 isolate 2 are not to scale because they represent many more mutations than other edges. Patient sample isolates CF03, CF05, and CF07–9 are paraphyletic, consistent with some patient infections being from diverse inocula and/or acquisitions of multiple lineages.

Comment in

References

    1. Driscoll JA, Brody SL, Kollef MH. The epidemiology, pathogenesis and treatment of Pseudomonas aeruginosa infections. Drugs. 2007;67:351–368. - PubMed
    1. Murray TS, Egan M, Kazmierczak BI. Pseudomonas aeruginosa chronic colonization in cystic fibrosis patients. Curr Opin Pediatr. 2007;19:83–88. - PubMed
    1. Govan JR, Deretic V. Microbial pathogenesis in cystic fibrosis: mucoid Pseudomonas aeruginosa and Burkholderia cepacia. Microbiol Rev. 1996;60:539–574. - PMC - PubMed
    1. Hoffman LR, Richardson AR, Houston LS, Kulasekara HD, Martens-Habbena W, Klausen M, Burns JL, Stahl DA, Hassett DJ, Fang FC, et al. Nutrient availability as a mechanism for selection of antibiotic tolerant Pseudomonas aeruginosa within the CF airway. PLoS Pathog. 2010;6:e1000712. - PMC - PubMed
    1. Goodman AL, Kulasekara B, Rietsch A, Boyd D, Smith RS, Lory S. A signaling network reciprocally regulates genes associated with acute infection and chronic persistence in Pseudomonas aeruginosa. Dev Cell. 2004;7:745–754. - PubMed

Publication types

MeSH terms