

Drug modulation of water-heme interactions in low-spin P450 complexes of CYP2C9d and CYP125A1
- PMID: 25591012
- PMCID: PMC4437715
- DOI: 10.1021/bi501402k
Drug modulation of water-heme interactions in low-spin P450 complexes of CYP2C9d and CYP125A1
Abstract
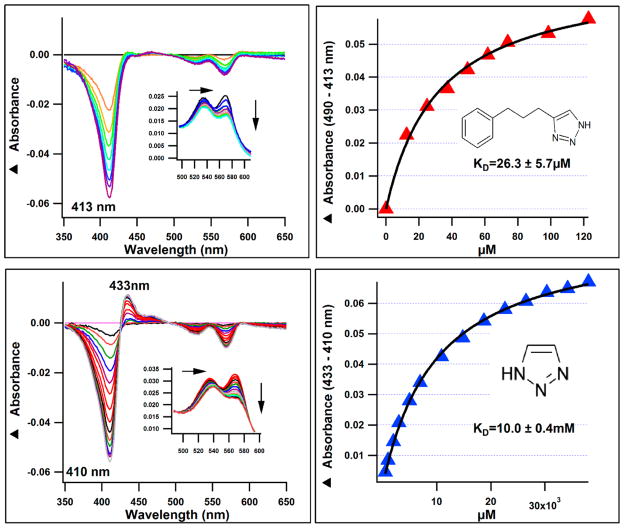
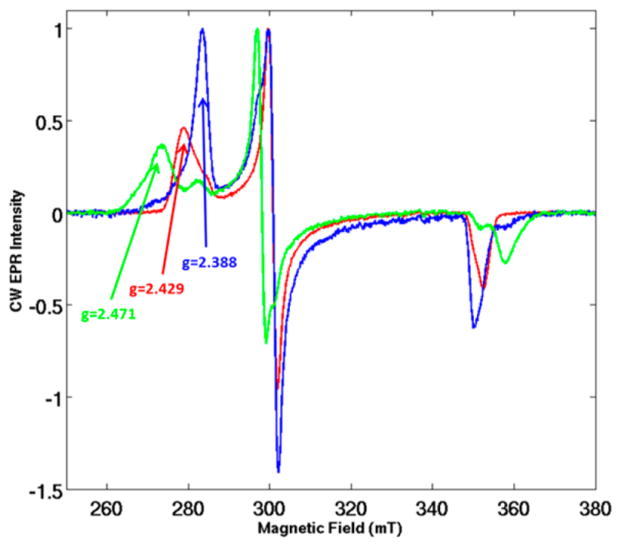
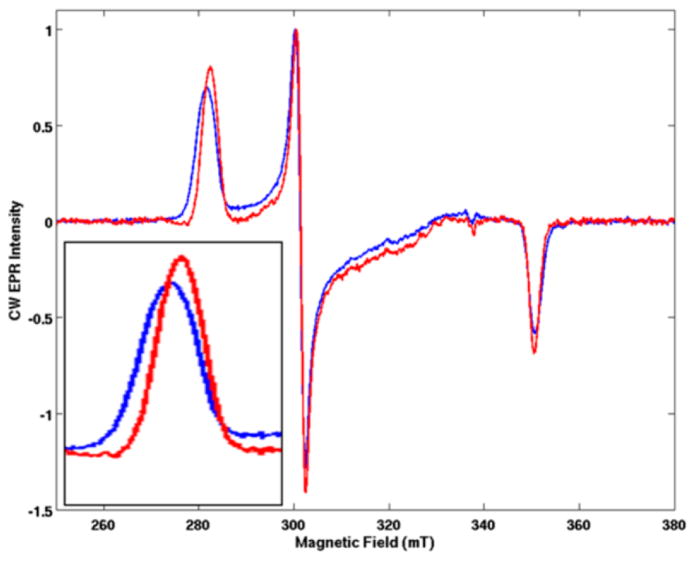
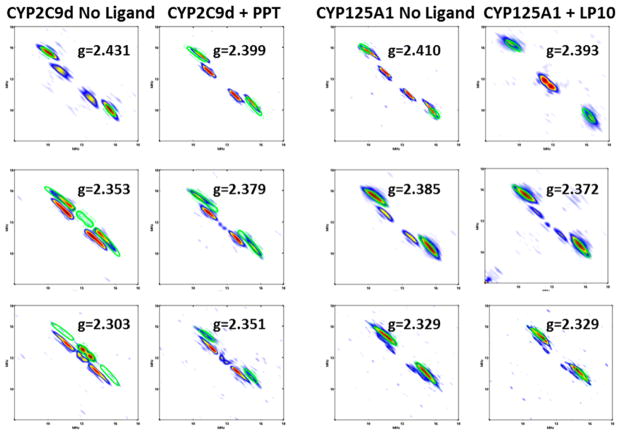
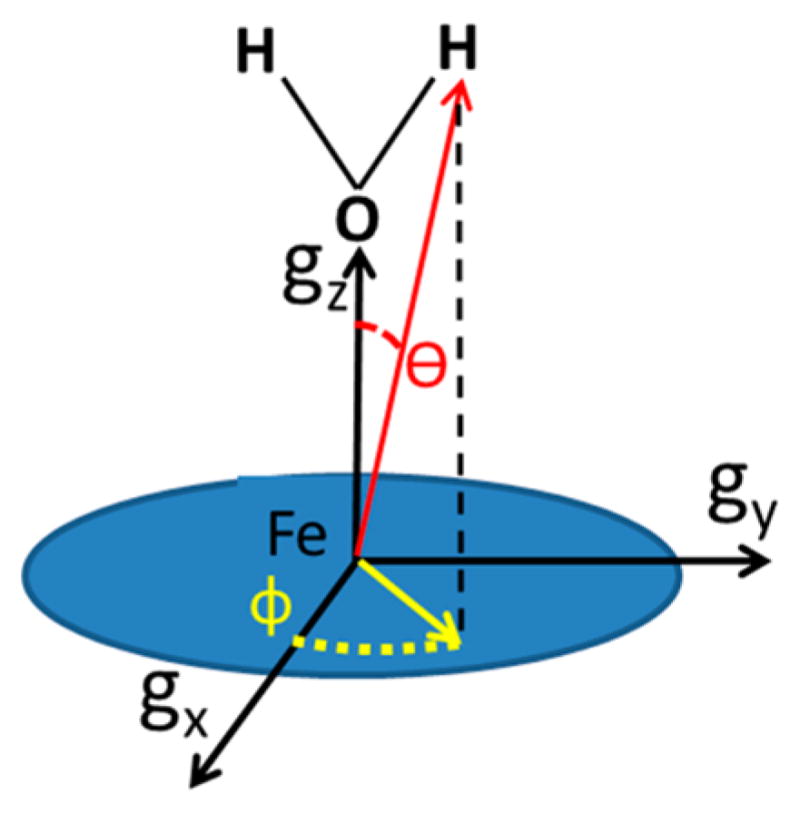
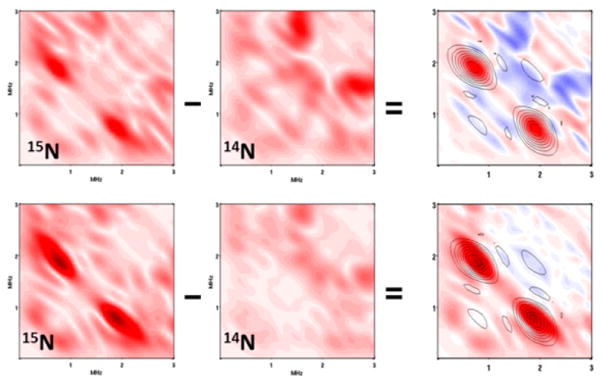
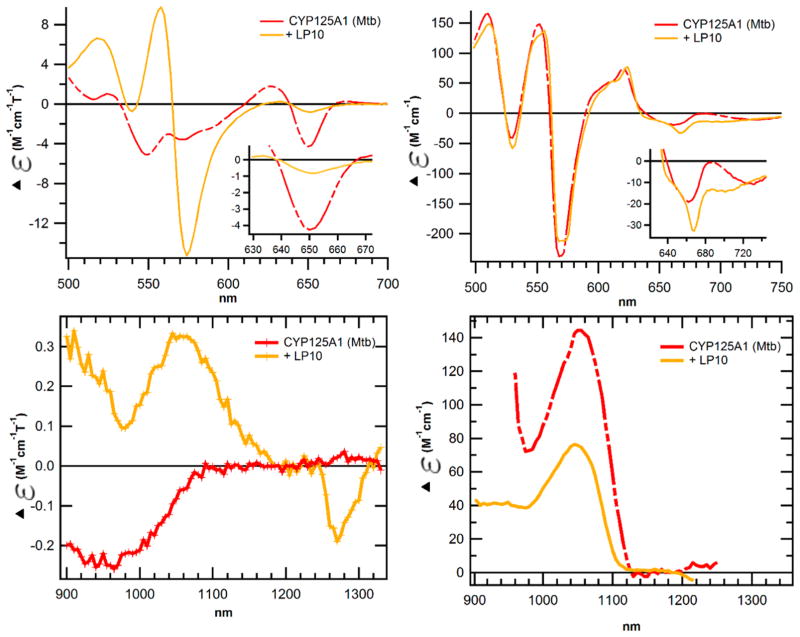
Azoles and pyridines are commonly incorporated into small molecule inhibitor scaffolds that target cytochromes P450 (CYPs) as a strategy to increase drug binding affinity, impart isoform-dependent selectivity, and improve metabolic stability. Optical absorbance spectra of the CYP-inhibitor complex are widely used to infer whether these inhibitors are ligated directly to the heme iron as catalytically inert, low-spin (type II) complexes. Here, we show that the low-spin complex between a drug-metabolizing CYP2C9 variant and 4-(3-phenylpropyl)-1H-1,2,3-triazole (PPT) retains an axial water ligand despite exhibiting elements of "classic" type II optical behavior. Hydrogens of the axial water ligand are observed by pulsed electron paramagnetic resonance (EPR) spectroscopy for both inhibitor-free and inhibitor-bound species and show that inhibitor binding does not displace the axial water. A (15)N label incorporated into PPT is 0.444 nm from the heme iron, showing that PPT is also in the active site. The reverse type I inhibitor, LP10, of CYP125A1 from Mycobacterium tuberculosis, known from X-ray crystal structures to form a low-spin water-bridged complex, is found by EPR and by visible and near-infrared magnetic circular dichroism spectroscopy to retain the axial water ligand in the complex in solution.
Conflict of interest statement
The authors declare no competing financial interest.
Figures
References
-
- Poulos TL, Howard AJ. Crystal Structures of Metyrapone- and Phenylimidazole-Inhibited Complexes of Cytochrome P-450cam. Biochemistry. 1987;26:8165–8174. - PubMed
-
- Podust LM, von Kries JP, Eddine AN, Kim Y, Yermalitskaya LV, Kuehne R, Ouellet H, Warrier T, Altekoster M, Lee JS, Rademann J, Oschkinat H, Kaufmann SHE, Waterman MR. Small-Molecule Scaffolds for CYP51 Inhibitors Identified by High-Throughput Screening and Defined by X-ray Crystallography. Antimicrob Agents Chemother. 2007;51:3915–3923. - PMC - PubMed
-
- Schenkman JB, Cinti DL, Orrenius S, Moldeus P, Kraschnitz R. Nature of Reverse Type I (Modified Type II) Spectral Change in Liver Microsomes. Biochemistry. 1972;11:4243–4251. - PubMed
Publication types
MeSH terms
Substances
Grants and funding
LinkOut - more resources
Full Text Sources
Other Literature Sources
