. 2015 Aug;22(8):1328-40.
doi: 10.1038/cdd.2014.221. Epub 2015 Jan 16.

Reactivation of epigenetically silenced miR-512 and miR-373 sensitizes lung cancer cells to cisplatin and restricts tumor growth

Affiliations

Reactivation of epigenetically silenced miR-512 and miR-373 sensitizes lung cancer cells to cisplatin and restricts tumor growth

S Adi Harel et al. Cell Death Differ. 2015 Aug.

Abstract

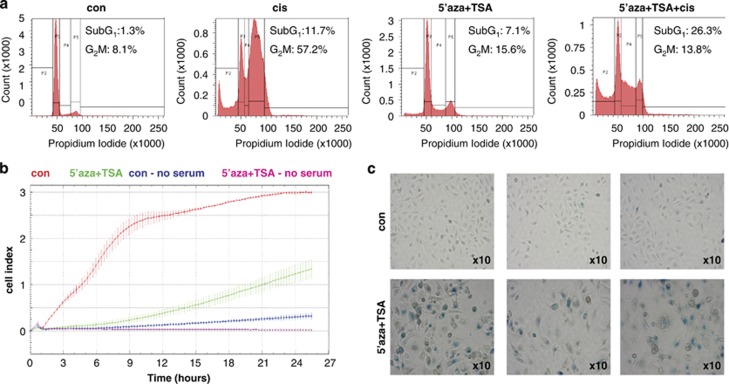
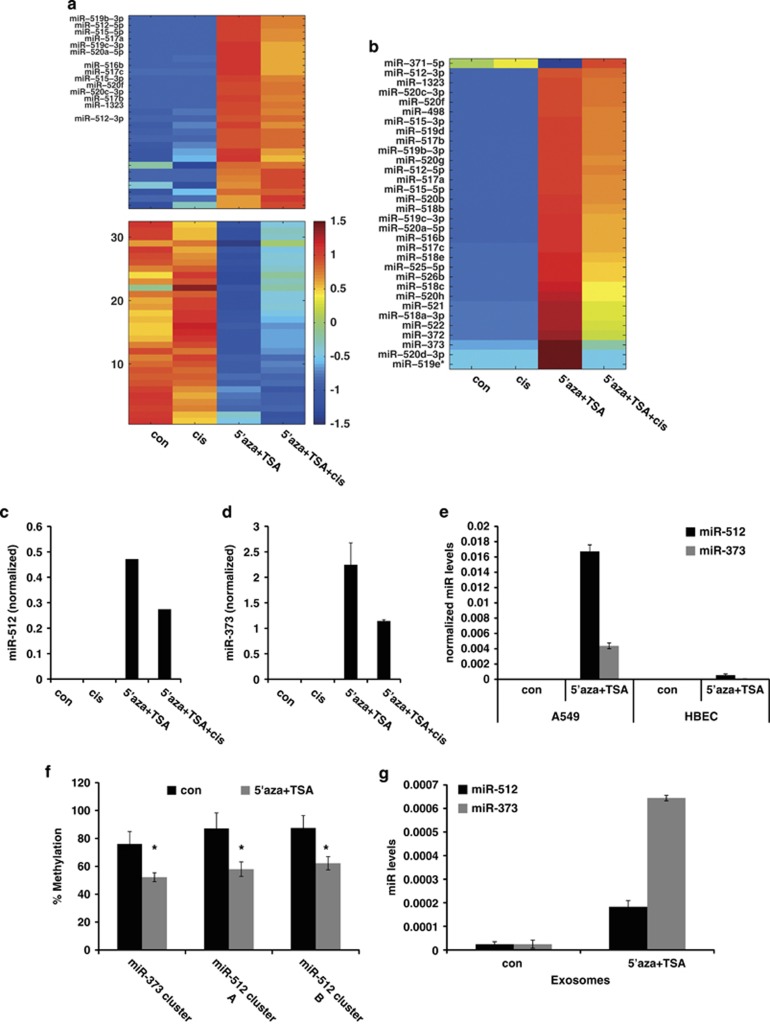
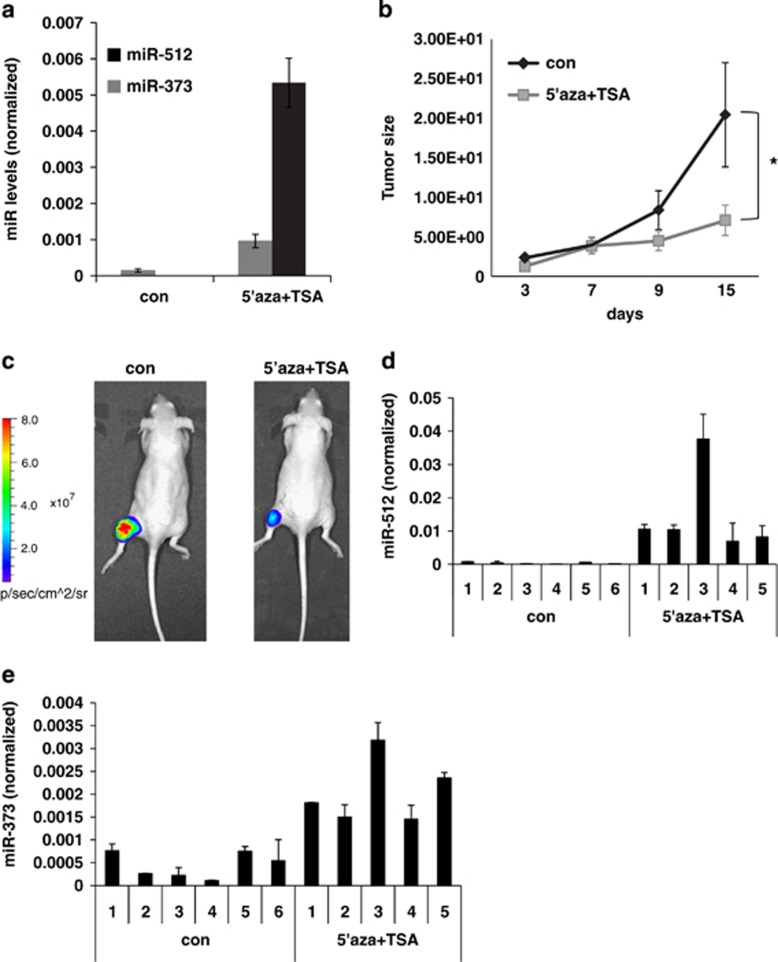
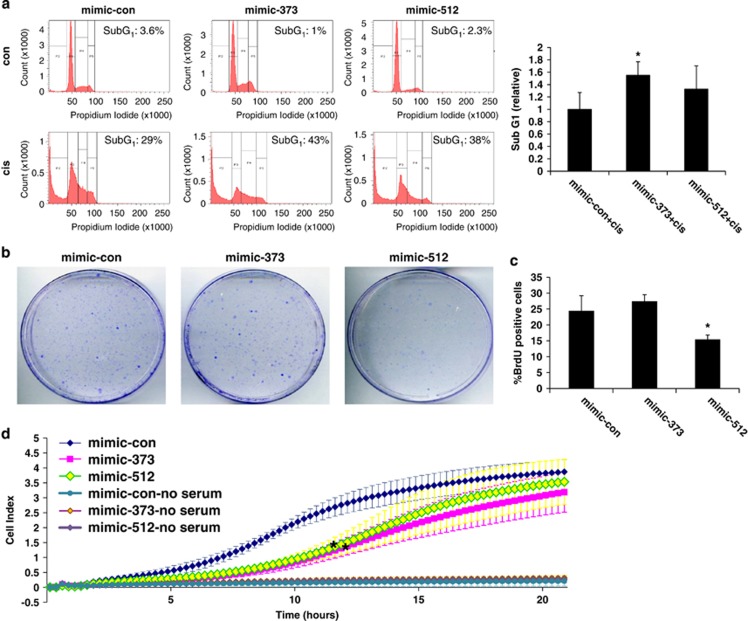
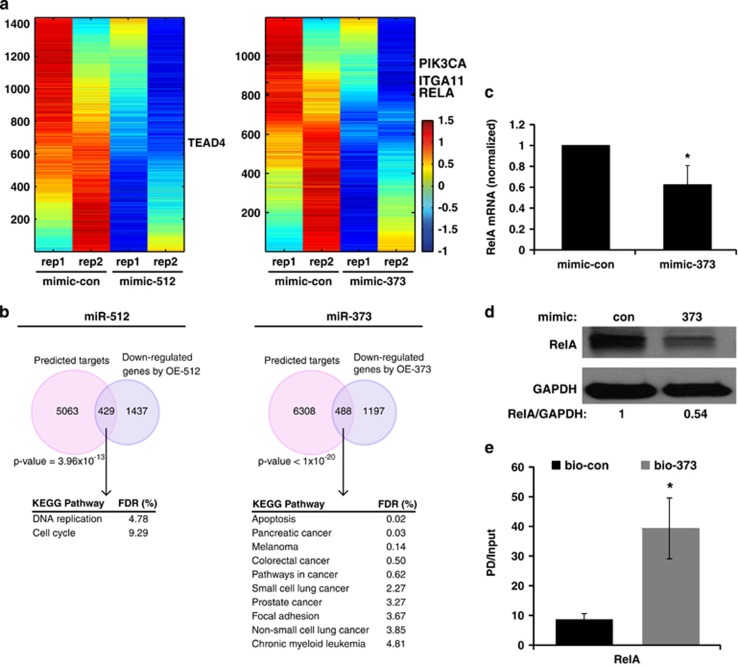
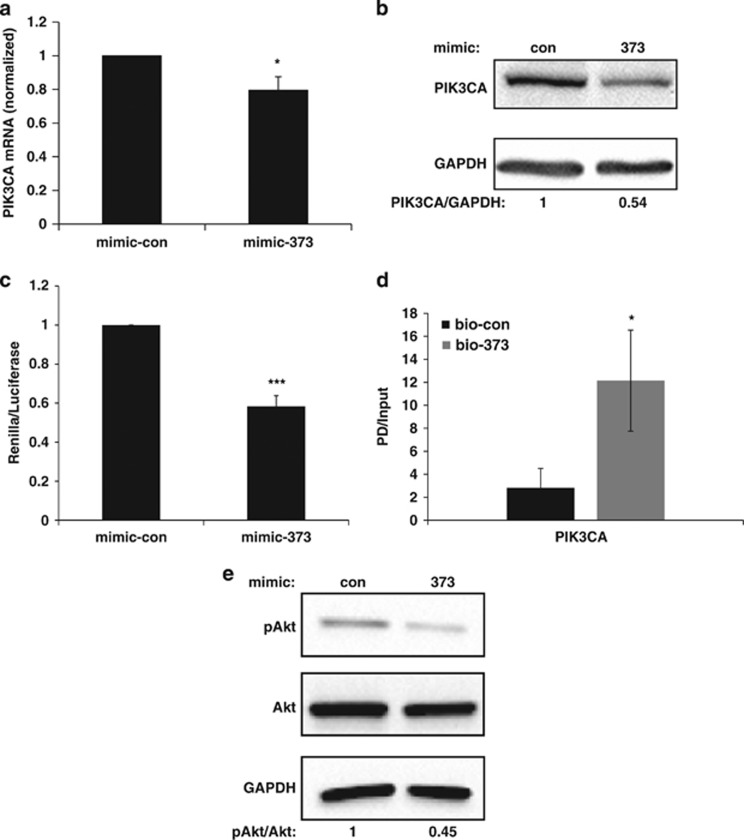
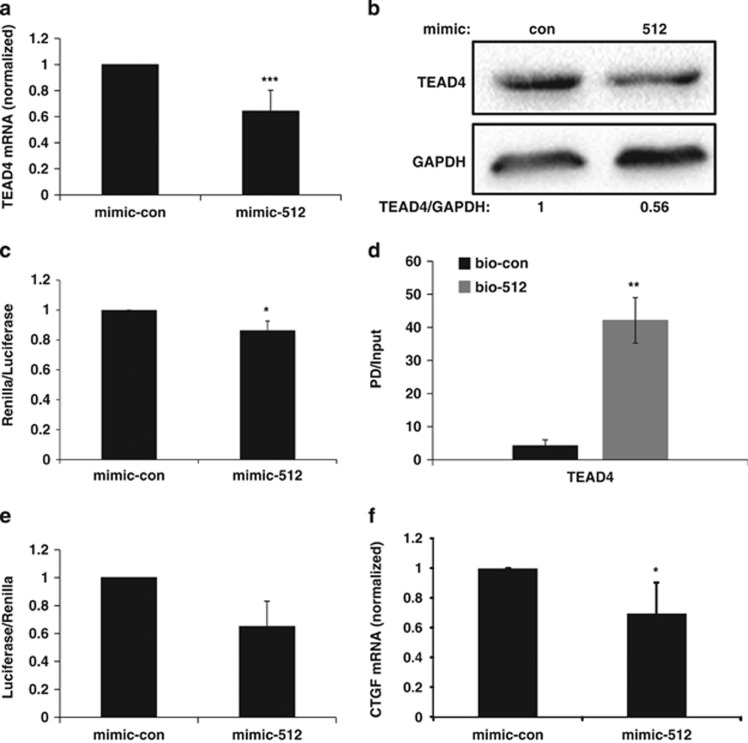
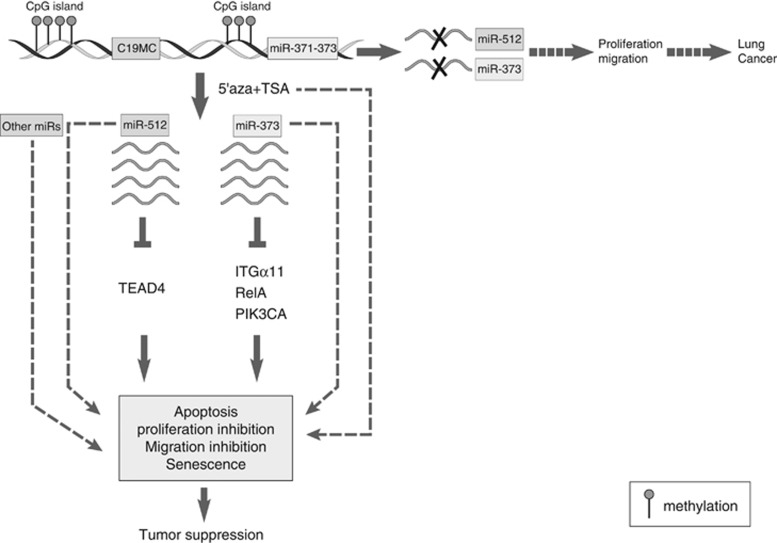
MicroRNAs (miRs) regulate a variety of cellular processes, and their impaired expression is involved in cancer. Silencing of tumor-suppressive miRs in cancer can occur through epigenetic modifications, including DNA methylation and histone deacetylation. We performed comparative miR profiling on cultured lung cancer cells before and after treatment with 5'aza-deoxycytidine plus Trichostatin A to reverse DNA methylation and histone deacetylation, respectively. Several tens of miRs were strongly induced by such 'epigenetic therapy'. Two representatives, miR-512-5p (miR-512) and miR-373, were selected for further analysis. Both miRs were secreted in exosomes. Re-expression of both miRs augmented cisplatin-induced apoptosis and inhibited cell migration; miR-512 also reduced cell proliferation. TEAD4 mRNA was confirmed as a direct target of miR-512; likewise, miR-373 was found to target RelA and PIK3CA mRNA directly. Our results imply that miR-512 and miR-373 exert cell-autonomous and non-autonomous tumor-suppressive effects in lung cancer cells, where their re-expression may benefit epigenetic cancer therapy.


Figures

Figure 1
Figure 1
5′aza+TSA treatment of A549 cells promotes apoptosis and senescence and inhibits migration. (a) A549 lung cancer cells were treated with a combination of 1 μM 5′aza+0.1 μM TSA for 72 h. Next, 40 ng/ml cisplatin (cis) was added for an additional 48 h and cells were subjected to cell cycle analysis by flow cytometry, n=3. (b) A549 cells were subjected to three 96-h cycles of 5′aza+TSA or acetic acid as control. Cycles were separated by 48 h of cultivation in regular medium. At the end of the treatment, cells were seeded in transwells and migration was measured every 15 min in a Real Time Cell Analyzer (see Materials and Methods). Bars represent mean±S.D. of duplicates in the same experiment, n=2. (c) Representative images of β-gal staining. A549 cells were treated as in (b) and then subjected to β-gal staining
Figure 2
Figure 2
miR microarray analysis and validation. (a) Sorting points into neighborhood (Spin)-ordered expression matrix of the most variable miRs across samples, either up- (29) or downregulated (32) in response to 5′aza+TSA treatment; treatment as in (Figure 1a). The 14 miRs identified by name belong to the ch19 cluster and appear also in Figure 2b. Colors indicate expression levels after centering and normalizing each miR (row), with red denoting relatively high expression and blue relatively low expression (see color bar). (b) Spin-ordered expression matrix of 32 miRs of the ch19 clusters measured by the array, across the different samples. Color bar as in (a). (c) qRT-PCR analysis of miR-512, normalized to RNU24. Bars represent mean±S.D. from duplicate qPCR reactions; similar results were obtained in three independent experiments. (d) qRT-PCR analysis of miR-373, normalized to RNU24. Bars represent mean±S.D. from duplicate qPCR reactions; similar results were obtained in three independent experiments. (e) A549 and HBECs were treated with 5′aza+TSA for 72 h and subjected to qRT-PCR analysis. Levels of miR-512 and miR-373 were normalized to RNU24. Bars represent mean±S.D. from duplicate qPCR reactions. (f) Percentage of methylated CpGs as calculated by bisulfite pyrosequencing. Bars represent mean±S.D. from three independent experiments. *P-value <0.05. (g) A549 cells were treated with 5′aza+TSA as before. At the end of the treatment, medium was replaced to serum-free medium for 24 h, at which time it was collected and subjected to exosome RNA isolation and qRT-PCR analysis for miR-512 and miR-373. Bars represent mean±S.D. from duplicate qPCR reactions; similar results were obtained in two independent experiments
Figure 3
Figure 3
5′aza+TSA treatment attenuates tumor growth and induces sustained expression of miR-512 and miR-373. (a) H460 cells stably expressing luciferase were treated with 5′aza+TSA or acetic acid:H2O (solvent control) for 72 h and subjected to qRT-PCR analysis. miR-373 and miR-512 were normalized to RNU24. Bars represent mean±S.D. from duplicate qPCR reactions. (b) Cells as in (a) were injected subcutaneously into nude mice. For each time point, the fold change in luciferase bioluminescence intensity of each mouse was calculated relative to the 24 h luciferase signal of the same mouse. The average tumor load of all mice in the same group (n=6 for control, n=5 for 5′aza+TSA) was calculated for each time point and plotted. *P-value<0.05 at day 15. (c) Representative color-coded luciferase bioluminescence images acquired 15 days after inoculation. (d) qRT-PCR analysis of miR-512 in tumors excised at day 16. Levels are normalized to RNU24. Bars represent mean±S.D. from duplicate qPCR reactions. (e) qRT-PCR analysis of miR-373 in tumors excised at day 16. Levels are normalized to RNU24. Bars represent mean±S.D. from duplicate qPCR reactions
Figure 4
Figure 4
Biological outcomes of miR-373 and miR-512 overexpression in A549 cells. (a) Left: Flow cytometry cell cycle analysis of A549 cells transfected with miR-con, miR-373 mimic or miR-512 mimic oligos and treated with cisplatin for 48 h. Right: Relative sub-G1 fraction following the indicated treatments. The control sample was set as 1. Bars represent mean±S.D. of three independent experiments, *P-value <0.05. (b) A colony-formation assay was performed with A549 cells transfected with miR-con, miR-373 mimic or miR-512 mimic oligos. Three weeks after plating, colonies were fixed with methanol and stained with crystal violet, n=3. (c) Cells were transfected as in (b), and subjected 48 h later to flow cytometry BrdU incorporation analysis; bars represent mean±S.D. of three independent experiments, *P-value <0.05. (d) A549 cells transfected with miR-con, miR-373 mimic or miR-512 mimic oligos were seeded in transwells. Migration was monitored every 15 min in a Real Time Cell Analyzer. Bars represent mean±S.D. of three independent experiments, *P-value <0.05 (for miR-373 between 1.9 and 20.4 h, for miR-512 between 1.6 and 15.6 h)
Figure 5
Figure 5
Identification of miR-512 and miR-373 targets. (a) A549 cells were transfected with miR-con, miR-373 or miR-512 mimic oligos in duplicates and subjected to RNA purification and Affymetrix gene expression profiling. Spin-ordered expression matrix for genes downregulated at least 1.2-fold by overexpression of miR-373 mimic (right) or miR-512 mimic (left) oligos, relative to control miR-mimic, n=2. Colors indicate expression levels after centering and normalizing each miR (row), with red denoting relatively high expression and blue relatively low expression (see color bar). (b) Analysis of expression data in (a). Upper panel: Venn diagrams showing the number of target genes predicted by PITA, TargetScan or miRanda sequence-based algorithms, downregulated at least 1.2-fold in both repeats in response to transfection with miR-512 mimic (right) or miR-373 mimic (left). Lower panel: pathways enriched among the downregulated predicted target genes of miR-512 and miR-373. (c) qRT-PCR analysis of RelA mRNA in A549 cells transfected with miR-con or miR-373 mimic oligos. Values were first normalized to GAPDH mRNA in the same sample and then calculated relative to the mimic-con value, set as 1. Bars represent mean±S.D. from four independent experiments, *P-value<0.05. (d) Cells treated as in (c) were subjected to western blot analysis of RelA and GAPDH proteins, n=3. (e) A549 cells were transfected with 100 nM biotinylated miR-373 (bio-373) or biotinylated miR-con (bio-con) and harvested 48 h later for pulldown analysis (see Materials and Methods). Pulled-down (PD) mRNA levels were normalized to GAPDH mRNA in the same sample and to input mRNA. Bars represent mean±S.E. of four independent experiments, *P-value<0.05
Figure 6
Figure 6
PIK3CA is a direct functional target of miR-373. (a) qRT-PCR analysis of PIK3CA mRNA in A549 cells transfected with miR-con or miR-373 mimic oligos. Analysis as in Figure 5c. Bars represent mean±S.D. from three independent experiments, *P-value<0.05. (b) Cells were treated as in (a) and subjected to western blot analysis of PIK3CA and GAPDH proteins, n=3.(c) A549 cells were transfected with miR-con or miR-373 mimic oligos, and 24 h later transfected again with psiCHECK2 plasmid containing the 3′UTR of PIK3CA downstream to the Renilla luciferase reporter gene. After an additional 24 h, cells were lysed and Renilla luciferase activity was measured and normalized to firefly luciferase activity. Bars represent mean±S.E. of three independent experiments, ***P-value<0.0005. (d) miR-373 pulldown. Experimental procedure as in Figure 5e. Bars represent mean±S.E. of five independent experiments, *P-value<0.05. (e) A549 cells were transfected with miR-con or miR-373 mimic oligos and subjected to serum starvation for 20 h, followed by treatment with 10 ng/ml insulin for 10 min. Cells were harvested and subjected to western blot analysis of total Akt1, phosphorylated Akt (pAkt) and GAPDH, n=2
Figure 7
Figure 7
TEAD4 is a direct functional target of miR-512. (a) qRT-PCR analysis for TEAD4 mRNA levels in A549 cells transfected with miR-con or miR-512 mimic oligons. Analysis as in Figure 5c. Bars represent mean±S.D. from six independent experiments, ***P-value<0.0005. (b) Cells transfected as in (a) were subjected to western blot analysis of TEAD4 and GAPDH proteins. (c) A549 cells were transfected with miR-con or miR-512 mimic oligos, and 24 h later transfected again with psiCHECK2 plasmid containing the 3′UTR of TEAD4 downstream to the Renilla luciferase reporter gene. After an additional 24 h, cells were lysed and Renilla luciferase activity was measured and normalized to firefly luciferase activity. Bars represent mean±S.E. of three independent experiments, *P-value<0.05. (d) A549 cells were transfected with 100 nM biotinylated miR-512 (bio-512) or biotinylated miR-con (bio-con) and harvested 48 h later for pulldown analysis. Analysis as in Figure 5e. Bars represent mean±S.E. of four independent experiments, **P-value<0.005. (e) A549 cells were transfected with miR-con or miR-512 mimic oligos, and 24 h later transfected again with PGL3 8xGTІІC and Renilla reporter plasmids. After an additional 24 h, cells were lysed and firefly luciferase activity was measured and normalized to Renilla luciferase activity. Bars represent mean±S.E. of five independent experiments. (f) qRT-PCR analysis of CTGF mRNA in A549 cells transfected with control or miR-512 mimic oligos. Analysis as in Figure 5c. Bars represent mean±S.E. from six independent experiments. *P-value<0.05
Figure 8
Figure 8
Schematic representation of the regulatory process proposed in the study. In lung cancer cells, the CpG islands in the vicinity of C19MC (including miR-512) and the miR-371-373 cluster (including miR-373) are highly methylated leading to reduced expression of those miRs and contributing to enhanced proliferation and migration. Treatment with 5′aza+TSA reduces CpG island methylation, causing re-expression of the silenced miRs. This leads to induction of apoptosis and inhibition of proliferation and cell migration, and may thereby suppress tumor malignancy. These biological outcomes are partially mediated by inhibition of ITGα11, RelA and PIK3CA by miR-373, and of TEAD4 by miR-512

Similar articles

Cited by

References

    1. Katayama R, Shaw AT, Khan TM, Mino-Kenudson M, Solomon BJ, Halmos B, et al. Mechanisms of acquired crizotinib resistance in ALK-rearranged lung Cancers. Sci Transl Med. 2012;4:120ra17. - PMC - PubMed
    1. Liu HP, Isaac WuHD, Chang JW, Wu YC, Yang HY, Chen YT, et al. Prognostic implications of epidermal growth factor receptor and KRAS gene mutations and epidermal growth factor receptor gene copy numbers in patients with surgically resectable non-small cell lung cancer in Taiwan. J Thorac Oncol. 2010;5:1175–1184. - PubMed
    1. Baylin SB, Jones PA. A decade of exploring the cancer epigenome—biological and translational implications. Nat Rev Cancer. 2011;11:726–734. - PMC - PubMed
    1. Bergman Y, Cedar H. DNA methylation dynamics in health and disease. Nat Struct Mol Biol. 2013;20:274–281. - PubMed
    1. Aran D, Hellman A. DNA methylation of transcriptional enhancers and cancer predisposition. Cell. 2013;154:11–13. - PubMed

Publication types

MeSH terms