. 2015 Jan 16;47(1):e129.
doi: 10.1038/emm.2014.98.

BAFF knockout improves systemic inflammation via regulating adipose tissue distribution in high-fat diet-induced obesity

Affiliations

BAFF knockout improves systemic inflammation via regulating adipose tissue distribution in high-fat diet-induced obesity

Do-Hwan Kim et al. Exp Mol Med. .

Abstract

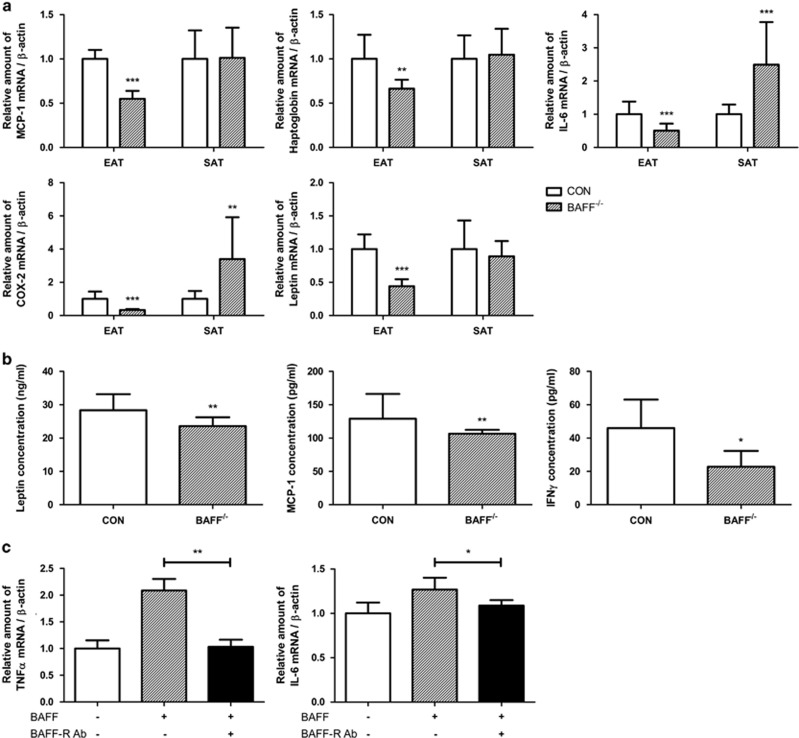
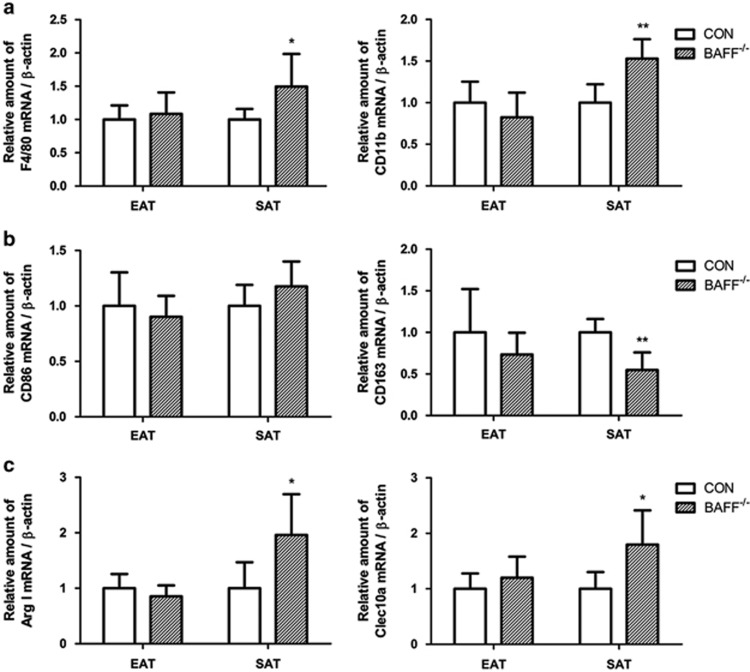
Obesity is recognized as a chronic low-grade inflammatory state due to adipose tissue expansion being accompanied by an increase in the production of proinflammatory adipokines. Our group is the first to report that B-cell-activating factor (BAFF) is produced from adipocytes and functions as a proinflammatory adipokine. Here, we investigated how loss of BAFF influenced diet-induced obesity in mice by challenging BAFF(-/-) mice with a high-fat diet for 10 weeks. The results demonstrated that weight gain in BAFF(-/-) mice was >30% than in control mice, with a specific increase in the fat mass of the subcutaneous region rather than the abdominal region. Expression of lipogenic genes was examined by quantitative real-time PCR, and increased lipogenesis was observed in the subcutaneous adipose tissue (SAT), whereas lipogenesis in the epididymal adipose tissue (EAT) was reduced. A significant decrease in EAT mass resulted in the downregulation of inflammatory gene expression in EAT, and more importantly, overall levels of inflammatory cytokines in the circulation were reduced in obese BAFF(-/-) mice. We also observed that the macrophages recruited in the enlarged SAT were predominantly M2 macrophages. 3T3-L1 adipocytes were cultured with adipose tissue conditioned media (ATCM), demonstrating that EAT ATCM from BAFF(-/-) mice contains antilipogenic and anti-inflammatory properties. Taken together, BAFF(-/-) improved systemic inflammation by redistributing adipose tissue into subcutaneous regions. Understanding the mechanisms by which BAFF regulates obesity in a tissue-specific manner would provide therapeutic opportunities to target obesity-related chronic diseases.


Figures

Figure 1
Figure 1
Animal model. Seven-week-old male C57BL/6J mice (n=21 per group) were fed a high-fat diet (HFD) (60% fat) for 10 weeks to induce obesity. Body weight and food consumption were monitored once per week. (a) Body weight gain in control/BAFF−/− mice showed a significant difference. (b) Relative weight gain in control/BAFF−/− mice after 10 weeks of HFD feeding expressed as a percent change from initial weight. (c) Food intake in grams. (d) Relative organ weight in grams: (organ weight/body weight) × 100%. Mean values with letters are significantly different (*P<0.05, **P<0.01 and ***P<0.001) by Student's t-test. BAFF, B-cell-activating factor; CON, control; EAT, epididymal adipose tissue; SAT, subcutaneous adipose tissue; VAT, visceral adipose tissue.
Figure 2
Figure 2
Change in lipogenic enzymes in fat tissue. (a) Analysis of fatty acid synthase (FAS), acetyl-CoA carboxylase (ACC), perilipin, carnitine palmitoyl acyltransferase-1 (CPT-1) and adiponectin mRNA expression in epididymal adipose tissue (EAT) and subcutaneous adipose tissue (SAT) from high-fat diet (HFD)-induced obese mice. The data are presented as x-fold expression of control mice (n=21 mice per group; genes were analyzed separately). Black columns and symbols represent BAFF−/− mice; white: control. (b) WAT morphology was determined by hematoxylin and eosin (H&E) staining of slides of paraffin-embedded EAT and SAT ( × 200, × 400 × ). (c) At day 8 after inducing differentiation, adipocytes were cultured in a 35-mm dish with 10 ng ml−1 BAFF and the addition of 200 ng ml−1 BAFF-R antibody (n=8). As a control, cells were cultured in the same condition but without BAFF and BAFF-R antibody treatment. The graph represents mRNA expression of peroxisome proliferator-activated receptor γ (PPARγ), PPARγ coactivator 1α (PGC1α), acetyl-CoA synthetase (ACS), diglyceride acyltransferase (DGAT), lipoprotein lipase (LPL), sterol regulatory element binding protein 1c (SREBP1c), perilipin and leptin. mRNA analysis results are expressed relative to untreated control cells and represented as the mean±s.e. Experiments were conducted two times. Mean values with letters are significantly different (*P<0.05, **P<0.01 and ***P<0.001) by Student's t-test. (d) Adipocyte morphology was determined by Oil Red O staining ( × 400). Ab, antibody; BAFF, B-cell-activating factor; BAFF-R, BAFF receptor; CON, control; KO, knockout.
Figure 2
Figure 2
Change in lipogenic enzymes in fat tissue. (a) Analysis of fatty acid synthase (FAS), acetyl-CoA carboxylase (ACC), perilipin, carnitine palmitoyl acyltransferase-1 (CPT-1) and adiponectin mRNA expression in epididymal adipose tissue (EAT) and subcutaneous adipose tissue (SAT) from high-fat diet (HFD)-induced obese mice. The data are presented as x-fold expression of control mice (n=21 mice per group; genes were analyzed separately). Black columns and symbols represent BAFF−/− mice; white: control. (b) WAT morphology was determined by hematoxylin and eosin (H&E) staining of slides of paraffin-embedded EAT and SAT ( × 200, × 400 × ). (c) At day 8 after inducing differentiation, adipocytes were cultured in a 35-mm dish with 10 ng ml−1 BAFF and the addition of 200 ng ml−1 BAFF-R antibody (n=8). As a control, cells were cultured in the same condition but without BAFF and BAFF-R antibody treatment. The graph represents mRNA expression of peroxisome proliferator-activated receptor γ (PPARγ), PPARγ coactivator 1α (PGC1α), acetyl-CoA synthetase (ACS), diglyceride acyltransferase (DGAT), lipoprotein lipase (LPL), sterol regulatory element binding protein 1c (SREBP1c), perilipin and leptin. mRNA analysis results are expressed relative to untreated control cells and represented as the mean±s.e. Experiments were conducted two times. Mean values with letters are significantly different (*P<0.05, **P<0.01 and ***P<0.001) by Student's t-test. (d) Adipocyte morphology was determined by Oil Red O staining ( × 400). Ab, antibody; BAFF, B-cell-activating factor; BAFF-R, BAFF receptor; CON, control; KO, knockout.
Figure 3
Figure 3
Change in inflammatory enzymes in fat tissue. (a) Analysis of monocyte chemotactic protein-1 (MCP-1), haptoglobin, interleukin-6 (IL-6), prostaglandin-endoperoxide synthase 2 (COX-2) and leptin mRNA expression in epididymal adipose tissue (EAT) and subcutaneous adipose tissue (SAT) from high-fat diet (HFD)-induced obese mice. (b) Enzyme-linked immunosorbent assay (ELISA) of leptin, MCP-1 and interferon-γ (IFNγ) in the serum from HFD-induced obese mice. The data are presented as x-fold expression of control mice (n=21 mice per group; genes were analyzed separately). Black columns and symbols represent BAFF/ mice; white: control. (c) At day 8 after inducing differentiation, adipocytes were cultured in a 35-mm dish with 10 ng ml−1 BAFF and the addition of 200 ng ml−1 BAFF-R antibody (n=8). As a control, cells were cultured in the same condition but without BAFF and BAFF-R antibody treatment. The graph represents mRNA expression of tumor necrosis factor-α (TNFα), IL-6 and adiponectin. mRNA analysis results are expressed relative to untreated control cells and are represented as the mean±s.e. Experiments were conducted two times. Mean values with letters are significantly different (*P<0.05, **P<0.01 and ***P<0.001) by Student's t-test. Ab, antibody; BAFF, B-cell-activating factor; BAFF-R, BAFF receptor; CON, control.
Figure 4
Figure 4
3T3-L1 cells treated with adipose tissue-conditioned media (ATCM). (a) At day 8 after inducing differentiation, adipocytes were cultured in a 35-mm dish with ATCM (n=8). As a control, cells were cultured with wild-type (WT) ATCM treatment. The graph represents mRNA expression of fatty acid synthase (FAS), acetyl-CoA synthetase (ACS), sterol regulatory element binding protein 1c (SREBP1c), PPARγ coactivator 1α (PGC1α), diglyceride acyltransferase (DGAT), lipoprotein lipase (LPL) and perilipin. (b) The graph represents mRNA expression of interleukin-6 (IL-6), prostaglandin-endoperoxide synthase 2 (COX-2), haptoglobin and leptin. mRNA analysis results are expressed relative to untreated control cells and represented as the mean±s.e. Experiments were conducted two times. Mean values with letters are significantly different (*P<0.05, **P<0.01 and ***P<0.001) by Student's t-test. CON, control; KO, knockout.
Figure 5
Figure 5
Macrophage marker expression in fat tissue. (a) Analysis of F4/80 and CD11b. (b) CD86 and CD163. (c) Arg I (arginase-1) and Clec10a (C-type lectin domain family 10, member A) mRNA expression in epididymal adipose tissue (EAT) and subcutaneous adipose tissue (SAT) from high-fat diet (HFD)-induced obese mice. mRNA analysis results are expressed relative to untreated control cells and is represented as the mean±s.e. Experiments were conducted two times. Mean values with letters are significantly different (*P<0.05 and **P<0.01) by Student's t-test. BAFF, B-cell-activating factor; CON, control.

References

    1. Calle EE, Kaaks R. Overweight, obesity and cancer: epidemiological evidence and proposed mechanisms. Nat Rev Cancer. 2004;4:579–591. - PubMed
    1. Dandona P, Aljada A, Chaudhuri A, Mohanty P, Garg R. Metabolic syndrome: a comprehensive perspective based on interactions between obesity, diabetes, and inflammation. Circulation. 2005;111:1448–1454. - PubMed
    1. Grundy SM. Obesity, metabolic syndrome, and cardiovascular disease. J Clin Endocrinol Metab. 2004;89:2595–2600. - PubMed
    1. Fantuzzi G. Adipose tissue, adipokines, and inflammation. J Allergy Clin Immunol. 2005;115:911–919. - PubMed
    1. Wisse BE. The inflammatory syndrome: the role of adipose tissue cytokines in metabolic disorders linked to obesity. J Am Soc Nephrol. 2004;15:2792–2800. - PubMed

Publication types

Substances