. 2015 Jan 16;347(6219):273-7.
doi: 10.1126/science.1257216.

Alternative lengthening of telomeres renders cancer cells hypersensitive to ATR inhibitors

Affiliations

Alternative lengthening of telomeres renders cancer cells hypersensitive to ATR inhibitors

Rachel Litman Flynn et al. Science. .

Abstract

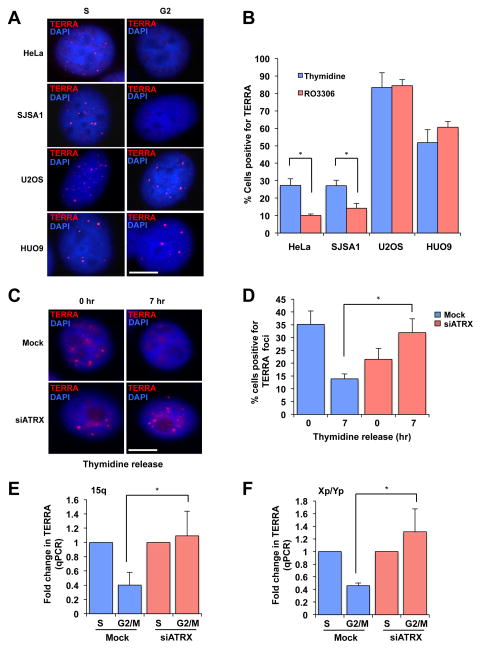
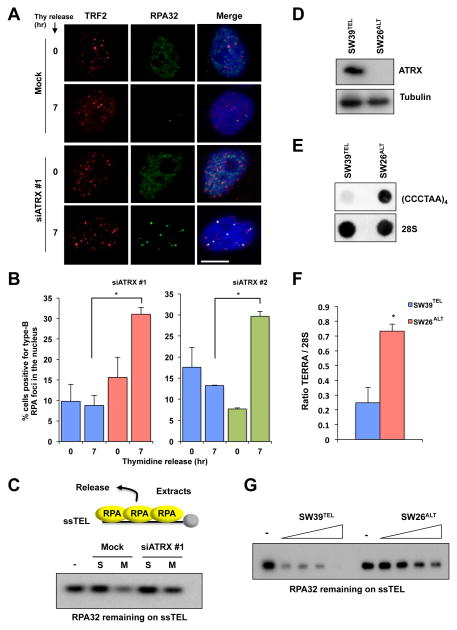
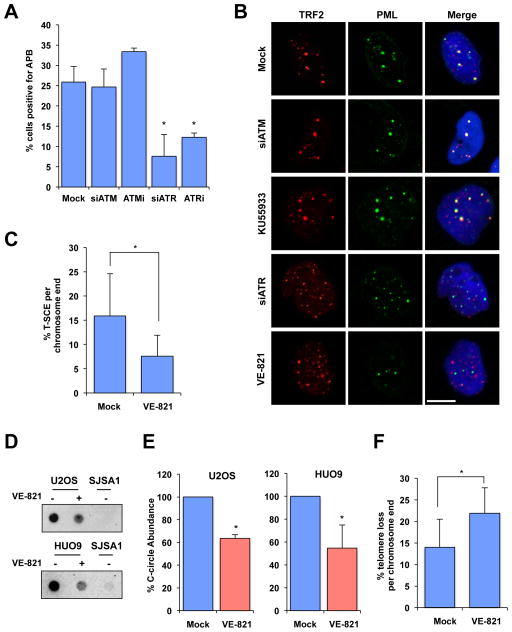
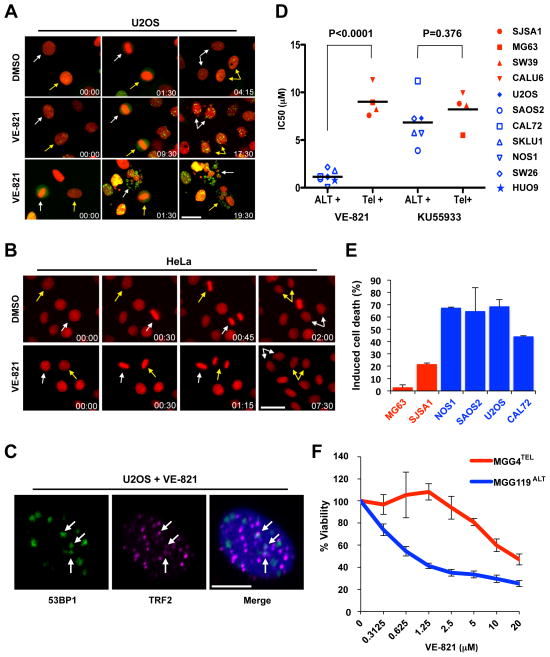
Cancer cells rely on telomerase or the alternative lengthening of telomeres (ALT) pathway to overcome replicative mortality. ALT is mediated by recombination and is prevalent in a subset of human cancers, yet whether it can be exploited therapeutically remains unknown. Loss of the chromatin-remodeling protein ATRX associates with ALT in cancers. Here, we show that ATRX loss compromises cell-cycle regulation of the telomeric noncoding RNA TERRA and leads to persistent association of replication protein A (RPA) with telomeres after DNA replication, creating a recombinogenic nucleoprotein structure. Inhibition of the protein kinase ATR, a critical regulator of recombination recruited by RPA, disrupts ALT and triggers chromosome fragmentation and apoptosis in ALT cells. The cell death induced by ATR inhibitors is highly selective for cancer cells that rely on ALT, suggesting that such inhibitors may be useful for treatment of ALT-positive cancers.


Figures

Fig. 1
Fig. 1. Loss of ATRX compromises the cell-cycle regulation of TERRA
(A) RNA fluorescence in situ hybridization (FISH) analyses of TERRA in HeLa, SJSA1, U2OS and HUO9 cells during the cell cycle. TERRA foci colocalized with TRF2 at telomeres (Fig. S1, S3A–B). To enrich cells in S phase, cells were treated with thymidine alone. To enrich cells in G2, cells were first arrested in S phase with thymidine and then released into medium containing the CDK1 inhibitor RO3306 (Fig. S2). Scale bar: 10 μm. (B) The percentage of cells positive for TERRA foci (> 5 foci) was graphed as the mean with error bars representing standard deviation (n=2). (C) HeLa cells were mock treated or treated with ATRX siRNA, and RNA FISH analysis of TERRA was performed following thymidine release. The knockdown of ATRX was confirmed by Western blot (Fig. S5A). Cells were enriched in late S and G2 phases 7 h after thymidine release (Fig. S5B). Scale bar: 10 μm. (D) The percentage of cells positive for TERRA foci was graphed as the mean with error bars representing the standard deviation (n=3). (E–F) HeLa cells were mock treated or treated with ATRX siRNA, and were enriched in S or M phase with thymidine and nocodazole, respectively (Fig. S5B). TERRA was analyzed by RT-qPCR using the subtelomeric/telomeric primers of chromosome 15q or Xp/Yp. The results are graphed as the mean fold-change with error bars representing the standard deviation (15q n=3, Xp/Yp n=4). *: P-Value < 0.05.
Fig. 2
Fig. 2. Loss of ATRX compromises RPA release from telomeres
(A) HeLa cells were mock treated or treated with ATRX siRNA, and RPA and TRF2 foci were analyzed in S and G2 phases as in Fig. 1C. Scale bar: 10 μm. (B) The percentage of cells positive for RPA foci was graphed as the mean with error bars representing the standard deviation (n=2) *: P-Value = 0.008 (left) and P-Value = 0.002 (right). (C) HeLa cells were either mock treated or treated with ATRX siRNA, and whole-cell extracts (WCE) were generated from cells in S or M phase. Biotinylated ssTEL was coated with RPA and incubated with the WCE. After the incubation, ssTEL was retrieved and the remaining RPA32 on ssTEL was analyzed by Western blot. (D) SW39TEL and SW26ALT cells were analyzed for ATRX protein expression by Western blot. (E) SW39TEL and SW26ALT cells were analyzed for TERRA transcript by dot blot using digoxigenin (DIG)-labeled anti-TERRA or 28S RNA probes. (F) Quantification of dot blots for TERRA transcript in SW39TEL and SW26ALT cells. TERRA signal was normalized to 28S signal and ratios were graphed as the mean with error bars representing the standard deviation (n=2) *: P-Value = 0.001. (G) RPA-ssTEL was incubated in WCE from SW39TEL or SW26ALT cells. The RPA32 remaining on ssTEL was analyzed by Western blot.
Fig. 3
Fig. 3. ATR inhibitor disrupts ALT activity
(A) U2OS cells were mock treated, treated with 5 μM VE-821, 5 μM KU-55933, or treated with siRNA for ATR, or ATM, and then immunostained for TRF2 and PML. The percentage of cells positive for APBs were graphed as the mean with error bars representing the standard deviation, experiment performed in triplicate (n=3). P-Value < 0.02. (B) Representative images from cells quantified in (A). Scale bar: 10 μm. (C) U2OS cells were mock treated or treated with 2.5 μM VE-821 for 4 days and analyzed for T-SCE events using G-rich (green) and C-rich (red) PNA probes. The fraction of chromosome ends with T-SCE was quantified and graphed as the mean with error bars representing the standard deviation (Mock n=1032, VE-821 n=1556). *: P-Value < 0.01. (DE) HUO9 and U2OS cells were mock treated or treated with 5 μM VE-821 for 24 and 48 h, respectively. C-circle amplification products were detected by dot blot in (D). The levels of C-circles were graphed in (E) as the mean with error bars representing standard deviation (n=2). Telomerase-positive SJSA1 cells were used as a negative control. P-Value < 0.02 (F) The fraction of chromosome ends with telomere loss was quantified and graphed as the mean with error bars representing the standard deviation (Mock n=1032, VE-821 n=1556). *: P-Value < 0.01.
Figure 4
Figure 4. Selective killing of ALT cells by ATR inhibitor
(A–B) Stills from time-lapse live-cell imaging experiments of (A) U2OS cells stably expressing H2B-mRFP and 53BP1-GFP or (B) HeLa cells expressing H2B-mRFP following treatment with either 5 μM VE-821 or vehicle control (DMSO). Colored arrows mark individual cells as they progress through mitosis. Time scale: hr:min. Scale bar: 30 μm. At least 150 cells were scored for each condition over two independent experiments. (C) U2OS cells were treated with VE-821 as in (A), and analyzed by immunofluorescence using 53BP1 and TRF2 antibodies. Scale bar: 10 μm. (D) A panel of osteosarcoma cell lines were mock treated, treated with VE-821, or KU-55933 for 4–6 days. Cell viability was determined using CellTiter Glo. Dots represent IC50s calculated from experiments preformed in triplicate (n=3). (E) The osteosarcoma cell lines were treated with 3 μM VE-821 for 6 days, and cell death was quantified by Annexin V staining. Induced cell death is graphed as the mean with error bars representing standard deviation (n=2). (E) MGG4TEL and MGG119ALT cells were treated with increasing concentrations of VE-821 for 6 days. Cell viability was determined using CellTiter Glo. Error bars represent standard deviation, experiment performed in duplicate (n=2).

Comment in

References

    1. Shay JW, Wright WE. Role of telomeres and telomerase in cancer. Semin Cancer Biol. 2011;21:349. - PMC - PubMed
    1. Artandi SE, DePinho RA. Telomeres and telomerase in cancer. Carcinogenesis. 2010;31:9. - PMC - PubMed
    1. Cesare AJ, Reddel RR. Alternative lengthening of telomeres: models, mechanisms and implications. Nat Rev Genet. 2010;11:319. - PubMed
    1. Heaphy CM, et al. Prevalence of the alternative lengthening of telomeres telomere maintenance mechanism in human cancer subtypes. Am J Pathol. 2011;179:1608. - PMC - PubMed
    1. Bryant HE, et al. Specific killing of BRCA2-deficient tumours with inhibitors of poly(ADP-ribose) polymerase. Nature. 2005;434:913. - PubMed

Publication types

MeSH terms

Substances