. 2015 Jan 15;29(2):129-43.
doi: 10.1101/gad.250282.114.

The transcription factor Nerfin-1 prevents reversion of neurons into neural stem cells

Affiliations

The transcription factor Nerfin-1 prevents reversion of neurons into neural stem cells

Francesca Froldi et al. Genes Dev. .

Abstract

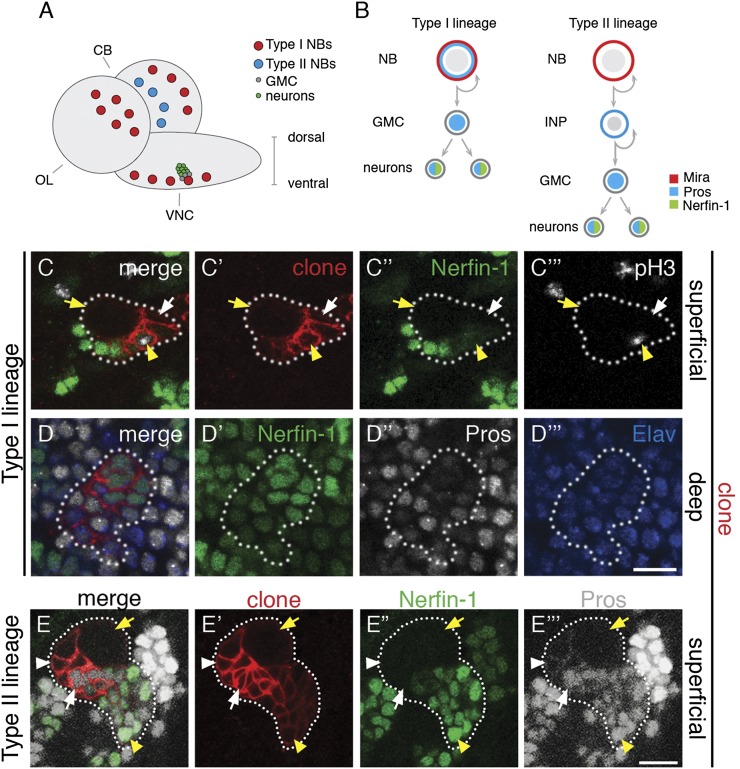
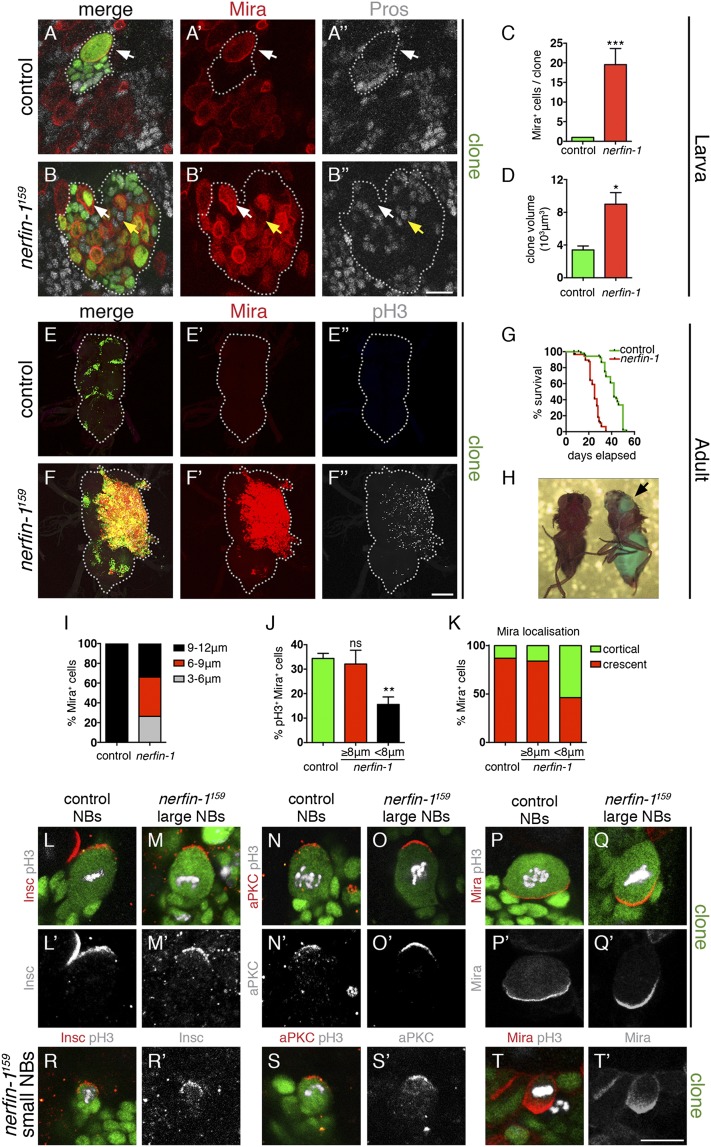
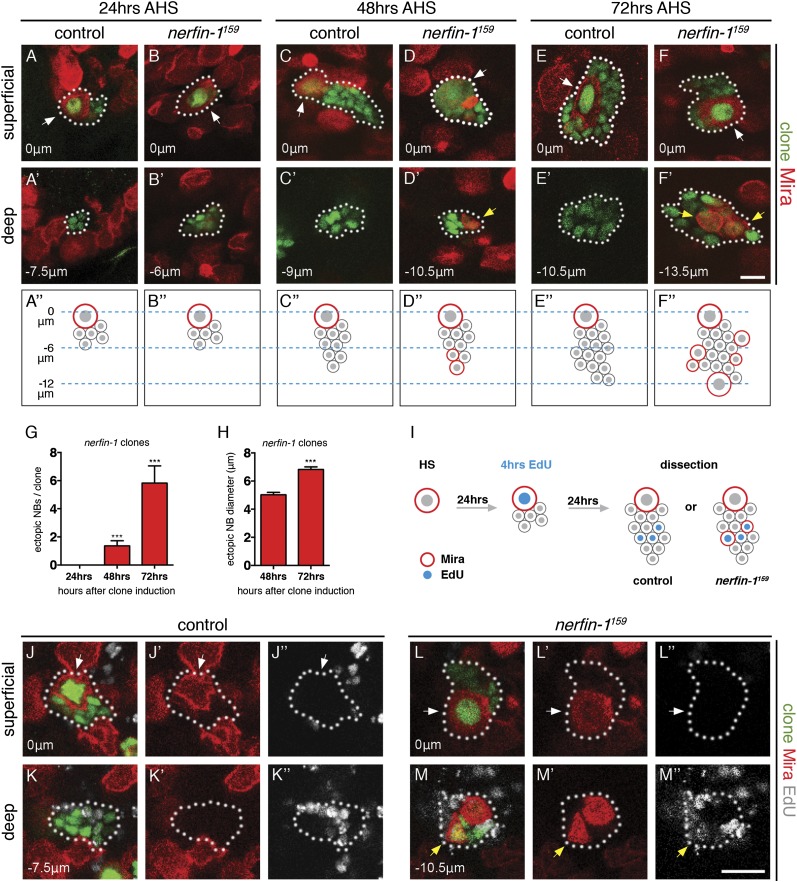
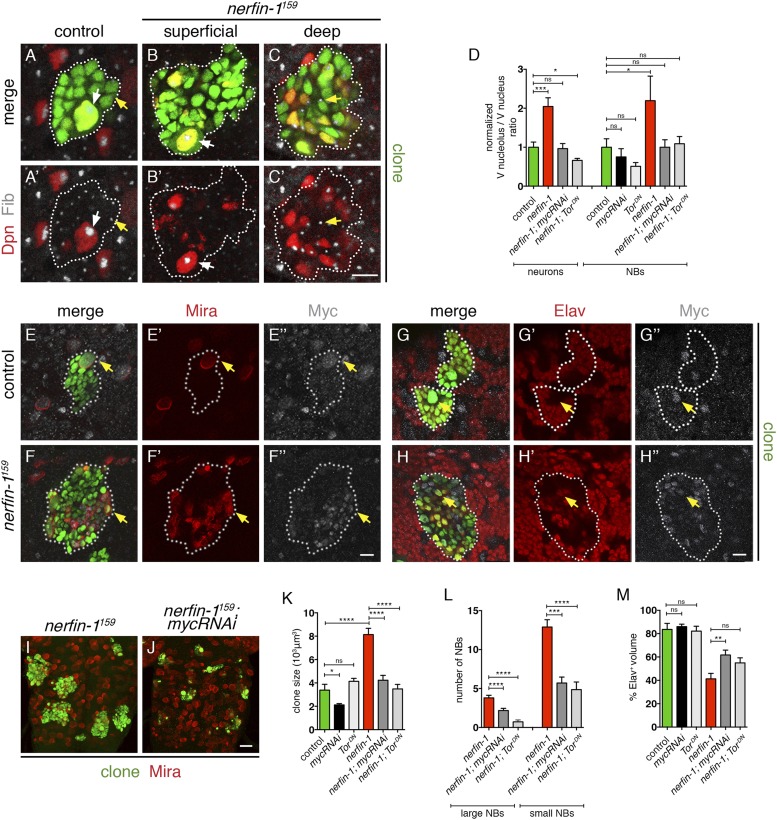
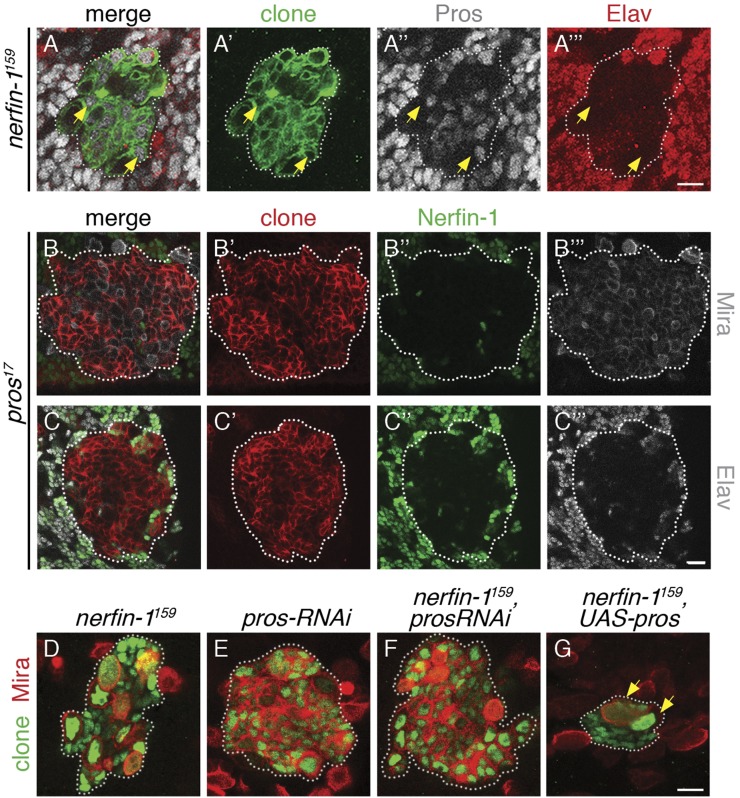
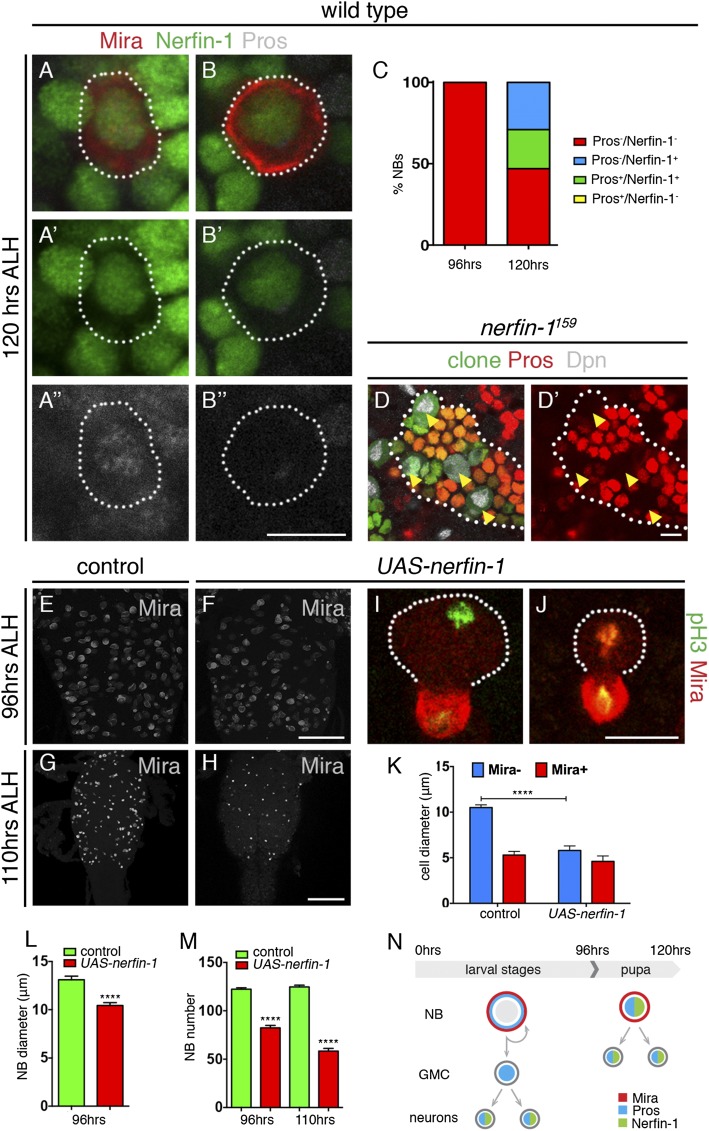
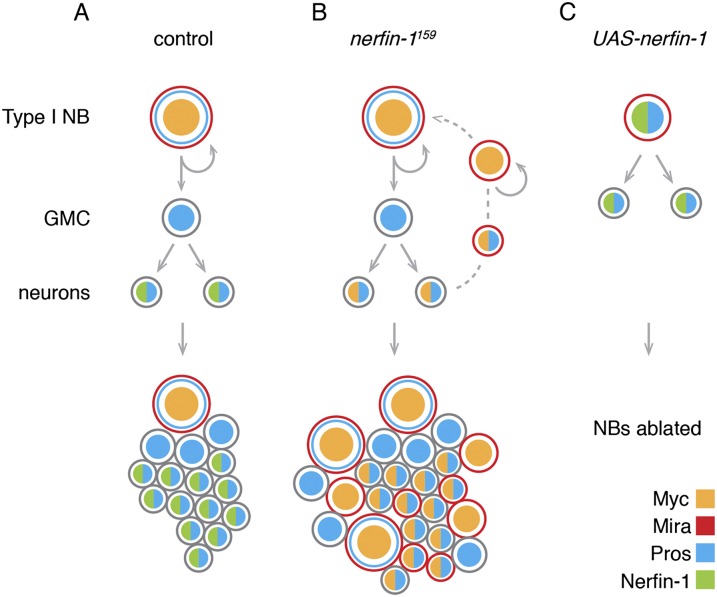
Cellular dedifferentiation is the regression of a cell from a specialized state to a more multipotent state and is implicated in cancer. However, the transcriptional network that prevents differentiated cells from reacquiring stem cell fate is so far unclear. Neuroblasts (NBs), the Drosophila neural stem cells, are a model for the regulation of stem cell self-renewal and differentiation. Here we show that the Drosophila zinc finger transcription factor Nervous fingers 1 (Nerfin-1) locks neurons into differentiation, preventing their reversion into NBs. Following Prospero-dependent neuronal specification in the ganglion mother cell (GMC), a Nerfin-1-specific transcriptional program maintains differentiation in the post-mitotic neurons. The loss of Nerfin-1 causes reversion to multipotency and results in tumors in several neural lineages. Both the onset and rate of neuronal dedifferentiation in nerfin-1 mutant lineages are dependent on Myc- and target of rapamycin (Tor)-mediated cellular growth. In addition, Nerfin-1 is required for NB differentiation at the end of neurogenesis. RNA sequencing (RNA-seq) and chromatin immunoprecipitation (ChIP) analysis show that Nerfin-1 administers its function by repression of self-renewing-specific and activation of differentiation-specific genes. Our findings support the model of bidirectional interconvertibility between neural stem cells and their post-mitotic progeny and highlight the importance of the Nerfin-1-regulated transcriptional program in neuronal maintenance.

Keywords: Drosophila; cancer; central nervous system; dedifferentiation; neuroblasts; stem cells.


Figures

Figure 1.
Figure 1.
Nerfin-1 expression during post-embryonic neurogenesis. (A) Larval CNS is generated by type I (red) and type II (blue) neuroblasts throughout post-embryonic neurogenesis. The earliest born neurons are located deep in the CNS, and the most recently born neurons are located superficially. (B) Schematics depicting neurogenesis in type I and type II lineages. Type I NBs express Mira and segregate Pros to the GMC. GMCs divide only once to produce two post-mitotic neurons that express Nerfin-1. Type II NBs divide to self-renew and give rise to transit-amplifying INPs. Type II NBs express Mira but not Pros. INPs divide four to eight times, generating another INP and a GMC that divides only once to give rise to two neurons, both of which express Nerfin-1. (C–D″′) Type I MARCM clone marked by RFP. (C–C″′) Superficial section: Nerfin-1 (green) is absent in the NB (yellow arrow) and in the latest born GMCs adjacent to the NB (white arrow) and is expressed at low levels in mitotic GMCs (positive for the mitotic marker pH3+; yellow arrowhead). (D–D″′) In a deep section of the clone, Nerfin-1 colocalizes with Pros (white) and Elav (blue) in differentiated neurons. (E–E″′) Type II lineage marked by RFP. Nerfin-1-GFP (green) is expressed in post-mitotic neurons (yellow arrowhead) but not in type II NBs (large cell; yellow arrow) or INPs (identified by cortical Pros; white in E″′; white arrowhead) and at very low levels in GMCs (identified by nuclear Pros; white arrow). Bars, 10 μm. See also Supplemental Figures S1–S3.
Figure 2.
Figure 2.
Nerfin-1 inhibits neuroblast overgrowth in the larval and adult CNS. (A–B″) Size comparison of control or nerfin-1159 MARCM clones in the larval VNC. Control clones contain one large Mira+ NB (red; white arrow), and nerfin-1159 clones contain 20 Mira+ cells on average (quantified in C; m = 19.55, SEM = 4.10, n = 11) of variable cell sizes. The large Mira+ cells (B–B″, white arrow) are Pros, and the small Mira+ cells (B–B″, yellow arrow) are Pros+. The increase in Mira+ cell numbers results in a 2.9-fold expansion in clone volume 4 d after clone induction (D; control: m = 3.38 × 103 μm3, SEM = 0.49 × 103 μm3, n = 57; nerfin-1159: m = 8.99 × 103 μm3, SEM = 1.41 × 103 μm3, n = 137). (E–F″). In contrast to control NBs which are absent in adult MARCM clones (E–E″), nerfin-1159 mutant Mira+ cells (F,F′) fail to undergo timely differentiation during pupal life and continue to be highly proliferative during adult stages (F″; indicated by pH3+, white), resulting in large tumor clones that are detrimental to the adult hosts, shortening their average life span by 40% (G; control: median survival = 42 d, n = 56; nerfin-1159: median survival = 25 d, n = 57). (H) Upon transplantation of nerfin-1159 tumor fragments into the abdomen of naive hosts, nerfin-1159 brain cells (GFP+, right; n = 10) but not GFP+ control brain cells (left; n = 10) overgrow and metastasize to distant sites such as the eye (arrow). (I) Histogram depicting NB cell size; 100% of control NBs (n = 37) are between 9 and 12 μm in diameter. In nerfin-1159 clones (n = 82), 26.3% of Mira+ cells are between 3 and 6 μm, 39.7% are between 6 and 9 μm, and 44% are between 9 and 12 μm. (J) Histogram depicting the percentage of Mira+ cells in M phase (control: m = 34.4%, SEM = 2.06%, n = 5; large nerfin-1159 Mira+ cells ≥8 μm: m = 32.12%, SEM = 5.6%, n = 10; small nerfin-1159 Mira+ cell <8 μm: m = 15.6%, SEM = 3.03%, n = 10). (K) Eighty-seven percent of control NBs (n = 23), 84% of large nerfin-1159 Mira+ cells (n = 24), and 46.2% of small nerfin-1159 Mira+ cells (n = 24) correctly localize basal polarity marker Mira. (L–T′) representative images of apical markers Insc and aPKC and basal marker Mira in large and small NBs at metaphase. E–F″ are maximum projections. Bars: A–B″,L–T′, 10 μm; E–F″, 50 μm. (ns) P > 0.05; (*) P ≤ 0.05; (**) P ≤ 0.01; (***) P ≤ 0.001. See also Supplemental Figures S4–S7.
Figure 3.
Figure 3.
nerfin-1159 ectopic NBs arise from dedifferentiation of neurons. (A–F″) Control and nerfin-1159 clones were examined at 24 h (A–B′), 48 h (C–D′), and 72 h (E–F′) after clone induction and stained with the NB marker Mira (red). The parental NBs, identified by their large size and location in superficial sections of the brain (0 μm), are marked with white arrows, and ectopic Mira+ cells are marked with yellow arrows. (A″,B″,C″,D″,E″,F″) The results are summarized in the schematics. (A–B″) No ectopic NBs were identified in nerfin-1159 and control clones at 24 h after clone induction. (C–F″) Ectopic NBs were detected in nerfin-1159 clones at 48 and 72 h after clone induction in the deepest sections of the clones. (G) Histogram depicting the frequency of ectopic NBs at 24, 48, and 72 h after clone induction in nerfin-1159 clones (24 h: m = 0, SEM = 0, n = 22; 48 h: m = 1.36, SEM = 0.36, n = 25; 72 h: m = 5.83, SEM = 1.23, n = 23). (H) Histogram depicting the average ectopic NB diameter at 48 and 72 h after clone induction in nerfin-1159 clones (48 h: m = 5.03, SEM = 0.17, n = 24; 72 h: m = 6.82, SEM = 0.19, n = 129). (I) Schematic depicting the EdU pulse-chase experiment in control and nerfin-1159 clones. Animals were fed EdU-containing food for 4 h at 24 h after clone induction and then chased with EdU-free food for 24 h. (J–K″) In control clones, no EdU+/Mira+ cells were recovered (0%; n = 18). (L–M″) In nerfin-1159 clones, EdU+/Mira+ ectopic NBs located in deep sections normally occupied by post-mitotic neurons were recovered in 33% of the clones (n = 18; yellow arrow). (J–L″) Parental NBs are marked with white arrows. Bars, 10 μm. (***) P ≤ 0.001. See also Supplemental Figures S8–S10.
Figure 4.
Figure 4.
Myc- and Tor- mediated cellular growth regulate neuron-to-NB reversion in nerfin-1159 clones. (A–C′) The ratio of nucleolus (marked by Fib, white) to nuclear (marked by nGFP, green) volume is significantly increased in nerfin-1159 NBs (Dpn+, red; white arrow) and neurons (Dpn, yellow arrow), as quantified in D (control NBs: m = 1.89, SEM = 0.47, n = 14; nerfin-1159 NBs: m = 3.55, SEM = 0.45, n = 20; control neurons: m = 1.01, SEM = 0.13, n = 22; nerfin-1159 neurons: m = 2.08, SEM = 0.22, n = 27). Myc and Tor inhibition does not alter the nucleolus to nuclear volume ratio (mycRNAi: m = 1.68, SEM = 0.47, n = 9; TorDN: m = 1.14, SEM = 0.21, n = 9) but is sufficient to restore nerfin-1159 nucleolus to nuclear volume ratio to control levels in both nerfin-1159 neurons and NBs (D; nerfin-1159;mycRNAi neuronal ratio: m = 0.97, SEM = 0.13, n = 10; nerfin-1159;mycRNAi NB ratio: m = 2.24, SEM = 0.42, n = 24; nerfin-1159 ;TorDN neuronal ratio: m = 0.67, SEM = 0.05, n = 26; nerfin-1159 ;TorDN NB ratio: m = 1.78, SEM = 0.3, n = 20). (E–H″) Myc expression (white) is up-regulated in control Mira+ (red) NBs (E–E″, yellow arrow; G–G″, yellow arrow) and both nerfin-1159 Mira+ NBs (F–F″, yellow arrow), and Mira, Elav+ (red) neurons (H–H″, yellow arrow). (I,J) RNAi knockdown of myc significantly reduces nerfin-1159 tumor growth. (K) Histogram depicting clonal volume under Myc and Tor manipulations (control: m = 3387 × 103 μm3, SEM = 496 × 103 μm3, n = 57; mycRNAi: m = 2120 × 103 μm3, SEM = 118 × 103 μm3, n = 46; TorDN: m = 4135 × 103 μm3, SEM = 255 × 103 μm3, n = 9; nerfin-1159: m = 8139 × 103 μm3, SEM = 539 × 103 μm3, n = 180; nerfin-1159;mycRNAi: m = 4237 × 103 μm3, SEM = 410 × 103 μm3, n = 77; nerfin-1159;TorDN: m = 3494 × 103 μm3, SEM = 385 × 103 μm3, n = 63). (L) The decrease in nerfin-1159 tumors under Myc and Tor manipulations is due to a reduction in both the number of large (≥8 μm) and small (<8 μm) NBs (nerfin-1159 large NBs: m = 4.3, SEM = 0.44, n = 23; nerfin-1159;mycRNAi large NBs: m = 2.17, SEM = 0.28, n = 39; nerfin-1159;TorDN large NBs: m = 0.72, SEM = 0.23, n = 18; nerfin-1159 small NBs: m = 12.9, SEM = 0.90, n = 40; nerfin-1159;mycRNAi small NBs: m = 5.30, SEM = 0.74, n = 40; nerfin-1159;TorDN small NBs: m = 5.23, SEM = 0.82, n = 17). (M) RNAi knockdown of Myc and Tor was sufficient to increase the level of differentiation in nerfin-1159 clones (control: m = 83.63%, SEM = 5.18, n = 3; mycRNAi: m = 86%, SEM = 2, n = 15; TorDN: m = 82.18%, SEM = 4.17, n = 6; nerfin-1159: m = 41.34%, SEM = 4.66, n = 21; nerfin-1159;mycRNAi: m = 61.67%, SEM = 4.28, n = 15; nerfin-1159;TorDN: m = 55%, SEM = 4.29, n = 11). Bars: A–C′,E–H′, 10 μm; I,J, 25 μm. (ns) P > 0.05; (*) P ≤ 0.05; (**) P ≤ 0.01; (***) P ≤ 0.001; (****) P ≤ 0.0001. See also Supplemental Figures S10–S11.
Figure 5.
Figure 5.
Pros and Nerfin-1 act sequentially to promote neuronal specification. (A–A″′) Elav expression (red) is down-regulated in more cells than Pros expression (white) in nerfin-1159 clones (green). (B–C″′) Nerfin-1 (green, B″,C″) is absent in RFP-labeled pros17 clones (red) that consist mostly of NBs (Mira+; B″′, white) and are almost completely devoid of differentiated cells (Elav+; C″′, white). (D–G) nerfin-1159; prosRNAi (F) phenocopies the prosRNAi (E) clonal phenotype. Overexpression of Pros partially rescues nerfin-1159 clones (cf. G and D) containing zero, one (not shown) or two (G, yellow arrows) NBs per clone. Bars, 10 μm. See also Supplemental Figures S12–S15.
Figure 6.
Figure 6.
Nerfin-1 is required for timely NB differentiation, and ectopic nerfin-1 promotes differentiation. (A–B″) At the end of neurogenesis (120 h ALH), Nerfin-1 and Pros are localized to the NB (Mira+, red) nucleus, prior to NB terminal differentiation. In 24% of NBs, both Pros (white) and Nerfin-1 (green) are expressed in the nucleus (A–A″), and 29% of NBs express only Nerfin-1 but not Pros (B–B″). (C) Histogram depicting the percentage of nuclear localization of Pros and Nerfin-1 in the NBs at 96 h (n = 20) and 120 h (n = 17). (D–D′) nerfin-1159 NBs (Dpn+, white; yellow arrowheads) fail to undergo timely terminal differentiation at 120 h. In these NBs, nuclear Pros (red) localization does not occur. (E–M) Nerfin-1 overexpression in NBs with pan-NB driver dnab-Gal4 induces premature differentiation and reduction in the overall NB numbers at 96 h (E,F) and 110 h (G,H; maximum projections), as quantified in M (96 h, control: m = 122, SEM = 1.45, n = 3; dnab>nerfin-1: m = 82.4, SEM = 2.49, n = 10; 110 h, control: m = 125, SEM = 1.8, n = 3; dnab>nerfin-1: m = 58, SEM = 2.6, n = 5). (I,J) This reduction in NB numbers corresponds with a reduction in NB diameter, as quantified in L (control: m = 13.1 μm, SEM = 0.36 μm, n = 27; dnab>nerfin-1: m = 10.4 μm, SEM = 0.3 μm, n = 24), and increase in the incidence of size-symmetric divisions indicative of premature differentiation. (K) Histogram depicting the average diameter of thoracic NBs (Mira) and their progeny (Mira+) during telophase (control, Mira: m = 10.5 μm, SEM = 0.3 μm, n = 10; Mira+: m = 5.3 μm, SEM = 0.4 μm, n = 10; dnab>nerfin-1, Mira: m = 5.8 μm, SEM = 0.5 μm, n = 8; Mira+: m = 4.6 μm, SEM = 0.6 μm, n = 8). (N) Schematic depicting the localization of Nerfin-1 during larval and pupal neurogenesis. In larval stages (up to 96 h ALH), Nerfin-1 is expressed in neurons (which also express the differentiation marker Pros) and not in self-renewing NBs or GMCs. At the end of neurogenesis (120 h ALH), Nerfin-1 and Pros are localized to the nucleus of the NBs prior to their terminal differentiation. Bars: E–H, 100 μm; all others, 10 μm. (****) P ≤ 0.0001. See also Supplemental Figures S16, S17.
Figure 7.
Figure 7.
Nerfin-1 promotes differentiation and prevents neuronal reversion into neuroblasts. (A) Type I NBs express Mira (red) and Myc (orange) and segregate the homeodomain transcription factor Pros (blue) to the GMC. GMCs divide only once to produce two post-mitotic neurons that express Nerfin-1 (green). (B) Upon the loss of Nerfin-1 in neurons, Myc-dependent cellular growth ensures that neurons reach a cell size threshold before they undergo a stepwise reversion. The reverted cells first switch on stem cell-specific genes such as Mira while maintaining the expression of neuronal genes such as Pros. As these reverted NBs further increase in size, Pros is eventually switched off, and the reverted progenitors begin to cycle at the speed of wild-type neuroblasts and undergo asymmetric self-renewal. This expansion of neural progenitors results in proliferative tumorous masses that consist of a mixture of neurons and NBs undergoing various stages of reversion. (C) When ectopically expressed earlier during development, Nerfin-1 promotes premature neuroblast cell cycle exit via size-symmetric cell divisions.

Similar articles

Cited by

References

    1. Aldaz S, Escudero LM, Freeman M. 2010. Live imaging of Drosophila imaginal disc development. Proc Natl Acad Sci 107: 14217–14222. - PMC - PubMed
    1. Bello BC, Hirth F, Gould AP. 2003. A pulse of the Drosophila Hox protein Abdominal-A schedules the end of neural proliferation via neuroblast apoptosis. Neuron 37: 209–219. - PubMed
    1. Bello B, Reichert H, Hirth F. 2006. The brain tumor gene negatively regulates neural progenitor cell proliferation in the larval central brain of Drosophila. Development 133: 2639–2648. - PubMed
    1. Bello BC, Izergina N, Caussinus E, Reichert H. 2008. Amplification of neural stem cell proliferation by intermediate progenitor cells in Drosophila brain development. Neural Dev 3: 5. - PMC - PubMed
    1. Berger C, Harzer H, Burkard TR, Steinmann J, van der Horst S, Laurenson A-S, Novatchkova M, Reichert H, Knoblich JA. 2012. FACS purification and transcriptome analysis of Drosophila neural stem cells reveals a role for Klumpfuss in self-renewal. Cell Reports 2: 407–418. - PMC - PubMed

Publication types

MeSH terms

Substances

LinkOut - more resources