. 2015 Jan 15;29(2):212-24.
doi: 10.1101/gad.247924.114.

Genome-wide chromatin footprinting reveals changes in replication origin architecture induced by pre-RC assembly

Affiliations

Genome-wide chromatin footprinting reveals changes in replication origin architecture induced by pre-RC assembly

Jason A Belsky et al. Genes Dev. .

Abstract

Start sites of DNA replication are marked by the origin recognition complex (ORC), which coordinates Mcm2-7 helicase loading to form the prereplicative complex (pre-RC). Although pre-RC assembly is well characterized in vitro, the process is poorly understood within the local chromatin environment surrounding replication origins. To reveal how the chromatin architecture modulates origin selection and activation, we "footprinted" nucleosomes, transcription factors, and replication proteins at multiple points during the Saccharomyces cerevisiae cell cycle. Our nucleotide-resolution protein occupancy profiles resolved a precise ORC-dependent footprint at 269 origins in G2. A separate class of inefficient origins exhibited protein occupancy only in G1, suggesting that stable ORC chromatin association in G2 is a determinant of origin efficiency. G1 nucleosome remodeling concomitant with pre-RC assembly expanded the origin nucleosome-free region and enhanced activation efficiency. Finally, the local chromatin environment restricts the loading of the Mcm2-7 double hexamer either upstream of or downstream from the ARS consensus sequence (ACS).

Keywords: DNA replication; chromatin; nucleosome; origin recognition complex (ORC).


Figures

Figure 1.
Figure 1.
Identification of an ORC-dependent footprint by MNase mapping. (A) Wild-type (WT) and orc1-161 G2 chromatin profiles at the ARS107 locus. Recovered and sequenced MNase fragments are displayed with their chromosomal coordinate on the X-axis and their fragment length on the Y-axis. Clusters of reads in the ∼150- to 175-bp range denote protection by nucleosomes. Consensus nucleosome positions are represented by red ovals, and the shading corresponds to the total occupancy of a particular nucleosome. Smaller fragments (25–120 bp) indicate protein–DNA occupancy from sequence-specific DNA-binding factors (green rectangles). Annotated DNA-binding motifs (Abf1 and ACS) are indicated in green. (B) Aggregate chromatin profiles from a previously characterized replication origin data set (ORC–ACS) (Eaton et al. 2010), with all origins oriented by the T-rich ACS strand. The top and middle panels are derived from wild-type and orc1-161 MNase digestions, respectively. The bottom panel represents a merged overlay of wild type (red) and orc1-161 (green).
Figure 2.
Figure 2.
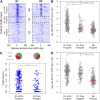
ORC only associates with a subset of putative origins. Small fragments (25–120 bp) surrounding the ACS at each of the 798 putative (exhibiting ARS function on a plasmid) OriDB origins (Nieduszynski et al. 2007) were condensed into single footprint signals for wild type (WT) (A) and orc1-161 (B). Each row in the heat map represents an individual origin oriented by its T-rich ACS strand as in Figure 1B. (C) The orc1-161 (green) small fragment signal was subtracted from the wild-type (red) small fragment signal to yield a difference heat map. An ORC-dependent footprint was detected at 269 origins (top subset). (D) ORC ChIP-seq data from asynchronous cells largely overlapped with replication origins containing an ORC-dependent footprint (top subset).
Figure 3.
Figure 3.
ORC–chromatin association in G2 is a determinant of origin efficiency. (A) Heat map of small fragment (25–120 bp) footprint occupancy surrounding the ACS at each putative OriDB origin (Nieduszynski et al. 2007) for G1-arrested (left panel) and G2-arrested (right panel) cells. ORC-dependent footprint origins displayed an increased occupancy and wider protection region in G1 (G1 & G2 Footprint). A separate origin class exhibited protection of the ACS region specifically in G1 (G1-Only Footprint). (B) Distribution of asynchronous ORC ChIP-seq enrichment for each putative origin. ORC ChIP-seq signal was significantly greater in the G1 and G2 footprint class compared with either the G1-only footprint or no footprint classes (Wilcoxon test, P < 6.80 × 10⁻¹³ and P < 4.81 × 10−43, respectively). A smaller yet significant difference was also detected in the G1-only footprint class relative to the no footprint class (P < 1.05 × 10⁻⁷). (C) Origin activation and efficiency for the G1 and G2 footprint and G1-only footprint classes. The G1 and G2 footprint class was more efficient (P < 1.61 × 10⁻¹¹) and earlier activating (χ2 test, P < 1.20 × 10⁻⁷) than the G1-only footprint class. (D) Distribution of G1 Mcm2–7 ChIP-seq enrichment for each putative origin. The G1 and G2 footprint and G1-only footprint classes showed no significant difference in Mcm2–7 signal (Wilcoxon test, P < 0.035), but each contained greater Mcm2–7 signal than the no footprint class (P < 3.48 × 10−43 and P < 3.93 × 10⁻²⁸, respectively).
Figure 4.
Figure 4.
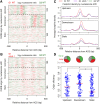
Cell cycle-dependent nucleosome dynamics promote origin efficiency. (A) Heat map representing the log2 ratio of G1 wild-type (WT) (red) to G2 wild-type (green) nucleosome density. Three classes of nucleosome movement (upstream, downstream, and static) were identified. (B) Heat map representing the log2 ratio of G1 cdc6-1 (red) to G2 wild-type (green) nucleosome density, ordered as in A. (C) Average small fragment (25–120 bp) footprint occupancy surrounding the ACS for each class of nucleosome positioning in G1 wild type (red), G1 cdc6-1 (purple), and G2 wild type (green). (D) Origin activation and efficiency for each class of nucleosome positioning. Both the upstream and downstream shifting nucleosome classes were more efficient than the static nucleosome class (Wilcoxon test, upstream vs. static, P < 1.42 × 10⁻⁴; downstream vs. static, P < 2.03 × 10⁻⁷; upstream vs. downstream, P < 0.134) and earlier activating (χ2 test, upstream vs. static, P < 0.0206; downstream vs. static, P < 1.04 × 10⁻⁴; upstream vs. downstream, P < 0.474).
Figure 5.
Figure 5.
Mcm2–7 loads either upstream of or downstream from ORC. (A) Locations of ORC (green) and Mcm2–7 (purple) ChIP-seq peaks relative to the G1 MNase chromatin data (gray) surrounding origins. For each of the 398 origins with a G1 footprint, 257 asynchronous ORC and 332 G1 Mcm2–7 peaks were identified. The ChIP-seq peak position relative to the ACS was plotted on the X-axis, and random noise was applied along the Y-axis to spread the data points. (B) Hypothetical distribution of ChIP-seq forward (red) and reverse (green) reads representing chromatin fragmentation patterns around a specific DNA-binding factor. The most likely protein-binding region can be inferred as the area between the two read distributions. (C) Analysis of chromatin fragmentation patterns resulting from ORC (left) and Mcm2–7 (right) ChIP-seq. The 389 origins with sufficient Mcm2–7 ChIP-seq signal were grouped into two classes (upstream and downstream) based on the enrichment signal relative to the origin-flanking nucleosomes. Heat maps (separated by class) represent the distributions of forward (red) and reverse (green) reads at each origin relative to the ACS for ORC (left) and Mcm2–7 (right). Origins have the same ordering in both heat maps. The top and bottom panels represent the average forward and reverse ORC and Mcm2–7 ChIP-seq densities within each class. The most probable fragmentation boundaries are designated by red and green dotted lines for forward and reverse reads, respectively. The average G1 nucleosome density (blue) for each class is superimposed on each plot, and inferred nucleosome positions are depicted as red-shaded ovals.

References

    1. Aparicio OM, Weinstein DM, Bell SP. 1997. Components and dynamics of DNA replication complexes in S. cerevisiae: redistribution of MCM proteins and Cdc45p during S phase. Cell 91: 59–69. - PubMed
    1. Bai L, Morozov AV. 2010. Gene regulation by nucleosome positioning. Trends Genet 26: 476–483. - PubMed
    1. Bell SP, Kaguni JM. 2013. Helicase loading at chromosomal origins of replication. Cold Spring Harb Perspect Biol 5: a010124. - PMC - PubMed
    1. Bell SP, Stillman B. 1992. ATP-dependent recognition of eukaryotic origins of DNA replication by a multiprotein complex. Nature 357: 128–134. - PubMed
    1. Berbenetz NM, Nislow C, Brown GW. 2010. Diversity of eukaryotic DNA replication origins revealed by genome-wide analysis of chromatin structure. PLoS Genet 6: e1001092. - PMC - PubMed

Publication types

MeSH terms

LinkOut - more resources