. 2014 Apr 30;1(4):250-261.
doi: 10.18632/oncoscience.30. eCollection 2014.

MicroRNA miR-125a-3p modulates molecular pathway of motility and migration in prostate cancer cells

Affiliations

MicroRNA miR-125a-3p modulates molecular pathway of motility and migration in prostate cancer cells

Lihi Ninio-Many et al. Oncoscience. .

Abstract

Fyn kinase is implicated in prostate cancer. We illustrate the role of miR-125a-3p in cellular pathways accounted for motility and migration of prostate cancer cells, probably through its regulation on Fyn expression and Fyn-downstream proteins. Prostate cancer PC3 cells were transiently transfected with empty miR-Vec (control) or with miR-125a-3p. Overexpression of miR-125a-3p reduced migration of PC3 cells and increased apoptosis. Live cell confocal imaging indicated that overexpression of miR-125a-3p reduced the cells' track speed and length and impaired phenotype. Fyn, FAK and paxillin, displayed reduced activity following miR-125a-3p overexpression. Accordingly, actin rearrangement and cells' protrusion formation were impaired. An inverse correlation between miR-125a-3p and Gleason score was observed in human prostate cancer tissues. Our study demonstrated that miR-125a-3p may regulate migration of prostate cancer cells.

Keywords: EMT; Fyn; actin cytoskeleton; live imaging; miR-125a-3p; migration; prostate cancer.


Conflict of interest statement

Conflict of interest

The authors declare that there is no conflict of interest that would affect the impartiality of this scientific work.

Figures

Figure 1
Figure 1. miR-125a-3p impairs cell cycle, viability and induces apoptosis
(A) Endogenous and manipulated expression of miR-125a-3p. The expression level of miR-125a-3p was measured in PC3 naive cells, in cells transfected with miR-125a-3p or with empty vector (control), by Real-Time PCR using primers against miR-125a-3p and U6-SnRNA as a calibrator. (B-D) PC3 cells were transfected with miR-125a-3p or with a control vector, collected 48 hours later and subjected to: (B) Flow cytometry for DNA content. Representative FACS diagrams of one of three independent experiments. (C) Flow cytometry for annexin-V and PI labeling; percent of cells labeled with annexin-V (early apoptosis, bottom right square) or with a combination of annexin-V and PI (late apoptosis, upper right square), was measured. (D) WB analysis of phospho-Akt (p-Akt) and its loading control, general Akt. The experiment was repeated 3 times. Intensity of bands was analyzed using the image J software and the ratio between p-Akt and general Akt is presented. The bars are mean+SD. (*; P<0.05 and **; p<0.01) - Significantly different from control value.
Figure 2
Figure 2. miR-125a-3p impairs cells motility
Representative pictures of PC3 cells transfected with miR-125a-3p or empty miR-Vec (control), and subjected, 48 hours later, to cell migration assays: (A) scratch assay (B) transwell assay. Thick arrows indicate the migrating cells. A' and B'- lower magnification photos of control and miR-125a-3p overexpressing cells; A'' and B''- higher magnification photos, respectively. Thin arrows point at the membrane pores. Bar =50μm. The results were analyzed using the image J software. Similar results were obtained in three independent experiments.
Figure 3
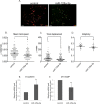
Figure 3. miR-125a-3p impairs the morpho-kinetic coordinated collective migration
PC3 cells were co-transfected with either: miR-125a-3p and GFP plasmid or an empty miR-Vec and RFP plasmid (control). Twenty four hour after the transfection, the two cell populations were mixed, cultured for an additional 24 hours and then imaged by live confocal microscopy. Image stacks were taken every 5 minutes during 15 hours. The images were processed and analyzed by the Imaris software. (A) Representative pictures of imaged miR-125a-3p overexpressing cells (miR-125a-3p; right) and control cells (left). Each white dot represents one cell. Each colored line indicates the track of one cell. Graphs summarize (B) Track lengh, (C) Track speed and (D) Elipticity of 111 control cells and 86 miR-125a-3p-overexpressing cells. All parameters collected along the experiments were analyzed for each cell and only then, group analysis (control or miR-125a-3p) was performed. Results were analyzed by one-sample T-test; p<0.05. PC3 cells, transfected for 48 hours with miR-125a-3p or with empty miR-Vec (control), were subjected to qPCR analysis with specific primers for (E) E-cadherin or (F) MT1-MMP; all calibrated with the endogenous control, HPRT1. The experiment was repeated 3 times and analyzed by one-sample T-test. Bars are mean+SD. (*) - Significantly different from control cells value (p<0.05).
Figure 4
Figure 4. The effect of miR-125a-3p on hallmark genes in prostate cancer
PC3 cells, transfected with miR-125a-3p or with empty vector (control), were cultured for 48 hours. Cells were lysed and, (A) their Fyn mRNA expression was analyzed by Real Time PCR. Proteins were analyzed by WB with specific antibodies against: (B) Fyn, (C) phospho-FAK (p-FAK) and (D) phospho-paxillin (p-paxillin), as well as against their loading control proteins (actin, general FAK and general paxillin, respectively). The experiment was repeated 3 times. Intensity of bands was analyzed using the image J software and the ratio between each protein and its control was plotted. The bars are mean+SD. (*) - Significantly different from control value (p <0.05).
Figure 5
Figure 5. Polymerization of actin filaments
PC3 cells were seeded onto coverslips and (A) co-transfected with miR-125a-3p and GFP (bottom panel; green) or with empty miR-Vec and GFP (control; top panel; green). Cells were fixed 48 hours later and processed for F-actin staining using FITC-conjugated phalloidin (red). The arrows point at the actin cytoskeleton in the cell. Bar = 50μm. (B) co-transfected with miR-125a-3p and GFP (green; a.), fixed 48 hours later and stained with anti-paxillin antibody (blue; c; arrows point at focal adhesion sites) and anti F-actin FITC-conjugated phalloidin (red;b; arrow points at actin filaments). Merge (d.).
Figure 6
Figure 6. miR-125a-3p expression is reduced in human prostate cancer
The expression of miR-125a-3p was studied in Formalin-Fixed, Paraffin-Embedded (FFPE) human prostate cancer samples. Prostate tissues of patients with histologically confirmed prostate cancer stored at the Department of Pathology at the Rabin Medical Center were included in the study. Only tissue samples containing more than 50% tumor and larger than 0.5 cm in diameter that enable analysis of both tumor and its adjacent normal tissue were used in this study. miRNAs were extracted and purified from FFPE tissues by the FFPE extraction kit (Qiagen). The results, of 17 patients, are presented as the fold change of the expression of miR-125a-3p in tumor sample compared to its normal control (non pathologic sample). Low risk - Gleason 6, intermediate risk - Gleason 7, high risk- Gleason 8-10. Each column represents one patient. p<0.05 using Wilcoxon test, P value is statistically significant for difference between high and intermediate and low Gleason score.

Comment in

References

    1. Parsons SJ, Parsons JT. Src family kinases, key regulators of signal transduction. Oncogene. 2004;23(48):7906–7909. - PubMed
    1. Thomas SM, Brugge JS. Cellular functions regulated by Src family kinases. Annu Rev Cell Dev Biol. 1997;13:513–609. - PubMed
    1. Tang X, Feng Y, Ye K. Src-family tyrosine kinase fyn phosphorylates phosphatidylinositol 3-kinase enhancer-activating Akt, preventing its apoptotic cleavage and promoting cell survival. Cell Death Differ. 2007;14(2):368–377. - PubMed
    1. Prag S, Lepekhin EA, Kolkova K, Hartmann-Petersen R, Kawa A, Walmod PS, Belman V, Gallagher HC, Berezin V, Bock E, Pedersen N. NCAM regulates cell motility. J Cell Sci. 2002;115:283–292. Pt 2. - PubMed
    1. Cai H, Smith DA, Memarzadeh S, Lowell CA, Cooper JA, Witte ON. Differential transformation capacity of Src family kinases during the initiation of prostate cancer. Proc Natl Acad Sci U S A. 2011;108(16):6579–6584. - PMC - PubMed