

Review
doi: 10.1021/cr500452k.
Epub 2015 Jan 16.
Protein lysine acetylation by p300/CBP
Affiliations
- PMID: 25594381
- PMCID: PMC4378506
- DOI: 10.1021/cr500452k
Item in Clipboard
Review
Protein lysine acetylation by p300/CBP
Chem Rev.
.
Erratum in
-
Correction to Protein Lysine Acetylation by p300/CBP.Chem Rev. 2016 Jul 27;116(14):8314. doi: 10.1021/acs.chemrev.6b00351. Epub 2016 Jun 15. Chem Rev. 2016. PMID: 27304234 Free PMC article. No abstract available.
No abstract available
Figures
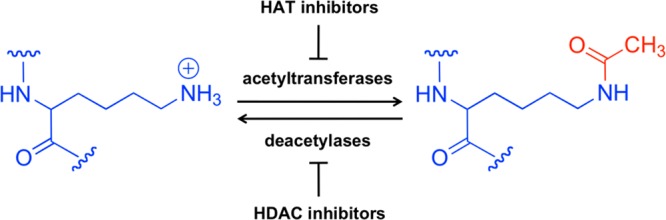
Reversible acetylation of the epsilon amine group of lysine side
chains.
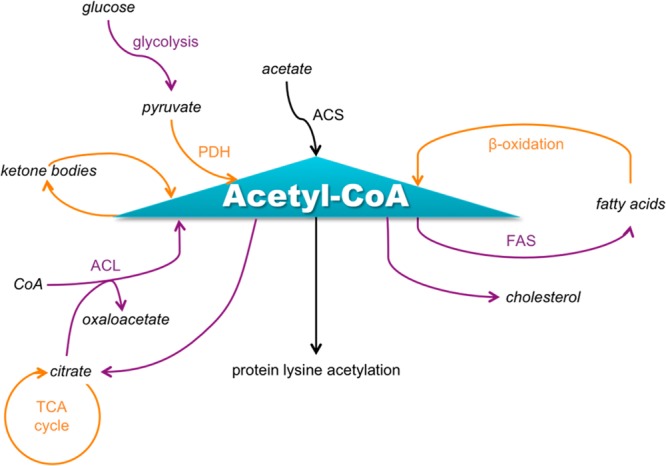
Major
metabolic processes that produce or consume acetyl-CoA. Processes
occurring in the cytoplasm are indicated using purple font, and processes
occurring in the mitochondrion are indicated using orange font. Note
that PDH can also be nuclear. This figure was adapted in part from
Albaugh et al.
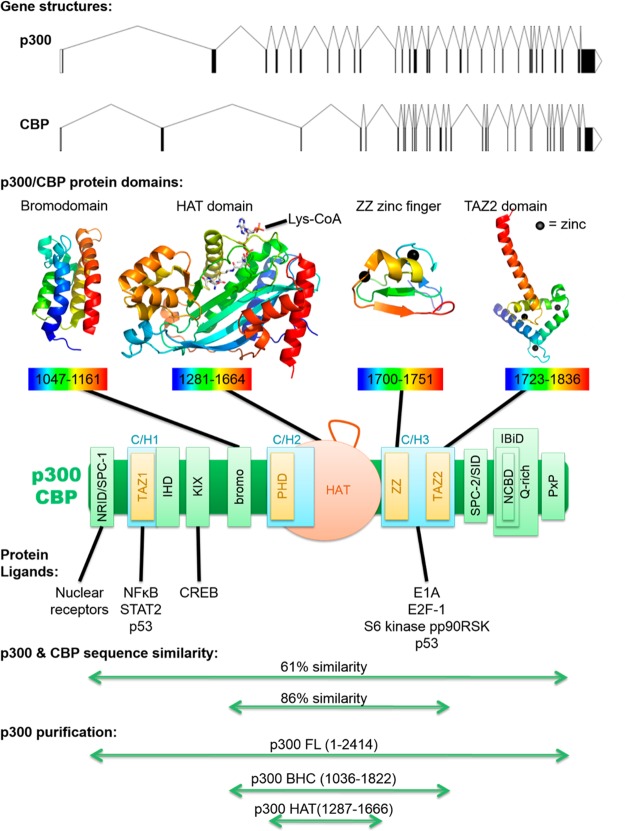
Domain structure
of p300/CBP. Exon–intron gene diagrams
are shown for p300 and CBP (top). Below are example protein structures
for the bromodomain (PDB 3I3J, 2.33 Å), catalytic HAT domain (PDB 3BIY, 1.7 Å), ZZ
zinc finger (PDB 1TOT), and TAZ2 domain (PDB 3IO2, 2.5 Å). All structures were produced using purified
p300, except the ZZ zinc finger, which used purified CBP. p300/CBP
proteins are colored with a rainbow, with blue at the N-terminus and
red at the C-terminus, and residues included in the structure are
listed below each. Zinc ions are black spheres. All structures are
based on X-ray crystallography, except the ZZ zinc finger structures
from solution NMR. The p300 bromodomain structure shown here is remarkably
similar to an independently generated CBP bromodomain structure (not
shown, PDB 3DWY, 1.98 Å). Below is a model for full-length p300/CBP with all
domains shown, and is a compilation based on several recent analyses.:, three cysteine/histidine-rich (C/H) domains are shown in turquoise,
three zinc fingers are shown in yellow, and the catalytic acetyltransferase
domain is shown in orange, with its autoacetylated regulatory loop
drawn above, which corresponds to residues 1523–1554. A few
examples of proteins that bind p300/CBP are listed below the protein
model, with the particular domain involved in binding indicated with
a black line. Below that, amino acid similarity is indicated, for
comparing p300 and CBP sequences within either the catalytic BHC region
(from the bromodomain to the C/H3 domain) or the entire protein. At
the bottom, commonly purified active p300 variants are indicated,
including p300 acetyltransferase/HAT domain, BHC enzyme (bromodomain-HAT-C/H3),
and full-length protein. It should be noted that p300 HAT has a deletion
in residues 1529–1560.
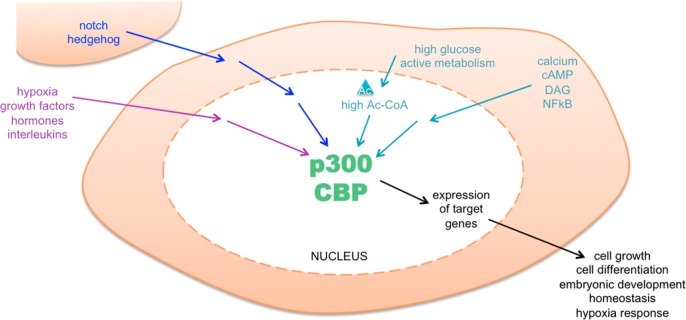
p300/CBP is central to
many important signaling pathways. These
include pathways that respond to intracellular signals (turquoise),
extracellular signals (purple), and intercellular signals (blue).
These pathways control the key cellular functions via altering expression
of target genes, through the action of p300/CBP in the nucleus.
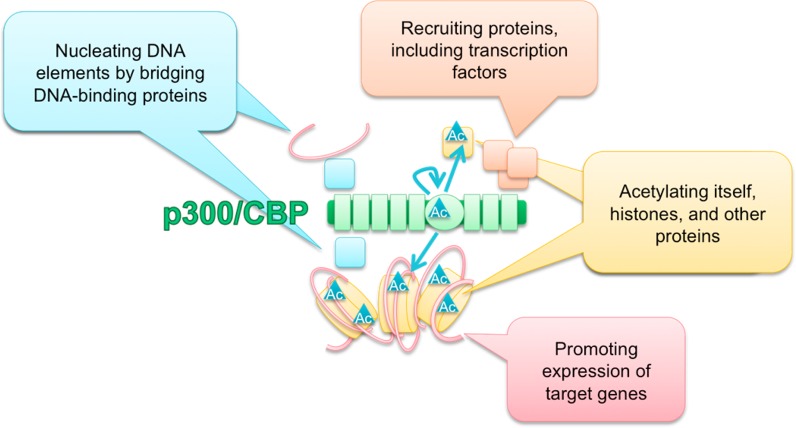
p300/CBP
functions as a scaffold, bridge, and acetyltransferase.
The acetyltransferase reactions are illustrated by turquoise arrows,
indicating acetylation of histone and nonhistone substrates (in yellow),
as well as autoacetylation of the p300/CBP acetyltransferase domain.
The bridge function is illustrated by turquoise squares, representing
DNA-binding proteins that bring DNA elements into proximity with p300/CBP
through their interactions. The scaffold function is illustrated by
orange squares, representing a protein complex being recruited by
p300/CBP. These functions together allow for gene expression.
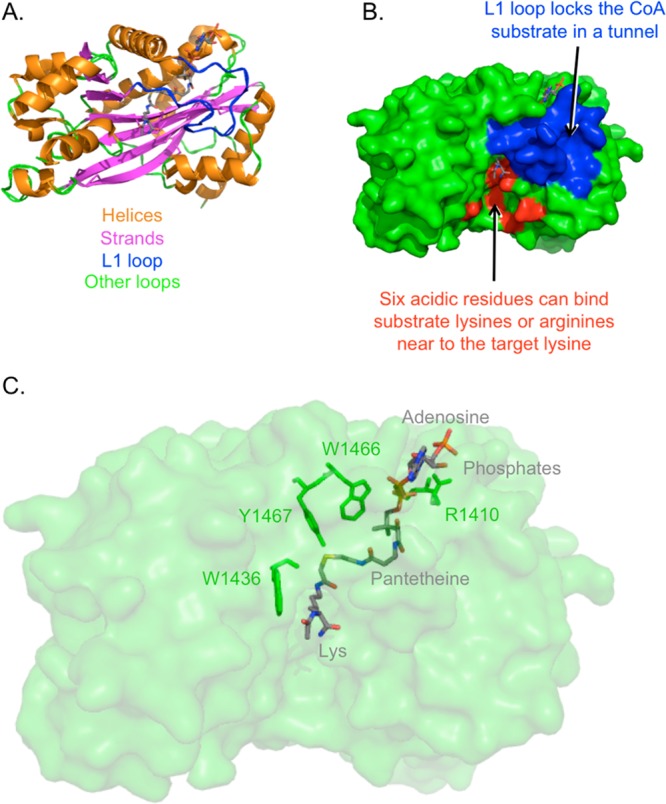
p300 acetyltransferase
domain structure bound to Lys-CoA. (A) Secondary
structures of p300 acetyltransferase domain. (B) L1 loop and an acidic
surface. (C) Parts of Lys-CoA bisubstrate analog (gray) and four p300
residues of interest (green). Generated in PyMol based on Protein
Databank entry 3BIY, published by Liu et al.
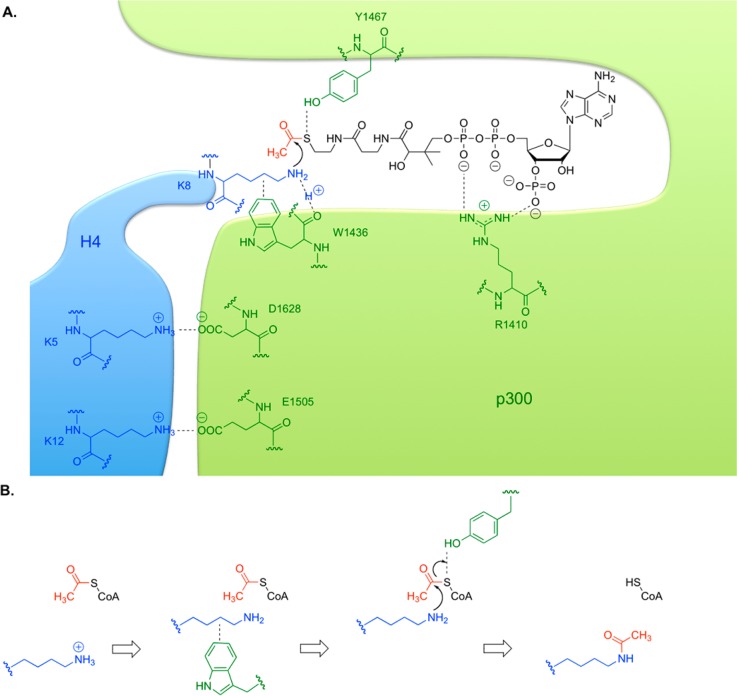
Acetyl transfer catalysis by p300. (A) The p300 active site is
drawn in green, and histone H4 substrate in blue, with important residues
indicated. CoA is drawn in black, and binds in a specific tunnel.
(B) Four steps in a proposed p300 mechanism. acetyl-CoA binds, then
peptidyl-lysine binds. The hydrophobic indole of W1436 promotes an
uncharged lysine and positions it for attack. The lysine attacks the
carbonyl of acetyl-CoA, while Y1467 acts as a general acid to protonate
the leaving group. Acetyl-lysine-containing product leaves quickly,
then CoASH departs slowly.
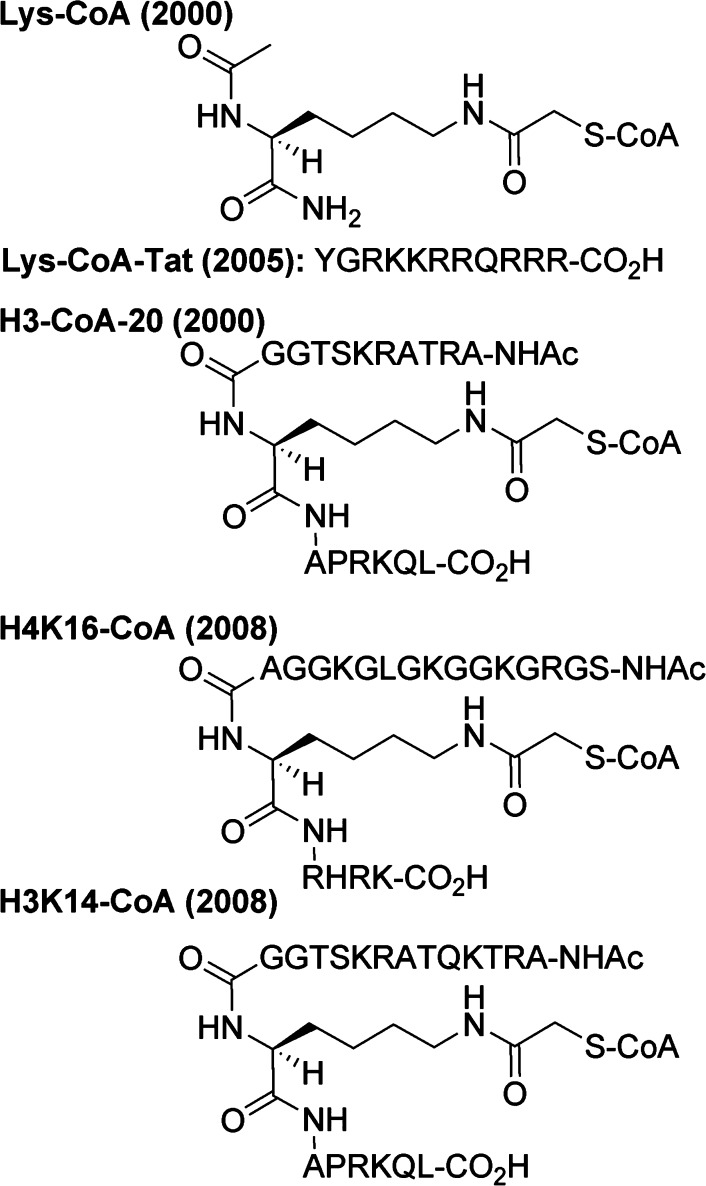
Bisubstrate inhibitors of acetyltransferases.
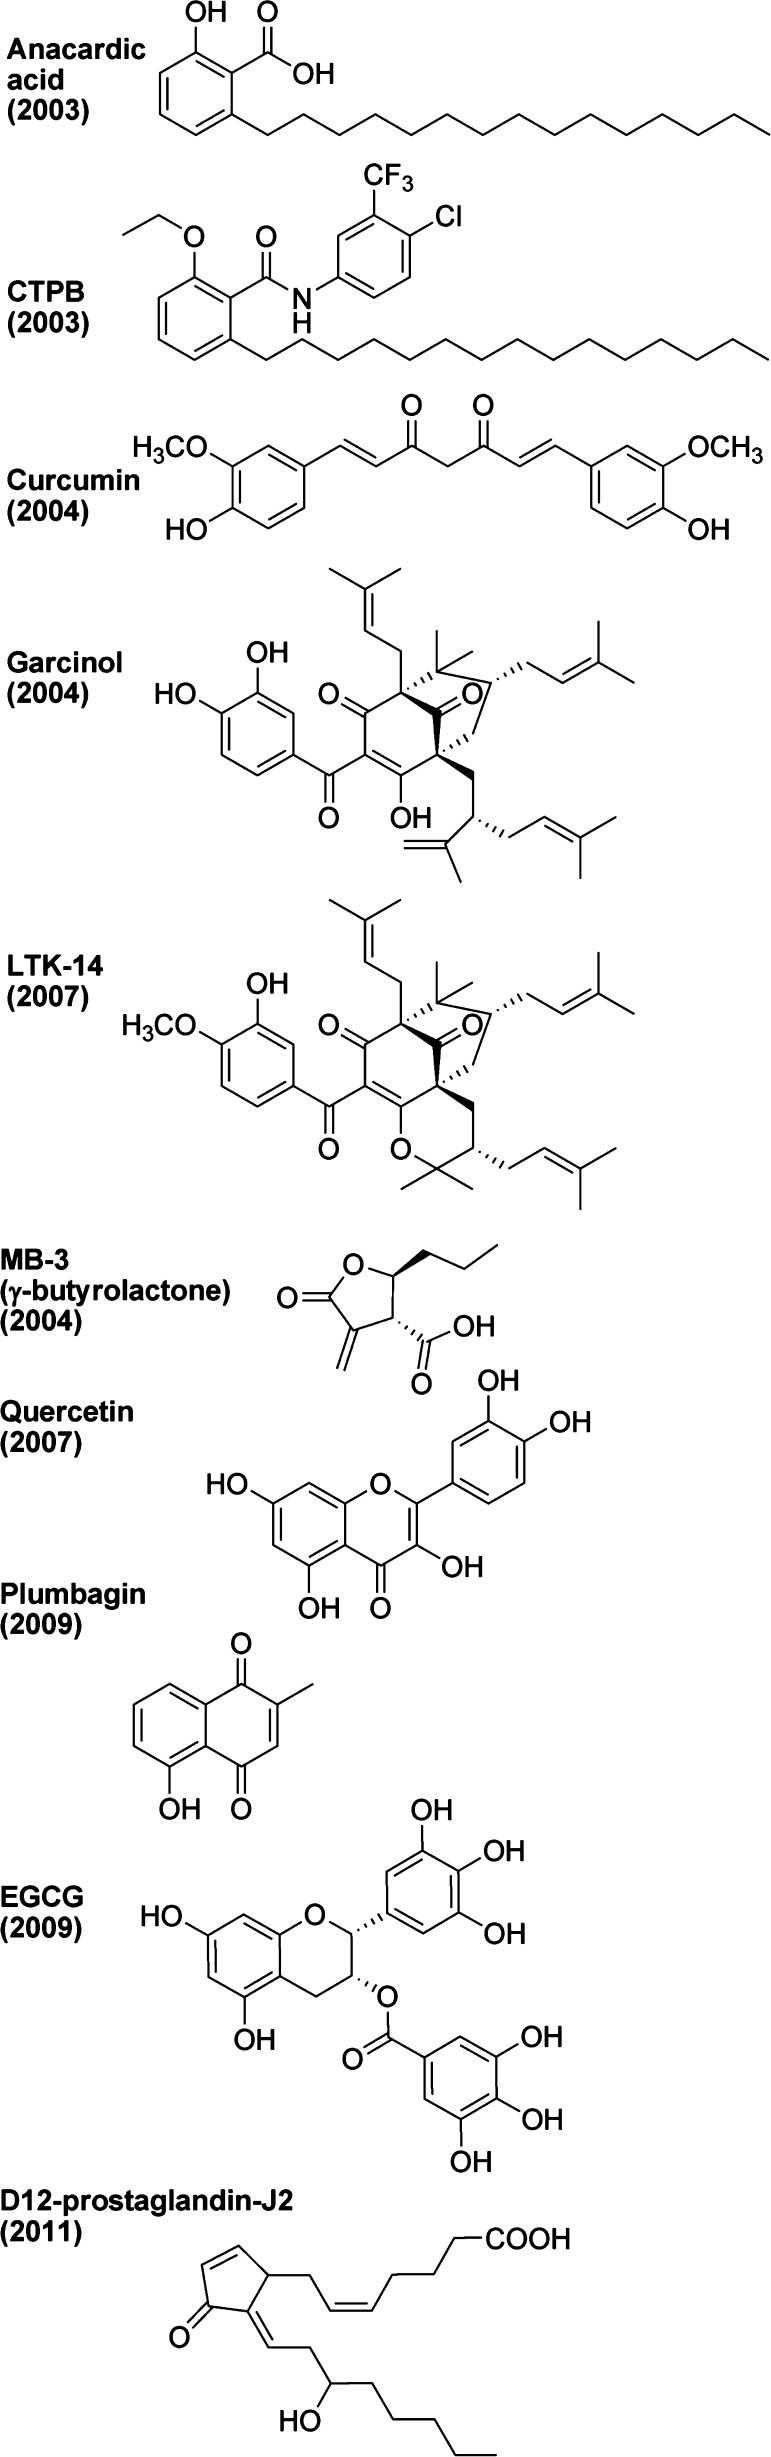
Natural products implicated
as modulators of acetyltransferases.
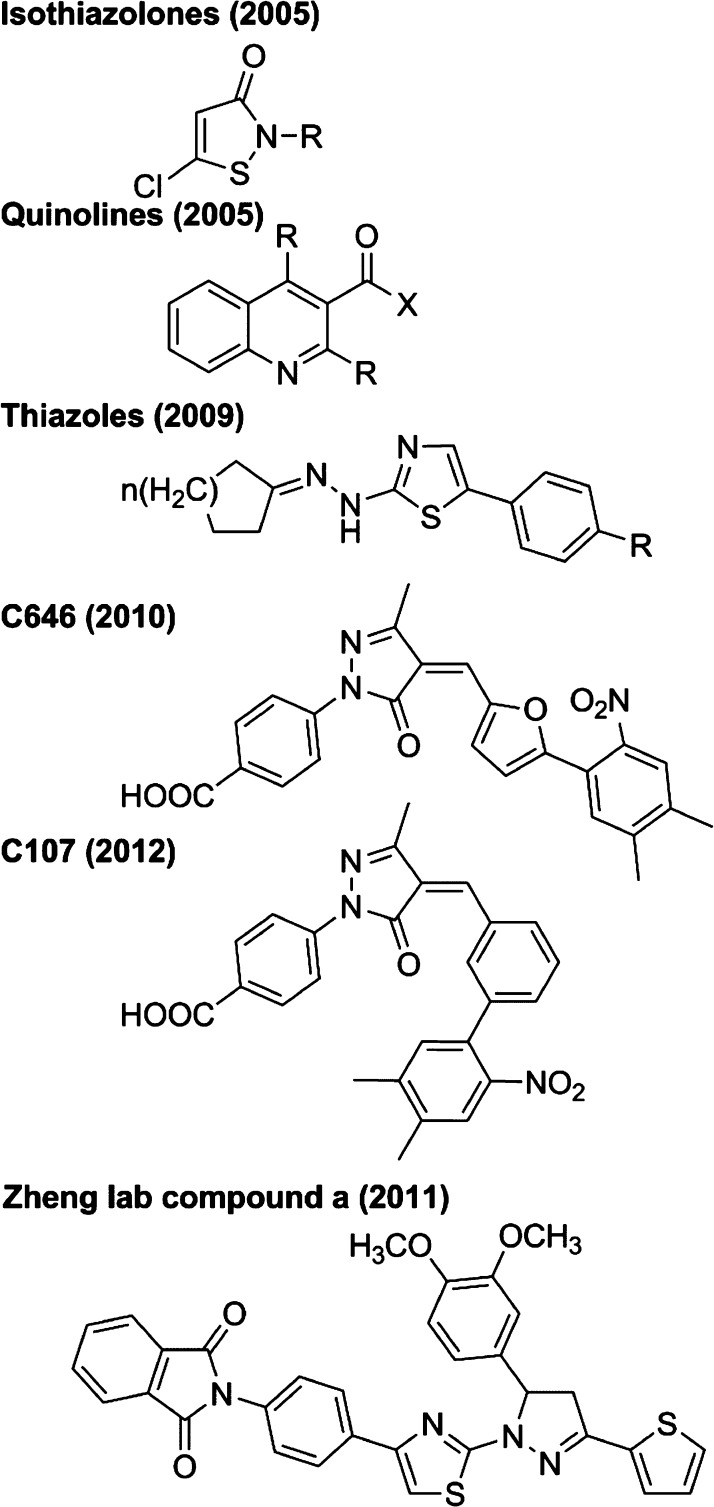
Synthetic inhibitors
of acetyltransferases.
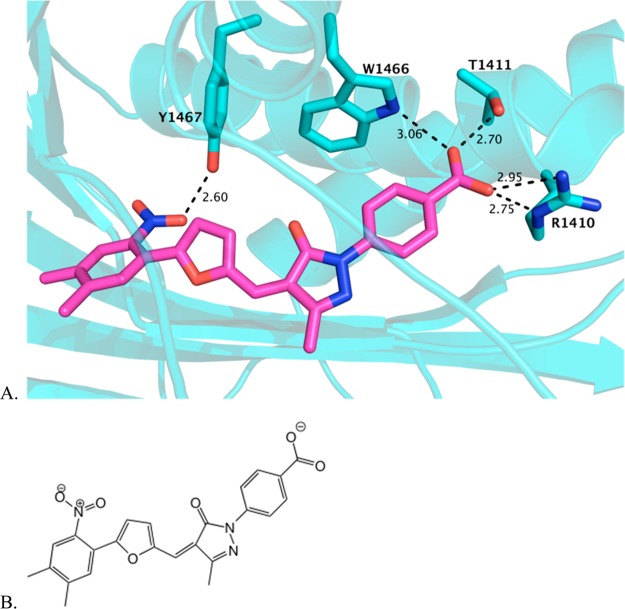
C646 modeled in the acetyltransferase active site. (A) C646 is
shown in magenta, computationally docked in the crystal structure
of the acetyltransferase active site, which was generated as a cocrystal
with Lys-CoA. Several residues that coordinate CoA binding are predicted
to similarly coordinate C646 binding, as shown in aqua stick representations
of the side chains. (B) The structure of C646, shown in an orientation
similar to that in the docked model above.
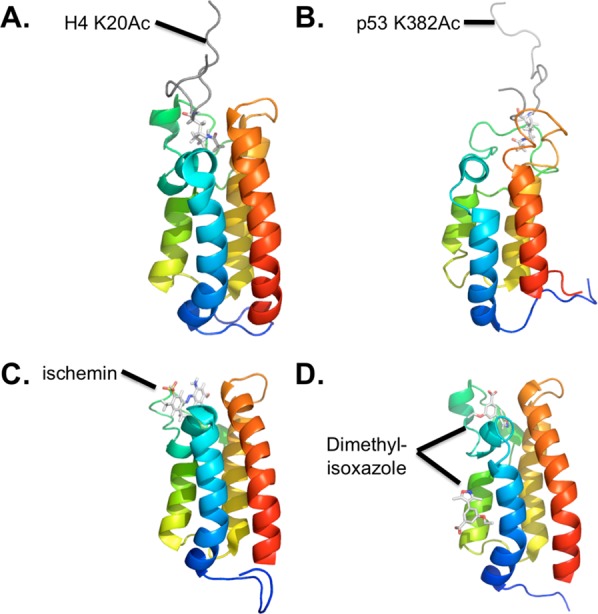
Structures of CBP bromodomain bound to ligands.
The purified CBP
bromodomain (residues 1081–1197, shown in a rainbow blue to
red) is shown bound to (A) histone H4 residues 14–28 acetylated
at K20 (PDB 2RNY); (B) p53 residues 367–386 acetylated at K382 (PDB 1JSP); (C) the compound
ischemin (PDB 2L84); and (D) the compound dimethylisoxazole (PDB 3SVH). Peptide ligands
are shown in gray (A,B) or stick models colored by atom (C,D and acetyl-lysines
in A,B). All structures are based on solution NMR except for (D),
which is from X-ray crystallography (1.8 Å).
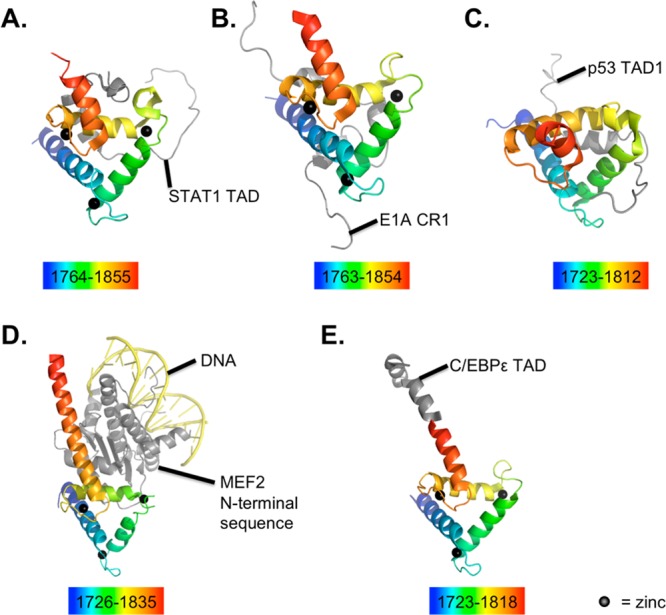
Structures of p300/CBP TAZ2 domain bound to ligands. The TAZ2 domain
is shown colored in a rainbow (blue to red, residues included listed
below each) bound to various ligands: STAT1 (A, PDB 2KA6); E1A (B, PDB 2KJE); p53 (C, PDB 2K8F); MEF2-DNA complex
(D, PDB 3P57), and C/EBPε (PDB 3T92). All structures are based on solution NMR except
for two from X-ray crystallography: that in (D) (2.192 Å) and
that in (E) (1.5 Å). All structures were produced using purified
p300, except the (A) and (B), which used purified CBP. Zinc ions are
black spheres, protein ligands are gray, and DNA is yellow. The crystal
structure with MEF2 revealed binding in three possible conformations
with TAZ2, and one example is shown here.
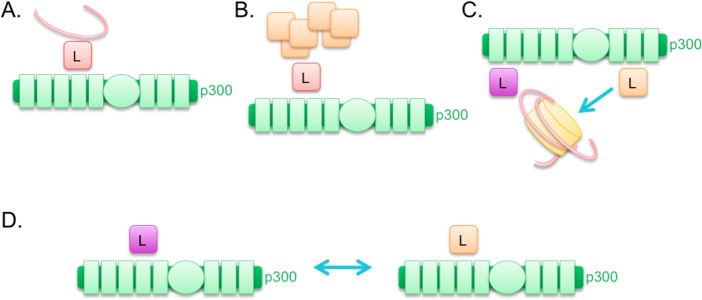
Models for
targeting influenced by p300-ligand binding. In these
models, p300 is shown in green, the histone octamer is shown in yellow,
DNA is shown with a red strand, and p300 ligands are indicated with
an “L”. In (A), a ligand targets p300 to a gene or other
DNA element due to the DNA binding affinity of the ligand. In (B),
a ligand targets p300 to a protein complex due to the protein binding
affinity of the ligand. In (C), two ligands bridged by p300 allow
for chromatin (bound by the purple ligand) to come into proximity
with a chromatin-modifying enzyme (the orange ligand). In (D), two
ligands compete for the same site within p300, and the one ligand
could be seen as a competitive inhibitor for the p300 association
with the other.
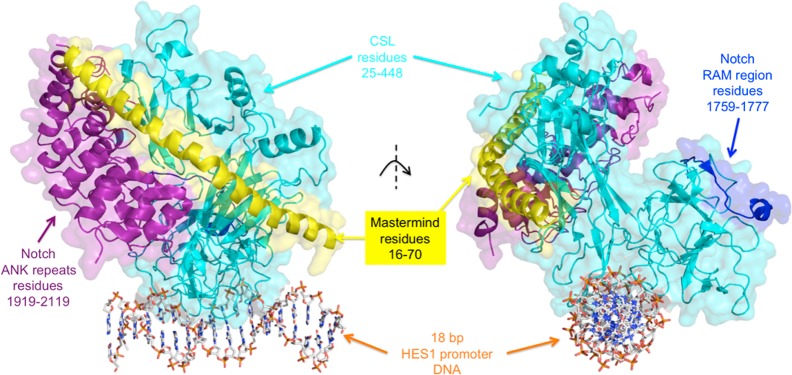
Mastermind-Notch-CSL-DNA
core complex. The complex formed by DNA,
CSL, Notch (ANK repeats and RAM region purified separately), and Mastermind
N-terminal helix is shown with two different view angles. The X-ray
crystal structure was generated at 3.85 Å, and this figure was
produced in PyMol using Protein Databank entry 3V79. Proteins are shown
as ribbons, with the surfaces at 70% transparency. DNA is shown as
stick models colored by atom.
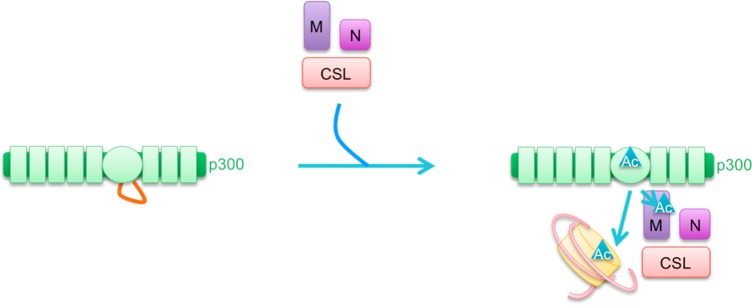
Model for Mastermind
activation of p300. In this model, p300 (green)
initially has inhibited acetyltransferase activity due to an autoinhibitory
loop (orange, left). This is relieved upon recruitment by the Notch-Mastermind-CSL
complex. Mastermind (purple) binds to the p300 C/H3 domain, and also
to Notch intracellular domain (magenta) and CSL (red). p300 autoacetylation,
Mastermind acetylation, and histone acetylation are then catalyzed
by p300 (turquoise ▲).
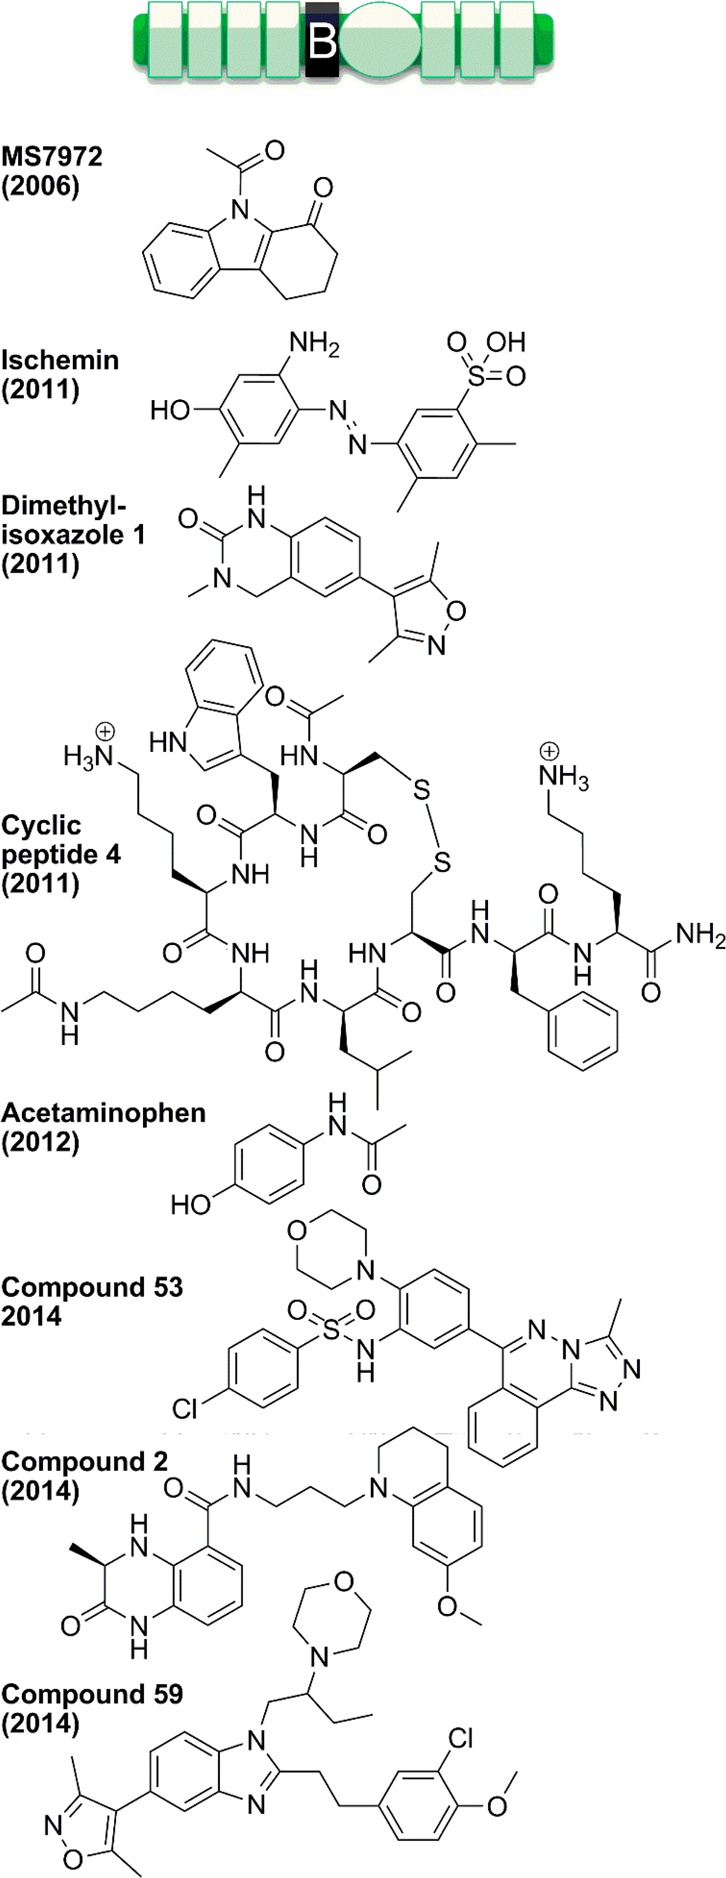
Inhibitors of the p300/CBP bromodomain.
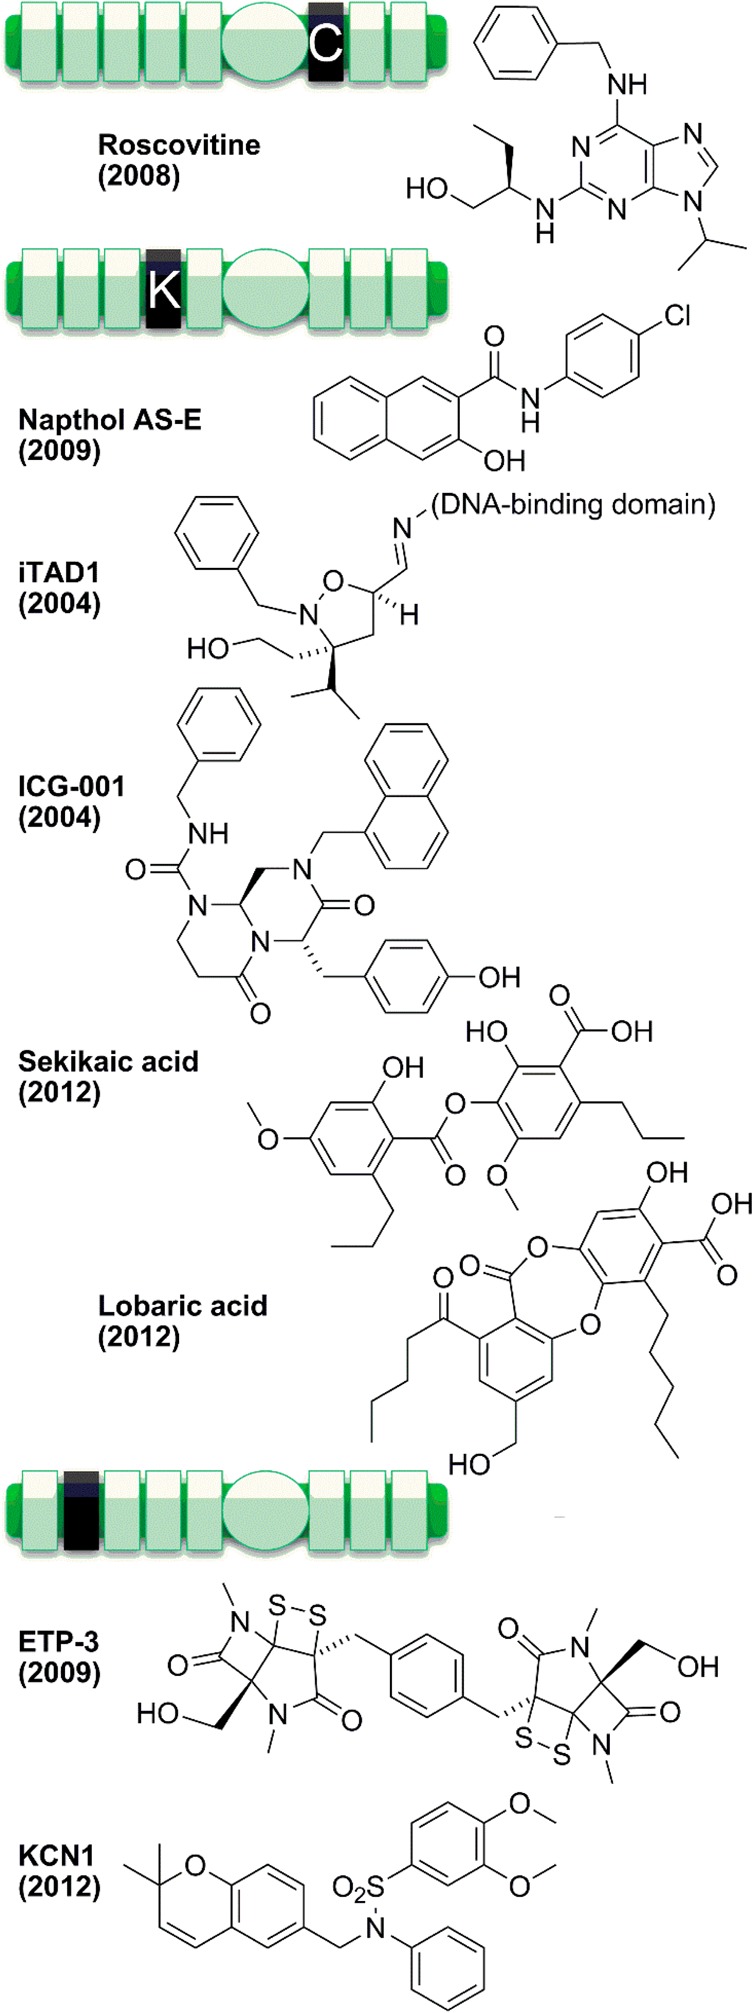
Inhibitors of the other p300/CBP domains.
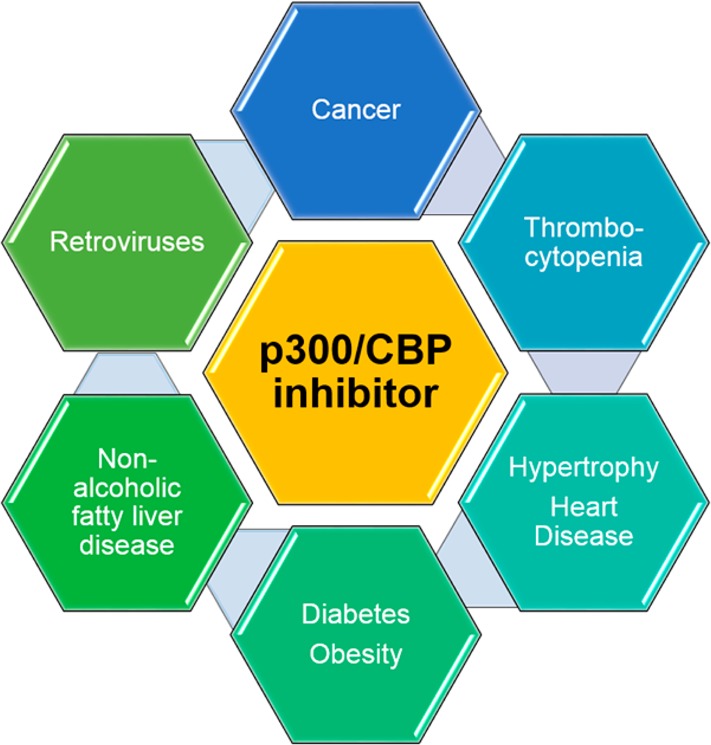
Diseases of potential
therapeutic application for a p300/CBP inhibitor.
No p300/CBP inhibitor has yet made it into clinical trials, but the
biology of p300/CBP action and documented effects of p300/CBP disruption
lead us to hypothesize a beneficial therapeutic potential for a p300/CBP
inhibitor in many diseases.
References
-
- Waddington C. H. Endeavour 1942, 18.
-
- Klar A. J. Trends Genet. 1998, 14, 299. - PubMed
-
- Redon C.; Pilch D.; Rogakou E.; Sedelnikova O.; Newrock K.; Bonner W. Curr. Opin. Genet. Dev. 2002, 12, 162. - PubMed
-
- Dawson M. A.; Kouzarides T. Cell 2012, 150, 12. - PubMed
-
- Mukherjee S.; Hao Y. H.; Orth K. Trends Biochem. Sci. 2007, 32, 210. - PubMed
Publication types
MeSH terms
Substances
Grants and funding
LinkOut - more resources
Full Text Sources
Other Literature Sources
Miscellaneous
