. 2015 Mar;14(3):707-23.
doi: 10.1074/mcp.M114.044016. Epub 2015 Jan 16.

Monitoring interactions and dynamics of endogenous beta-catenin with intracellular nanobodies in living cells

Affiliations

Monitoring interactions and dynamics of endogenous beta-catenin with intracellular nanobodies in living cells

Bjoern Traenkle et al. Mol Cell Proteomics. 2015 Mar.

Abstract

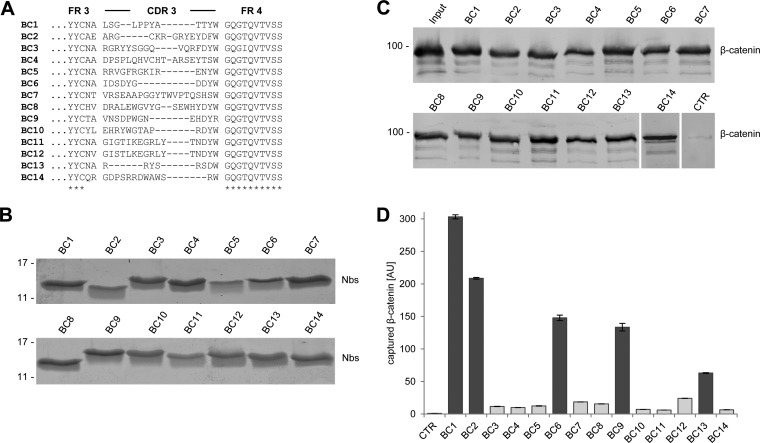
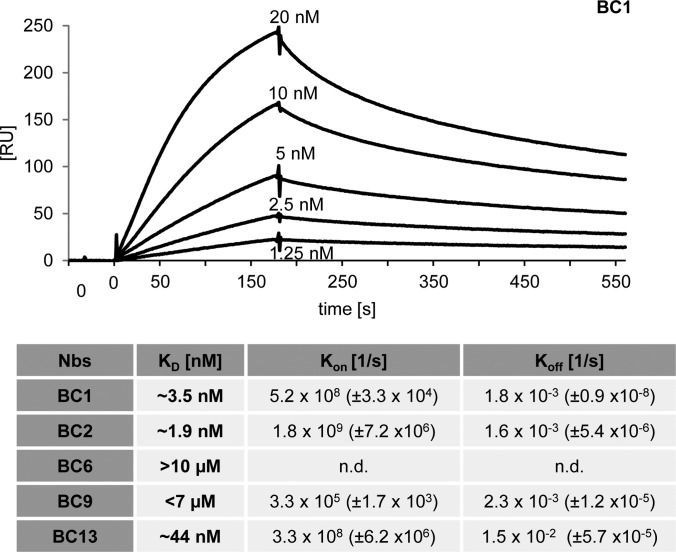
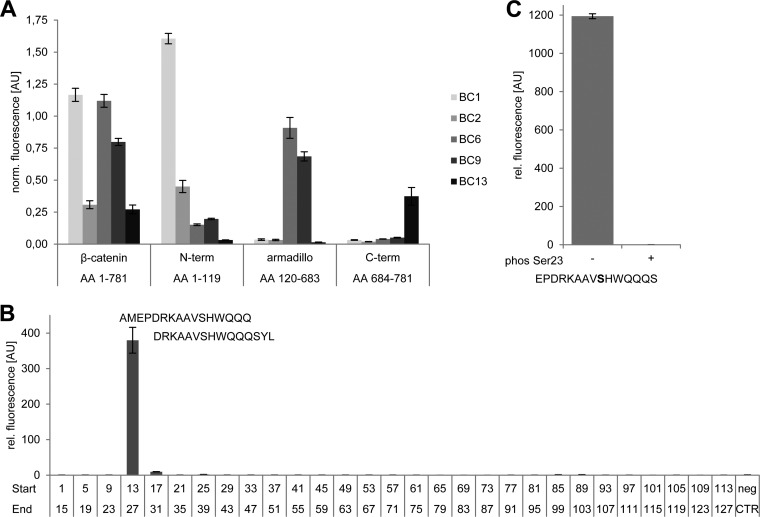
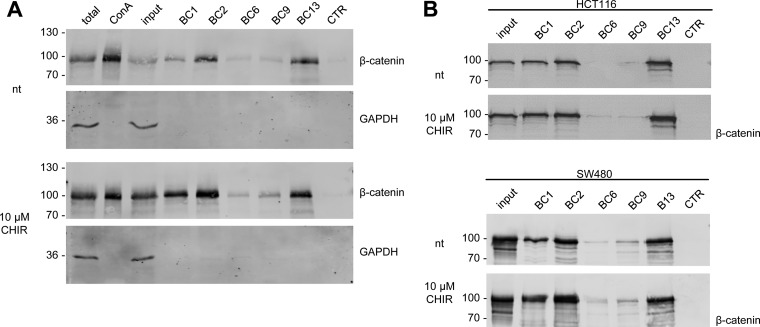
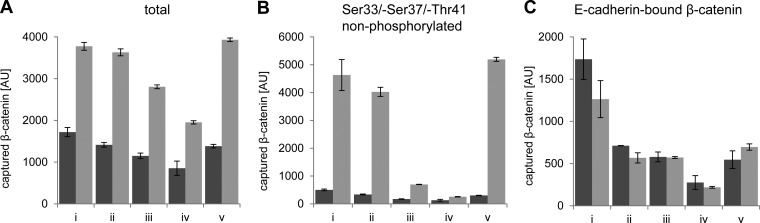
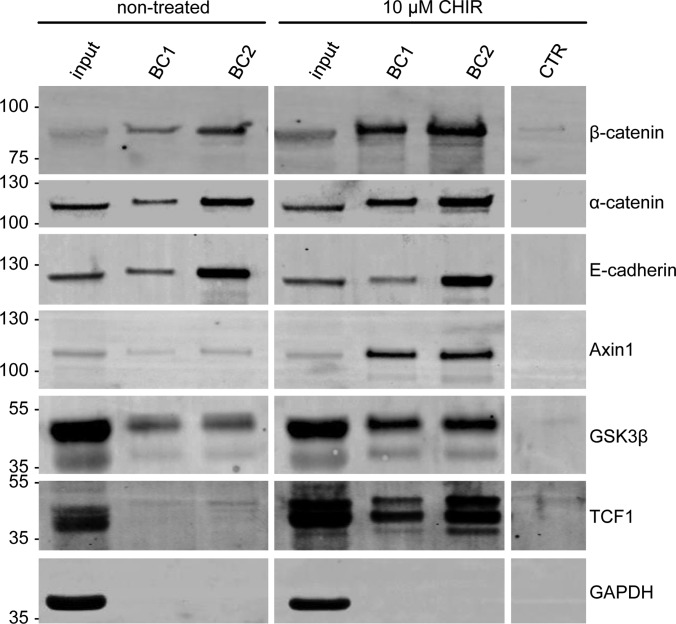
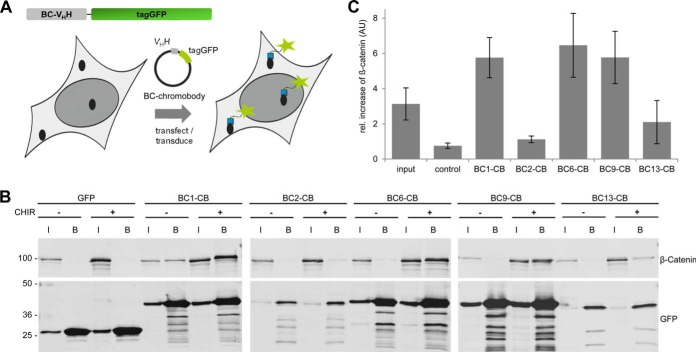
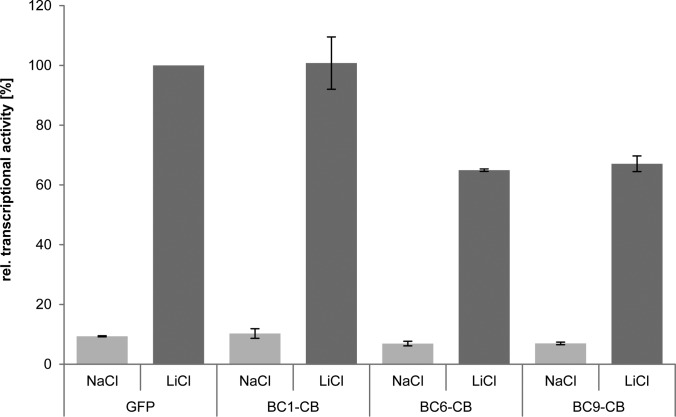
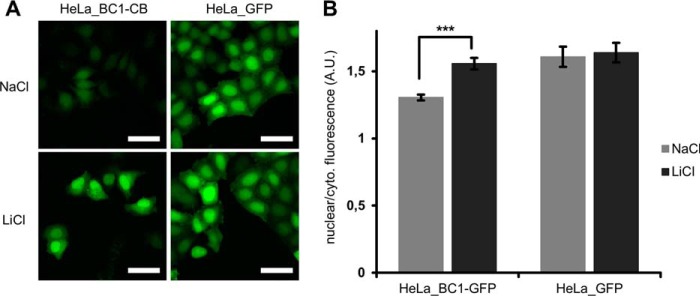
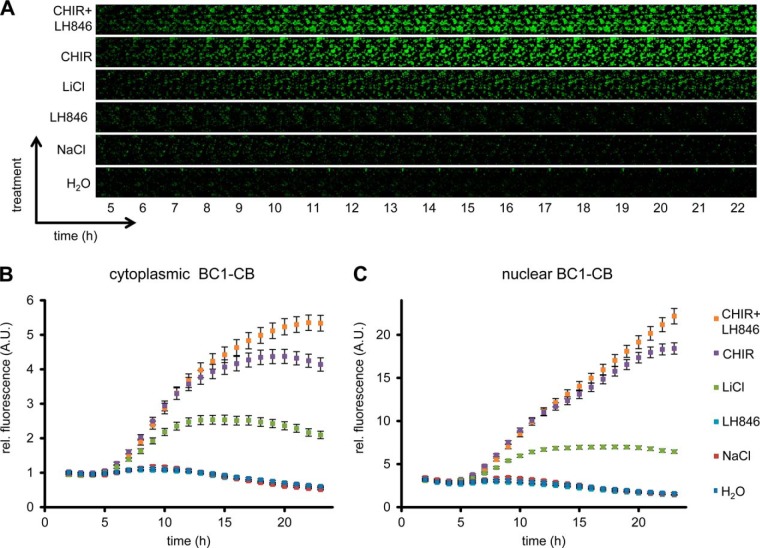
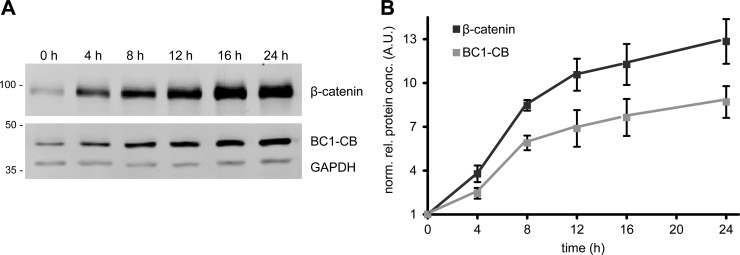
β-catenin is the key component of the canonical Wnt pathway and plays a crucial role in a multitude of developmental and homeostatic processes. The different tasks of β-catenin are orchestrated by its subcellular localization and participation in multiprotein complexes. To gain a better understanding of β-catenin's role in living cells we have generated a new set of single domain antibodies, referred to as nanobodies, derived from heavy chain antibodies of camelids. We selected nanobodies recognizing the N-terminal, core or C-terminal domain of β-catenin and applied these new high-affinity binders as capture molecules in sandwich immunoassays and co-immunoprecipitations of endogenous β-catenin complexes. In addition, we engineered intracellularly functional anti-β-catenin chromobodies by combining the binding moieties of the nanobodies with fluorescent proteins. For the first time, we were able to visualize the subcellular localization and nuclear translocation of endogenous β-catenin in living cells using these chromobodies. Moreover, the chromobody signal allowed us to trace the accumulation of diffusible, hypo-phosphorylated β-catenin in response to compound treatment in real time using High Content Imaging. The anti-β-catenin nanobodies and chromobodies characterized in this study are versatile tools that enable a novel and unique approach to monitor the dynamics of subcellular β-catenin in biochemical and cell biological assays.


Figures

Fig. 1.
Fig. 1.
Selection of nanobodies (Nbs) against β-catenin. A, Amino acid sequences of the complementarity determining region 3 from unique Nbs selected after two rounds of biopanning are shown. B, Recombinant expression and purification of Nbs. Coomassie staining of 1–2 mg of purified Nbs is shown. C, Precipitation of recombinant β-catenin with Nbs. Soluble lysate of β-catenin-expressing bacteria was incubated with Nbs immobilized on Sepharose beads. Bound fractions were subjected to SDS-PAGE followed by immunoblot analysis using a β-catenin-specific antibody, CTR: pulldown with nonrelated Nb. D, Microsphere-based sandwich immunoassay using β-catenin-specific Nbs as capture molecules. Nbs were immobilized on microspheres and incubated with increasing β-catenin concentrations ranging from 0.25 μg/ml to 2 μg/ml. Bound protein was detected with an anti-β-catenin antibody. Background level of control Nb was set to one. Shown are mean signal intensities of three independent replicates ± stds. Binding values of the five best Nbs are highlighted in dark gray.
Fig. 2.
Fig. 2.
Nanobodies bind β-catenin with high affinities. For surface plasmon resonance spectroscopy (SPR)-based affinity measurements, β-catenin was covalently coupled on a CM5-chip. Kinetic measurements were performed by injecting five concentrations of purified Nbs ranging from 0.625 nm to 5 μm. The obtained data sets were evaluated using the 1:1 Langmuir binding model. As an example the sensogram of the BC1 nanobody at indicted concentrations is shown. The table summarizes affinities (KD), association (Kon) and dissociation constants (Koff) determined for individual Nbs.
Fig. 3.
Fig. 3.
Nanobodies bind distinct domains of β-catenin. A, Microsphere-immobilized Nbs were incubated with GST-fusion constructs comprising full-length β-catenin or indicated domains. Captured β-catenin constructs were detected with domain-specific antibodies. For direct comparison, fluorescence intensities obtained with domain-specific antibodies were normalized to signals obtained with an anti-GST-antibody. B, Identification of the epitope recognized by BC2. In a peptide screen 29 overlapping 15-mer peptides covering the N terminus from aa 1–127 of β-catenin were immobilized on microspheres with varying IDs per peptide and incubated with biotinylated BC2. Peptide-bound BC2 was detected with streptavidin-phycoerythrin (PE) solution. The Myc-peptide (EKLISEEDL) was used as negative control (neg CTR). C, Phosphorylation of the epitope abolishes binding by BC2. Binding analysis of BC2 to a peptide representing aa 15–29 with (+) or without (−) a phosphorylated Ser23 (phos Ser23) was performed as described in B. Columns represent mean signal intensities of three independent experiments ± stds.
Fig. 4.
Fig. 4.
Nanobodies bind endogenous β-catenin. A, HEK293T cells were either left untreated (nt) or were incubated with CHIR (GSK3β-inhibitor) for 24 h. Cells were lysed under native conditions and membrane-bound fraction was depleted using Concanavalin A (ConA)-beads. Depleted supernatants were adjusted to 2 mg/ml and incubated with equal amounts of immobilized Nbs. Bound protein fractions were subjected to SDS-PAGE followed by immunoblot analysis using antibodies specific for β-catenin and GAPDH. Total: 0.5% of total lysate; ConA: 2.5% of ConA-bound fraction; input: 0.5% of ConA-depleted supernatant; BC1–BC13: 10% of Nb-bound fraction, CTR: 10% of bound fraction of a nonrelated Nb. Shown are representative blots of three independent experiments. B, Precipitation of β-catenin with immobilized Nbs as described in A from membrane-depleted lysates derived from HCT116 cells (upper panel) or SW480 cells (lower panel). Cells were either left untreated (nt) or were incubated with CHIR for 24 h. Immunoblot analysis of input and bound fraction with anti-β-catenin antibody is shown.
Fig. 5.
Fig. 5.
BC1 and BC2 preferentially bind nonphosphorylated β-catenin. HEK293T cells were treated with (bars in gray) and without CHIR for 24 h (bars in dark gray). Cells were lysed under native conditions. Soluble cell lysates (1 mg/ml) were incubated with ConA (ii), ConA and BC1 (iii), ConA and BC2 (iv), and ConA and a nonrelated Nb (v) to deplete different fractions of β-catenin. Ten micrograms of depleted fractions were subjected to a multiplex bead-based immunoassay capturing total A, Ser33/-Ser37/-Thr41 nonphosphorylated β-catenin, B, or E-cadherin/β-catenin complex C. Bound β-catenin in the total lysate (i) and the individual supernatants of the different depleted fractions (ii–v) was detected with an anti-β-catenin antibody. Shown are mean signal intensities of three independent replicates ± stds.
Fig. 6.
Fig. 6.
Nanobodies coprecipitate interaction partners of β-catenin. HEK293T cells were either left untreated or were incubated with CHIR for 24 h. Cells were lysed under native conditions and soluble protein fractions were incubated with immobilized BC1, BC2, or a nonrelated Nb (CTR). Input and bound fractions (BC1, BC2) were subjected to SDS-PAGE and immunoblot analysis using antibodies against indicated proteins. Shown are representative results of three independent experiments.
Fig. 7.
Fig. 7.
Chromobodies bind to β-catenin upon intracellular expression. A, Schematic illustration of a BC-chromobody and its introduction into cells on DNA level. B, Intracellular immunoprecipitation (IC-IP) of β-catenin. HEK293T cells expressing indicated chromobodies or GFP were either left untreated or were incubated with CHIR for 24 h. Cells were lysed under native conditions and chromobodies and GFP were precipitated using the GFP-Trap. Input (I) and bound fraction of the GFP-Trap (B) were subjected to SDS-PAGE followed by immunoblotting using an anti-β-catenin antibody (upper panel). Chromobodies or GFP were detected using an anti-GFP antibody (lower panel). C, Relative increase of precipitated β-catenin from cells after inhibition of GSK3β. Input reflects the relative increase of total β-catenin derived from the “input”-samples normalized to GAPDH. Columns represent the ratios of three independent experiments ± stds.
Fig. 8.
Fig. 8.
Chromobodies binding the armadillo domain affect transcriptional activity of β-catenin. HEK293T cells were either cotransfected with GFP or the indicated BC-chromobodies in combination with reporter constructs containing TCF-Promoter-luciferase-reporter sites (TOP-flash) or a corresponding control construct with mutated TCF-binding sites (FOP-flash). Reporter activity of NaCl-treated cells is shown in light gray bars and LiCl-induced reporter activity is shown in dark gray bars. All values are normalized to mean luminescence values of LiCl-treated GFP control. Reporter induction after 24 h upon LiCl treatment is shown. Columns represent the results of three independent experiments ± stds.
Fig. 9.
Fig. 9.
Tracing nuclear translocation of β-catenin with the BC1-chromobody. A, HeLa_BC1-CB and HeLa_GFP cells were incubated with NaCl or LiCl. Representative images of cells after 18 h of compound treatment are shown. Scale bar = 50 μm. B, After image segmentation, mean fluorescence in cytoplasm und nuclei was determined and the ratio of nuclear to cytoplasmic fluorescence was calculated. Columns represent the mean ratio and standard deviation from five biological replicates (∼500 cells each). Highly significant increase in nuclear/cytoplasmic ratio is indicated by *** (p < 0.001, t test).
Fig. 10.
Fig. 10.
Time-lapse microscopy of compound-treated HeLa_BC1-CB cells. A, HeLa_BC1-CB cells were imaged in hourly intervals for 24 h with control treatment (H2O) or in the presence of NaCl, LiCl, LH846, CHIR, or a combination of CHIR and LH846. Time-lapse imaging of HeLa_BC1-CBs is shown for each condition starting 5 h after compound treatment. After image segmentation mean fluorescence intensity in the cytoplasm, B, and nuclei C, was determined and values of three biological replicates (∼500 cells each) were plotted against time ± standard errors.
Fig. 11.
Fig. 11.
Cellular level of BC1-chromobody correlates with endogenous β-catenin. A, Immunoblot analysis of β-catenin, BC1-CB and GAPDH of CHIR-treated HeLa_BC1-CB cells at indicated time points. B, Densitometric analysis of immunoblot analysis. Values represent the mean of four replicates ± stds.

References

    1. Takeichi M. (1995) Morphogenetic roles of classic cadherins. Curr. Opin. Cell Biol. 7, 619–627 - PubMed
    1. Korinek V., Barker N., Morin P. J., van Wichen D., de Weger R., Kinzler K. W., Vogelstein B., Clevers H. (1997) Constitutive transcriptional activation by a beta-catenin-Tcf complex in APC−/− colon carcinoma. Science 275, 1784–1787 - PubMed
    1. Behrens J., Lustig B. (2004) The Wnt connection to tumorigenesis. Int. J. Dev. Biol. 48, 477–487 - PubMed
    1. Aberle H., Bauer A., Stappert J., Kispert A., Kemler R. (1997) beta-catenin is a target for the ubiquitin-proteasome pathway. EMBO J. 16, 3797–3804 - PMC - PubMed
    1. Hart M., Concordet J. P., Lassot I., Albert I., del los Santos R., Durand H., Perret C., Rubinfeld B., Margottin F., Benarous R., Polakis P. (1999) The F-box protein beta-TrCP associates with phosphorylated beta-catenin and regulates its activity in the cell. Curr. Biol. 9, 207–210 - PubMed

Publication types

LinkOut - more resources