. 2015 Feb 15;194(4):1489-502.
doi: 10.4049/jimmunol.1401880. Epub 2015 Jan 16.

Natural IgM prevents autoimmunity by enforcing B cell central tolerance induction

Affiliations

Natural IgM prevents autoimmunity by enforcing B cell central tolerance induction

Trang T T Nguyen et al. J Immunol. .

Abstract

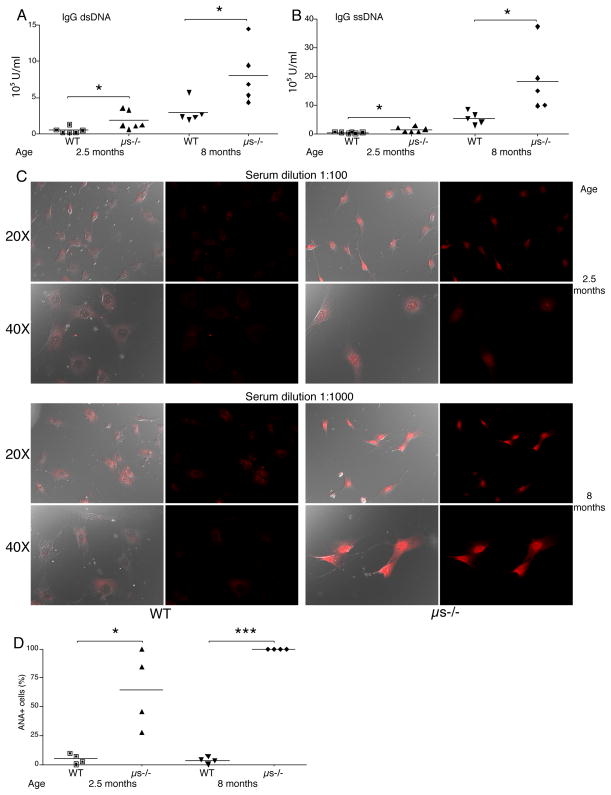
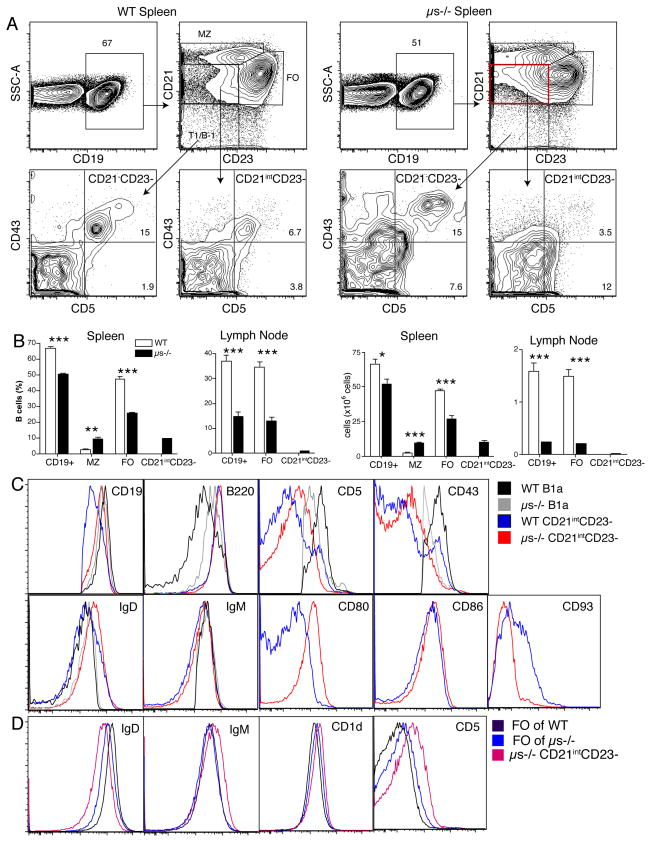
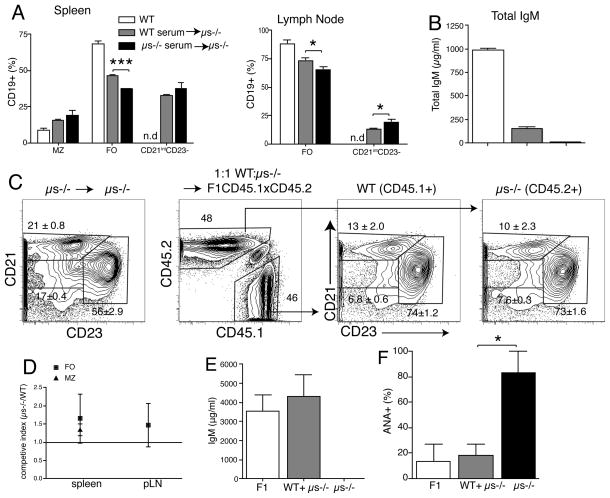
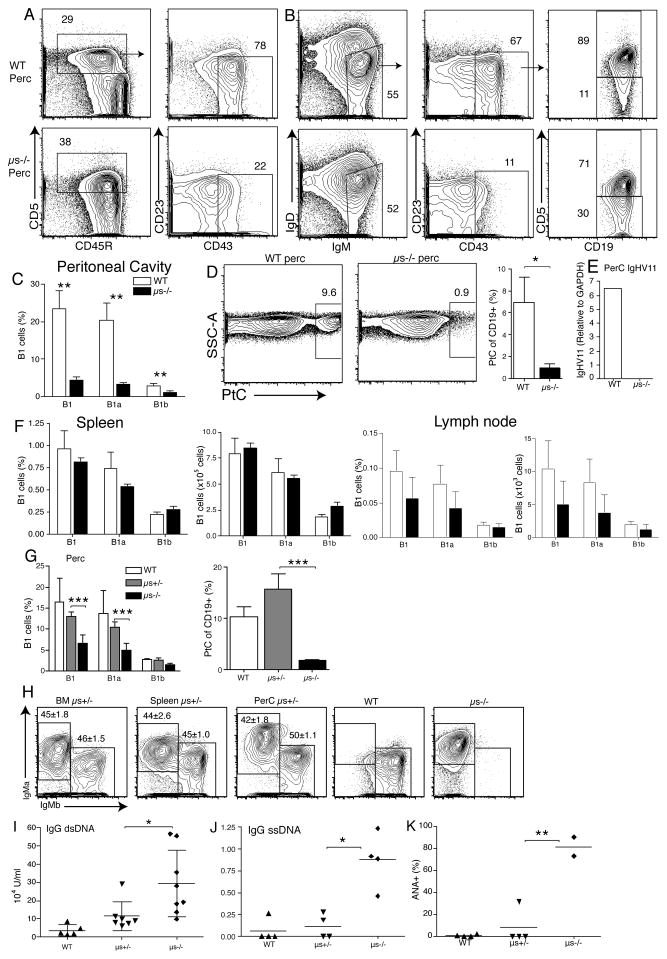
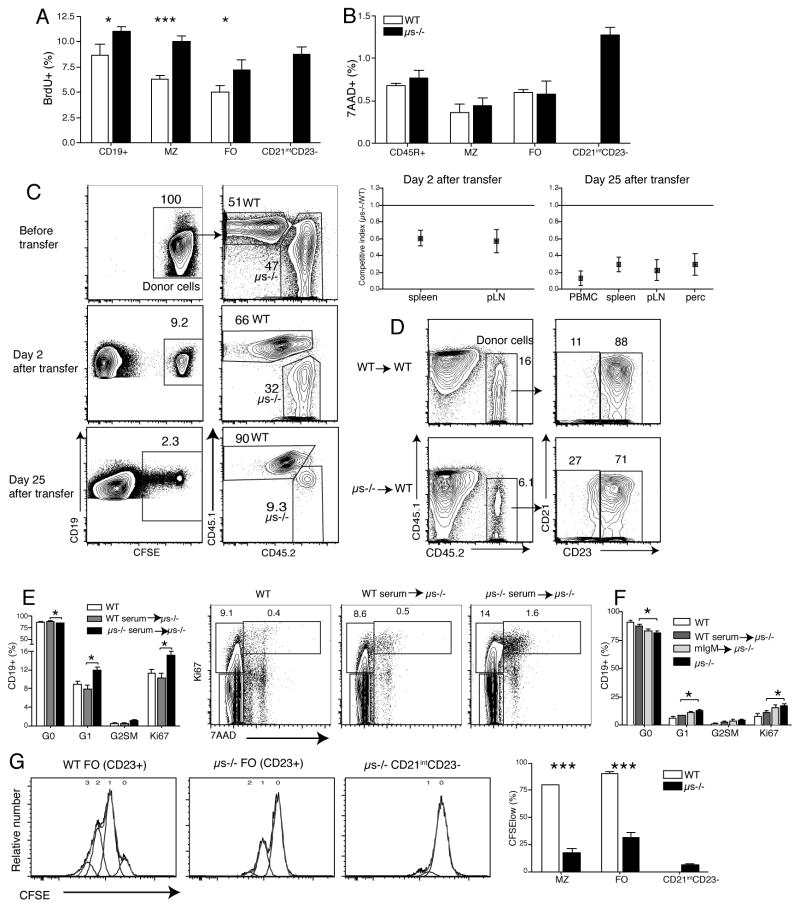
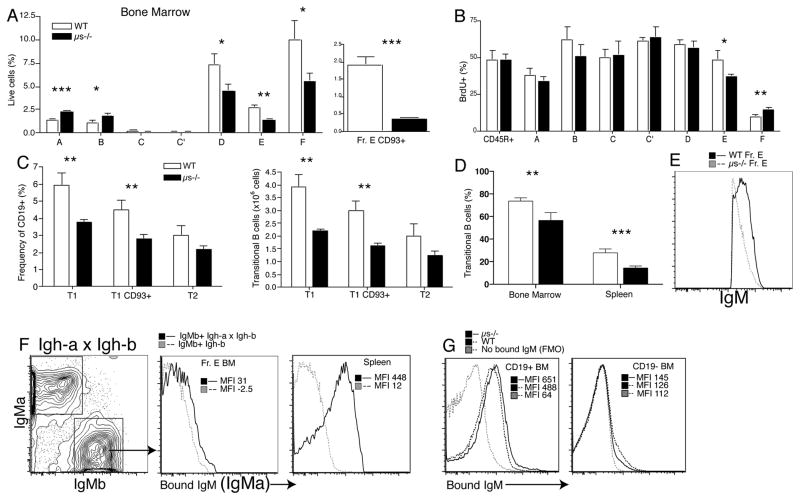
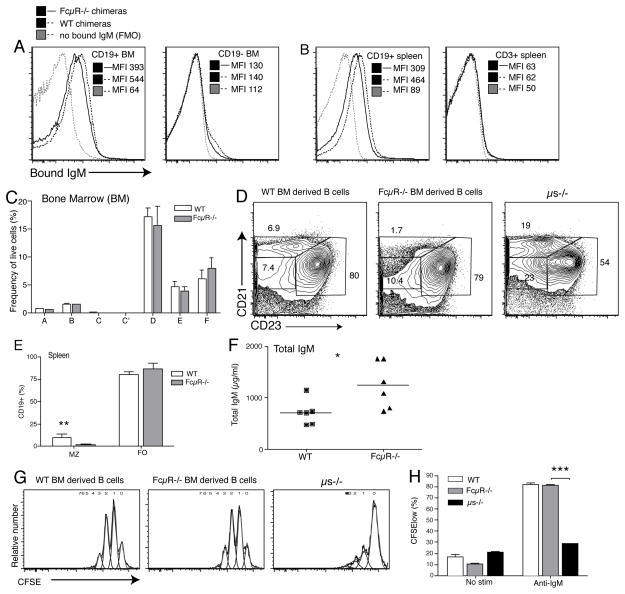
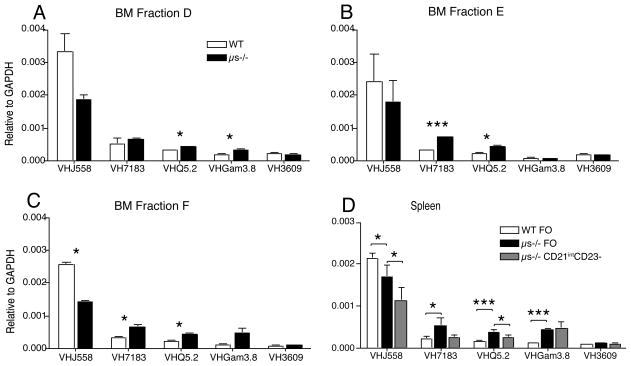
It is unclear why selective deficiency in secreted (s)IgM causes Ab-mediated autoimmunity. We demonstrate that sIgM is required for normal B cell development and selection. The CD5(+) B cells that were previously shown to accumulate in body cavities of sIgM(-/-) mice are not B-1a cells, but CD19(int), CD43(-), short-lived, BCR signaling-unresponsive anergic B-2 cells. Body cavity B-1 cells were >10-fold reduced, including VH11(+) and phosphotidylcholine-specific B-1a cells, whereas splenic B-1 cells were unaffected and marginal zone B cells increased. Follicular B cells had higher turnover rates, survived poorly after adoptive transfer, and were unresponsiveness to BCR stimulation in vitro. sIgM bound to B cell precursors and provided a positive signal to overcome a block at the pro/pre-B stage and during IgVH repertoire selection. Polyclonal IgM rescued B cell development and returned autoantibody levels to near normal. Thus, natural IgM deficiency causes primary autoimmune disease by altering B cell development, selection, and central tolerance induction.


Figures

Figure 1
Figure 1. Strong production of anti-DNA and ANA serum autoantibodies in μs−/− mice
(A and B) Shown are relative units (A) anti-dsDNA IgG and (B) anti-ssDNA IgG in WT and μs−/− mice at indicated ages as measured by ELISA. Each symbol represents values for a single mouse, horizontal bars indicate mean for the group (n=5 – 6/group). (C) Detection of antinuclear antibodies (ANA) via fluorescent staining of mouse 3T3 cells with serum from young and aged WT and μs−/− mice. Representative images are shown. Left panels shows the overlay images with DIC outlining the cells and fluorescent red staining for IgG, right panels shows images with fluorescent red staining for IgG only. White bars indicate 25-μm scale bars. (D) Shown are frequencies of cells stained with diluted sera as indicated, calculated from counting total cells and stained nuclei from randomly chosen images (n=20–100 cells per slide). Data are representative of three (A, B) or two (C, D) independent experiments. Group-wise comparisons were conducted using Student’s t test: *p<0.05, **p<0.005, ***p<0.0005.
Figure 2
Figure 2. Presence of unusual CD5+ CD21int CD23 B cell subsets in lymph tissues of μs−/− mice
(A) Shown are 5% contour plot with outliers of a representative spleen sample (n=4) from WT (left) and μs−/− mice (right) analyzed by flow cytometry after exclusion of dead cells. Boxes and arrows indicate gating strategy. Identified subsets among CD19+ B cells: CD21hi CD23− marginal zone B cells (MZ), CD21int CD23+ follicular B cells (FO), CD21int CD23−,unknown B cell subset, and CD21− CD23− transitional/B-1 cells. CD21int CD23− and CD21− CD23− subsets were gated on CD43 and CD5 to identify CD43+ CD5+ (B-1a), CD43− CD5+. (B) Bar graphs summarize the mean frequencies +/− SD and total numbers of different B cell subsets in spleen and lymph nodes of WT and μs−/− mice (n=4 per group). (C and D) Overlay histograms comparing CD21int CD23− B cells from μs−/− and WT mice identifies CD21int CD23− B cells as a unique cell subset not present in WT mice, as cells with that phenotype of WT mice are a mix of B-1 and immature B cells. Data are representative of three independent experiments.
Figure 3
Figure 3. B cell development from μs−/− bone marrow is normal in the presence of sIgM
(A) Groups of μs−/− mice (n=3 – 4) were given WT or μs−/− serum. Mock-treated WT mice served as controls. Data are from FACS-analysis used to determine the frequencies +/− SD of the different B cell subsets in lymph tissue as shown in Fig. 2; n.d, not detected. (B) Serum concentrations of sIgM in groups of mice outlined in (A). (C) Mixed bone marrow chimeras established with equal numbers of WT (CD45.1) and μs−/− (CD45.2) bone marrow transferred into lethally-irradiated (CD45.1xCD45.2) F1 mice (n=6). Control group is μs−/− BM transferred into μs−/− mice (left panel). Shown are contour plots with outliers from mice 10 weeks after transfer, after gating on live CD19+ splenocytes. WT (CD45.1) and μs−/− (CD45.2) B cells in the chimeras were gated on CD21 and CD23 to identify B cell subsets. Numbers indicate frequencies +/− SD of B cell subsets. (D) Frequencies of WT and μs−/− origin B cells were calculated using a competitive index derived from the frequencies measured by FACS. Competitive index is the ratio of μs−/− to WT B cells before and after BM transfer. (E) Mean serum concentrations +/− SD of sIgM. (F) Shown are ANA antibody levels as determined by the frequencies of 3T3 cells stained with serum from the mixed bone-marrow chimeras. The horizontal line indicates mean for each group. Data are representative of two independent experiments (A–E).
Figure 4
Figure 4. Lack of B-1 cells in peritoneal cavity but not spleen of μs−/− mice
(A) Shown are 5% contour plots with outliers gated on live CD19+ peritoneal cavity B cells from WT and μs−/− mice (n=3–5 mice/group), identifying CD5+CD23− cells that differ in CD43 expression. (B) B-1 cells were further identified by gating on IgMhi IgDlo CD23− CD43+ and CD5+/− (B-1a/B-1b). (C) Bar chart indicating mean frequencies +/− SD IgMhi IgDlo CD23− CD43+ CD5+/− B-1 cells in peritoneal cavity, spleen and lymph nodes of indicated mice. (D) Left, shown are 5% contour plots with outliers of live CD19+ B cells binding to phosphatidylcholine (PtC)-containing liposomes. Right, mean frequencies +/− SD PtC-binding B-1 cells. (E) Relative expression of IgHV11 of purified CD23− B cells from WT and μs−/− pleural cavity determined by qRT-PCR (n=3 per group). (F) Frequencies of B-1 cells and frequencies of PtC-binders in peritoneal cavity of WT, μs+/− and μs−/− littermates (n=4 per group). (G) Representative FACS analysis of CD19+ IgM+ cells in bone marrow, spleen and peritoneal cavity of indicated mice (IgM-a, μs allele and IgM-b, WT allele). Numbers indicate mean frequencies +/− SD for the group (n=3–5). (H and I) IgG anti-dsDNA (H) and IgG anti-ssDNA (I) in sera of indicated mice as measured by ELISA. (J) Anti-nuclear antibody levels in sera of indicated mice. Data are representative of three independent experiments (A–J)
Figure 5
Figure 5. μs−/− CD21intCD23− B cells are anergic
(A) B cell proliferation was determined in WT and μs−/− mice by flow cytometry after 7 days continuous BrdU-labeling. Shown are mean frequencies ± SD BrdU+ cells (n=4 per group). (B) Mean frequencies ± SD of dead cells among different B cell subsets were determined by 7-AAD staining (n=4 per group). (C) Splenic B cells from WT (CD45.1) and μs−/− (CD45.2) mice were labeled with CFSE and transferred 1:1 into WT mice (n=4). Two and 25 days after transfer, the ratios of μs−/− B cells to WT B cells were determined by flow cytometry, gating on CFSE+ CD45.2 and CD45.1 cells, respectively. Competitive index is the ratio of μs−/− to WT B cells after transfer compared to that before transfer. (D) Mature B cells from WT or μs−/− B cells were transferred i.v. into WT (CD45.1) mice. Shown are counter plot with 5% outlier after gating on live CD19+ lymphocytes for frequency of CD21int C23− and CD21int CD23+ (FO) B cells in the spleens two days after transfer. (E and F) Groups of μs−/− mice (n = 3 or 4) were given equivalent amounts of sIgM in form of WT serum, or monoclonal IgM (mIgM). Another group received sera from μs−/− mice, PBS-treated WT and μs−/− mice served as controls. Mean frequencies ± SD of splenic B cells in G0, G1 or G2, S, M of the cell cycle as assessed by flow cytometry via Ki67 and 7-AAD staining (n = 3–4/group). Shown are representative 5% counter plot after gating on live CD19+ lymphocytes for different mouse groups of treatment. (F) Shown are CFSE-histogram plots of cells stimulated in vitro with anti-IgM (20μg/ml) for three days. Numbers indicate rounds of proliferation. Data are representative of two independent experiments (A, B, F).
Figure 6
Figure 6. Lack of sIgM changes B cell development in bone marrow and periphery
(A) Bar graph shows their mean frequencies ± SD of B cell precursors according to Hardy (30): A, pre-pro; B, pro C; late pro; C′ early pre; D late pre; E, immature; F, mature B cells. (B) Frequencies ± SD BrdU+ cell after continuous labeling for 7 days (n=4 per group). (C) Bar graphs show the frequencies and total numbers of CD93+ transitional (T1/2) B cells in spleens of WT and μs−/− mice. (D) Bar graph shows the frequencies ± SD of transitional B cells (CD93+) in bone marrows and spleens 12 days after sublethal irradiated WT and μs−/− mice. (E) Overlay histogram shows total surface IgM expression of BM Fraction E from μs−/− and WT mice. (F) 5% contour plots of FACS staining for surface IgM-a and IgM-b of B cells from Igh-a x Igh-b heterozygous mice (n=2). Overlay histograms of sIgM-a staining, i.e. staining for sIgM bound to the cell surface of IgM-b BCR expressing CD19+ B cells from BM Fraction E and spleen, respectively. MFI, mean fluorescence intensity. (G) In vitro binding of sIgM to bone marrow B cells (left panel) and non-B cells (right panel) as measured by staining for sIgM using IgM allotype-specific to exclude staining for BCR. Data are representative of at least two independent experiments.
Figure 7
Figure 7. FcμR−/− expression on hematopoietic cells has little effect on B cell development
Bone marrow irradiation-chimeric mice were generated by reconstitution of lethally-irradiated C57BL/6 (CD45.1) mice with bone marrow from either wildtype or μs−/− C57BL/6 (CD45.2) mice (n = 6/group). Shown are overlay histograms for sIgM-binding from (A) bone marrow and (B) spleen CD19+ B cells (left panels and non-B cells (right panels) from wildtype and FcμR−/− chimeras after incubation with allotype-mismatched sIgM. Control stains were done staining with all reagents except for anti-IgM (FMO). (C) Flow cytometric assessment of B cell development in the bone marrow according to Hardy fractionation (Supplemental Fig. 3). (D/E) Comparison of splenic B cell pools from chimeras reconstituted with FcμR−/− or wildtype bone marrows (F) Shown are total levels serum IgM in wildtype and FcμR−/− chimeras as measured by ELISA;* p < 0.05. (G/H) B cells isolated from spleens of indicated chimeras, or from μs−/− mice, were stained with CFSE and stimulated with anti-IgM for 72h. Induction of B cell proliferation was defined as reduction in CFSE staining.
Figure 8
Figure 8. sIgM is required for BCR selection
(A–C) The relative expression of indicated IgHV regions among FACS-purified bone marrow B cell precursors (A) fraction D, (B) fraction E, (C) Fraction F as determined by qPCR after normalization to GAPDH (n= 6 mice per group). (D) Similar analysis of spleen follicular (FO) B cells from WT and μs−/− and CD21int CD23− B cells from μs−/− mice. Data are representative of at least two independent experiments.

References

    1. Ehrenstein MR, Notley CA. The importance of natural IgM: scavenger, protector and regulator. Nature reviews Immunology. 2010;10:778–786. - PubMed
    1. Hooijkaas H, van der Linde-Preesman AA, Benne S, Benner R. Frequency analysis of the antibody specificity repertoire of mitogen-reactive B cells and “spontaneously” occurring “background” plaque-forming cells in nude mice. Cellular immunology. 1985;92:154–162. - PubMed
    1. Van Oudenaren A, Haaijman JJ, Benner R. Frequencies of background cytoplasmic Ig-containing cells in various lymphoid organs of athymic and euthymic mice as a function of age and immune status. Immunology. 1984;51:735–742. - PMC - PubMed
    1. Choi YS, Dieter JA, Rothaeusler K, Luo Z, Baumgarth N. B-1 cells in the bone marrow are a significant source of natural IgM. European journal of immunology. 2012;42:120–129. - PMC - PubMed
    1. Benner R, Hijmans W, Haaijman JJ. The bone marrow: the major source of serum immunoglobulins, but still a neglected site of antibody formation. Clinical and experimental immunology. 1981;46:1–8. - PMC - PubMed

Publication types