. 2015 Mar;167(3):1158-85.
doi: 10.1104/pp.114.255927. Epub 2015 Jan 16.

Transcriptome and metabolite profiling of the infection cycle of Zymoseptoria tritici on wheat reveals a biphasic interaction with plant immunity involving differential pathogen chromosomal contributions and a variation on the hemibiotrophic lifestyle definition

Affiliations

Transcriptome and metabolite profiling of the infection cycle of Zymoseptoria tritici on wheat reveals a biphasic interaction with plant immunity involving differential pathogen chromosomal contributions and a variation on the hemibiotrophic lifestyle definition

Jason J Rudd et al. Plant Physiol. 2015 Mar.

Abstract

The hemibiotrophic fungus Zymoseptoria tritici causes Septoria tritici blotch disease of wheat (Triticum aestivum). Pathogen reproduction on wheat occurs without cell penetration, suggesting that dynamic and intimate intercellular communication occurs between fungus and plant throughout the disease cycle. We used deep RNA sequencing and metabolomics to investigate the physiology of plant and pathogen throughout an asexual reproductive cycle of Z. tritici on wheat leaves. Over 3,000 pathogen genes, more than 7,000 wheat genes, and more than 300 metabolites were differentially regulated. Intriguingly, individual fungal chromosomes contributed unequally to the overall gene expression changes. Early transcriptional down-regulation of putative host defense genes was detected in inoculated leaves. There was little evidence for fungal nutrient acquisition from the plant throughout symptomless colonization by Z. tritici, which may instead be utilizing lipid and fatty acid stores for growth. However, the fungus then subsequently manipulated specific plant carbohydrates, including fructan metabolites, during the switch to necrotrophic growth and reproduction. This switch coincided with increased expression of jasmonic acid biosynthesis genes and large-scale activation of other plant defense responses. Fungal genes encoding putative secondary metabolite clusters and secreted effector proteins were identified with distinct infection phase-specific expression patterns, although functional analysis suggested that many have overlapping/redundant functions in virulence. The pathogenic lifestyle of Z. tritici on wheat revealed through this study, involving initial defense suppression by a slow-growing extracellular and nutritionally limited pathogen followed by defense (hyper) activation during reproduction, reveals a subtle modification of the conceptual definition of hemibiotrophic plant infection.


Figures

Figure 1.
Figure 1.
Time course of infection of Z. tritici on wheat. Leaf materials were collected and subsequently analyzed by RNAseq, GC-MS, and liquid chromatography-mass spectrometry (LC-MS).
Figure 2.
Figure 2.
Abundant fungal metabolite accumulation and RNAseq read mapping to the fungal genome chart the progress of disease. Red lines represent Z. tritici-infected leaves. Blue lines represent mock-treated leaves. Asterisks indicate significant increases at adjusted P < 0.05.
Figure 3.
Figure 3.
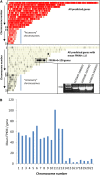
The small accessory chromosomes and a region on chromosome 7 have low transcriptional activity throughout infection. A, The top displays the positions of all current predicted Z. tritici genes across the 21 chromosomes of isolate IPO323, and the bottom shows all genes with very low or no (FPKM < 1.0) detected expression throughout infection. The inset displays PCR on genomic DNA, confirming that the low/nontranscribed region on chromosome 7 was present in the experimental isolate IPO323. B, Mean value of expression per gene from each chromosome averaged from the entire data set.
Figure 4.
Figure 4.
Metabolite and transcriptome analysis of fungal culture illuminates metabolism during early plant infection. A, Fungal growth in CDB reduces levels of amino acids. Blue signifies decreased levels in CDB, and yellow indicates increased levels (adjusted P < 0.05). F6P, Fru-6-P; G6P, Glc-6-P; PEP, phosphoenolpyruvate. DHA, Dihydroxyacetone. B, Growth in CDB increases levels of hexose 6-phosphates, trehalose, and mannitol, accompanied by the up-regulation of genes encoding hexose and nitrate transporters. C, Low-level expression of genes involved in nitrate and hexose uptake and assimilation during phases of plant infection. Numbers represent mean FPKM values at each time point of infection.
Figure 5.
Figure 5.
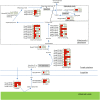
Early leaf infection (1–4 dpi) induces the expression of Z. tritici genes involved in the β-oxidation of lipids and fatty acids and up-regulation of the glyoxylate pathway. Red coloring indicates up-regulation, and no shading represents no significant change relative to the expression levels in CDB culture (adjusted P < 0.05). FA, Fatty acids; PM, plasma membrane.
Figure 6.
Figure 6.
Expression profiles of 366 Z. tritici genes encoding putative secreted proteins up-regulated during leaf infection.
Figure 7.
Figure 7.
Fungus-induced changes in expression of the wheat jasmonate biosynthesis pathway. A, Schematic pathway of JA biosynthesis in plants. B, Relative expression changes of JA pathway components in wheat leaves from 1 to 14 dpi with Z. tritici. Green shading indicates significant down-regulation (adjusted P < 0.05), while red shading indicates up-regulation (adjusted P < 0.05). DAD1, DEFECTIVE IN ANTHER DEHISCENCE1; LOX, lipoxygenase; 13-HPOT, 13(S)-hydroperoxylinolenic acid; AOS, allene oxide synthase; 12,13-EOT, 12,13(S)-epoxylinolenic acid; AOC, allene oxide cyclase; OPDA, 12-oxo-cis-10,15-phytodienoic acid; OPR3, 12-oxophytodienoate reductase; OPC:8, 3-oxo-2-(cis-2′-pentenyl)-cyclopentane-1-octanoic acid; OPCL, 3-oxo-2-(cis-2′-pentenyl)-cyclopentane-1-octanoic acid CoA Ligase; ACX, acyl-CoA oxidase; MFP, multifunctional protein; KAT, 3-ketoacyl-CoA thiolase; CTS, COMATOSE; ACH, acyl-thioesterase.
Figure 8.
Figure 8.
Fungus-induced changes in expression of the wheat lignin biosynthesis pathway. A, Schematic of pathways leading to lignin formation in plants. Metabolite analysis of Z. tritici-infected wheat leaves identified increased levels of Phe and ferulate during the late stages of infection. B, Relative expression changes of lignin biosynthetic pathway components in wheat leaves from 1 to 14 dpi with Z. tritici. Green shading indicates significant down-regulation (adjusted P < 0.05), while red shading indicates up-regulation (adjusted P < 0.05). PAL, Phenylalanine ammonia lyase; C4H, cinnamate 4-hydroxylase; C3H, p-coumarate 3-hydroxylase; COMT, caffeic acid O-methyl transferase; F5H, ferulate 5-hydroxylase; 4CL, 4-coumarate:CoA ligase; CCR, cinnamoyl-CoA reductase; CCoA-3H, cinnamyl alcohol dehydrogenase; CCoA-OMT, caffeoyl-CoA O-methyltransferase; CAD, cinnamyl-alcohol dehydrogenase.
Figure 9.
Figure 9.
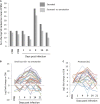
Expression profiles of Z. tritici-secreted protein subclasses throughout plant infection. A, Percentage of secreted and unannotated proteins present in the top 50 most abundant transcripts at each time point. B, Expression profile of 68 unannotated small Cys-rich secreted proteins. C, Expression profile of 31 differentially expressed secreted proteases.
Figure 10.
Figure 10.
Physical positions of putative coexpressed Z. tritici gene clusters. A, All currently predicted Z. tritici genes. B, Sixteen putative coexpressed physical gene clusters shown in Table VI.
Figure 11.
Figure 11.
The fructan biosynthesis pathway and fructan metabolite accumulation are triggered in wheat leaves during the onset of disease symptoms induced by Z. tritici. A, Quantification of fructan metabolites during the course of infection. **, Significant at adjusted P < 0.05. B, Transcriptional up-regulation of the fructan biosynthetic pathway. Green shading indicates significant down-regulation (adjusted P < 0.05), while red shading indicates up-regulation (adjusted P < 0.05).
Figure 12.
Figure 12.
SA accumulation coincides with the necrotrophic phase of fungal colonization. The red line indicates fungus-inoculated leaves, and the blue line indicates mock-inoculated leaves. **, Significant at adjusted P < 0.05.

Similar articles

Cited by

References

    1. Antoniw J, Beacham AM, Baldwin TK, Urban M, Rudd JJ, Hammond-Kosack KE (2011) OmniMapFree: a unified tool to visualise and explore sequenced genomes. BMC Bioinformatics 12: 447. - PMC - PubMed
    1. Apel K, Hirt H (2004) Reactive oxygen species: metabolism, oxidative stress, and signal transduction. Annu Rev Plant Biol 55: 373–399 - PubMed
    1. Bari R, Jones JDG (2009) Role of plant hormones in plant defence responses. Plant Mol Biol 69: 473–488 - PubMed
    1. Benjamini Y, Hochberg Y (1995) Controlling the false discovery rate: a practical and powerful approach to multiple testing. J R Stat Soc B 57: 289–300
    1. Bowler J, Scott E, Tailor R, Scalliet G, Ray J, Csukai M (2010) New capabilities for Mycosphaerella graminicola research. Mol Plant Pathol 11: 691–704 - PMC - PubMed

Publication types

MeSH terms