. 2015 Jan 16;4(2):155-69.
doi: 10.1242/bio.201410413.

A proteomic study of mitotic phase-specific interactors of EB1 reveals a role for SXIP-mediated protein interactions in anaphase onset

Affiliations

A proteomic study of mitotic phase-specific interactors of EB1 reveals a role for SXIP-mediated protein interactions in anaphase onset

Naoka Tamura et al. Biol Open. .

Abstract

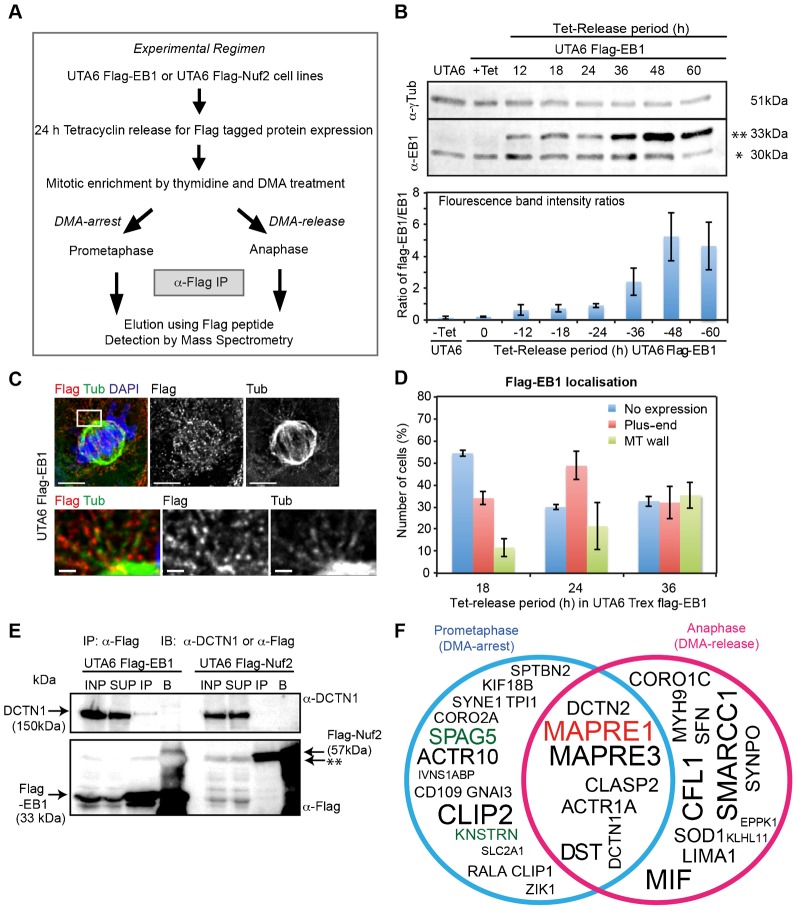
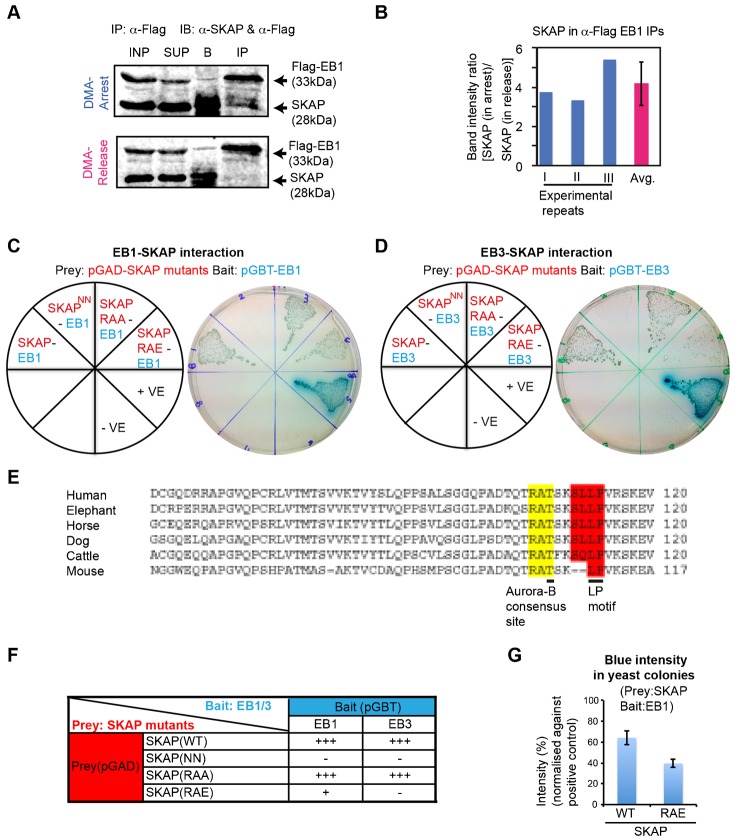
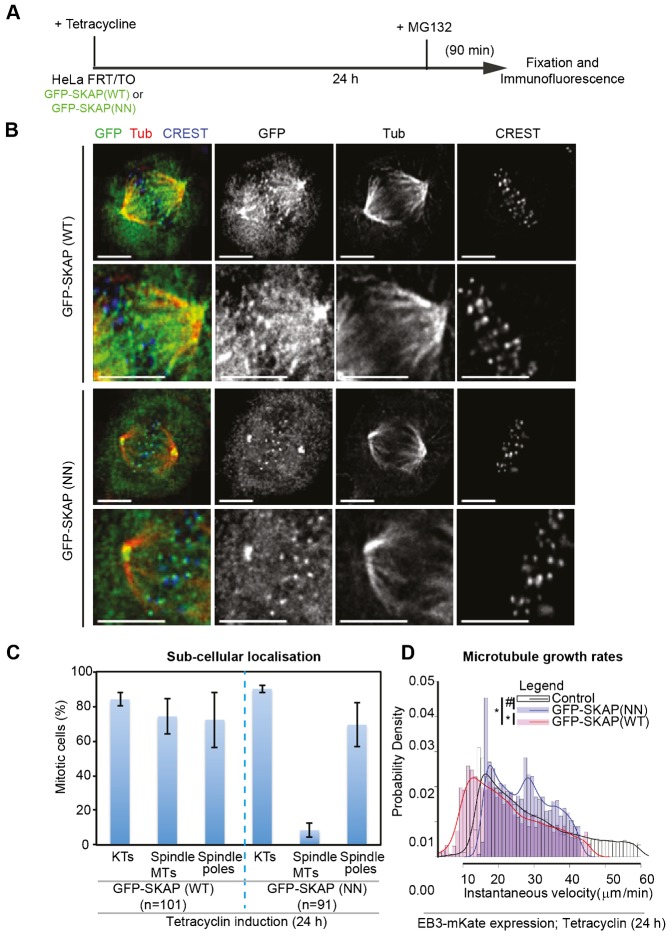
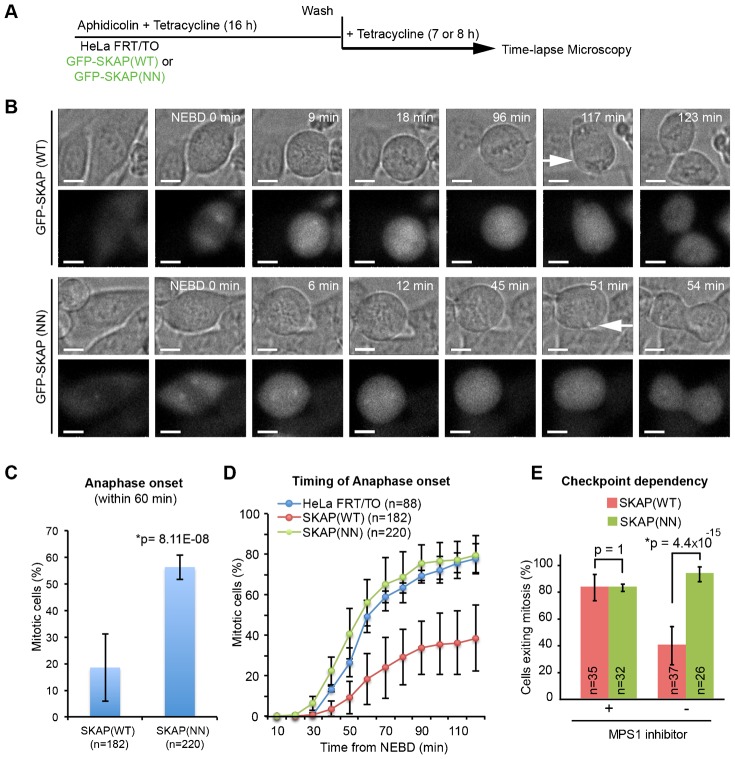
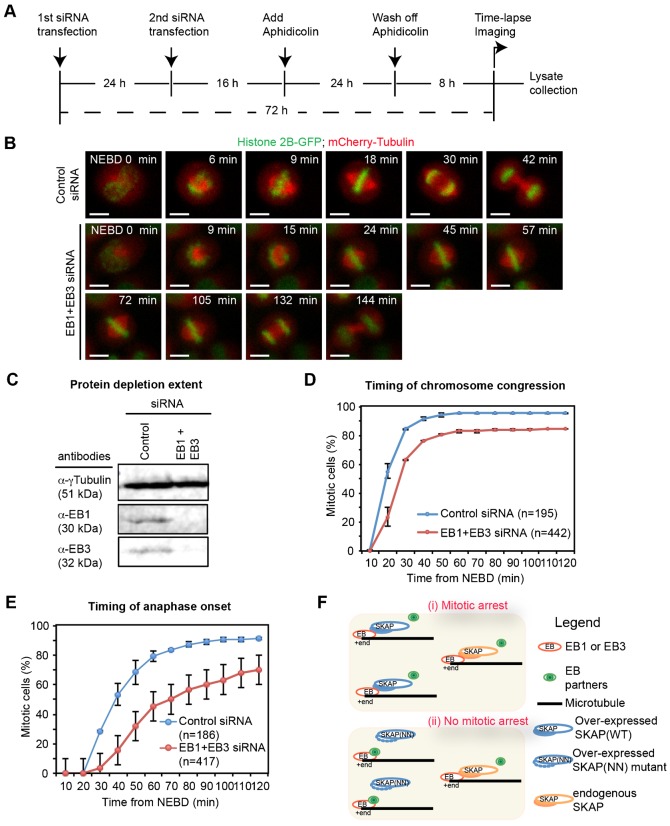
Microtubules execute diverse mitotic events that are spatially and temporally separated; the underlying regulation is poorly understood. By combining drug treatments, large-scale immunoprecipitation and mass spectrometry, we report the first comprehensive map of mitotic phase-specific protein interactions of the microtubule-end binding protein, EB1. EB1 interacts with some, but not all, of its partners throughout mitosis. We show that the interaction of EB1 with Astrin-SKAP complex, a key regulator of chromosome segregation, is enhanced during prometaphase, compared to anaphase. We find that EB1 and EB3, another EB family member, can interact directly with SKAP, in an SXIP-motif dependent manner. Using an SXIP defective mutant that cannot interact with EB, we uncover two distinct pools of SKAP at spindle microtubules and kinetochores. We demonstrate the importance of SKAP's SXIP-motif in controlling microtubule growth rates and anaphase onset, without grossly disrupting spindle function. Thus, we provide the first comprehensive map of temporal changes in EB1 interactors during mitosis and highlight the importance of EB protein interactions in ensuring normal mitosis.

Keywords: Cell cortex; Kinetochore; Microtubule; Mitosis; Plus-end.


Conflict of interest statement

Competing interests: The authors declare no competing financial interests.

Figures

Fig. 1.
Fig. 1.. Mitotic phase-specific interactions of the plus-end protein, EB1.
(A) Protocol used to identify mitotic phase-specific interactors of EB1 as detailed in Materials and Methods. (B) Fluorescence immunoblot (upper panel) and intensity graph (lower panel) levels of Flag-EB1 (**) relative to endogenous EB1 (*) following Tetracycline release. UTA6 or UTA6 Flag-EB1 lysates were immunoblotted with α-EB1 and α-γTubulin (loading control) antibodies. (C) Immunofluorescence images of UTA6 Flag-EB1 cells released from Tetracycline for 24 h and immunostained with α-Flag and α-Tubulin (Tub) antibodies and co-stained with DAPI for DNA. Lower panels show magnified images of area boxed in white. Scale: 5 µm (upper panel) and 1 µm (lower panel). (D) Graph of percentage of UTA6 Flag-EB1 cells released from Tetracycline (Tet) for varying periods, immunostained as in (C) and counted for cells with Flag-EB1 signals at microtubule plus-end (Plus-end), microtubule (MT) wall or no Flag-EB1 signals (No expression). Error bar represents SEM from three independent experiments. (E) Fluorescent immunoblots of α-Flag immunoprecipitates from lysates of UTA6 Flag-EB1 and UTA6 Flag-Nuf2, probed with anti-p150 (DCTN1) and anti-Flag antibodies as indicated. Cell lysates (INP), supernatant (SUP) following immunoprecipitation, Flag-peptide eluted immunoprecipitate (IP) and beads fraction (B) are loaded. ** indicates non-specific band. (F) Venn diagram showing EB1 interactors from DMA-arrest (Blue circle), -release (Pink circle) or both (overlapped region) conditions. Diagram excludes proteins found in Flag-Nuf2 IP (corresponding to each batch of DMA treatment) and includes proteins found in Flag-EB1 IPs at least twice. Font size in each area of the circle reflects reproducibility across repeats. Bait (MAPRE1/EB1) and Astrin(SPAG5)-SKAP(KNSTRN) are highlighted red and green, respectively.
Fig. 2.
Fig. 2.. Astrin-SKAP complex interacts with EB1 in a mitotic phase-specific manner.
(A) Immunoblots showing increased SKAP in α-Flag immunoprecipitates (IP) from lysates of prometaphase (DMA-arrest) compared to anaphase (DMA-release) UTA6 Flag-EB1 cells. Immunoblots probed with α-Flag and α-SKAP antibodies in two fluorescent channels (merge presented). Cell lysates (INP), Supernatant (SUP) following immunoprecipitation and beads fraction (B) are loaded. (B) Graph showing reproducibility of SKAP intensity ratios from immunoblots (as in A) of α-Flag-EB1 immunoprecipitates from DMA-arrest (prometaphase) and -release (anaphase) cell lysates. Ratio from three independent repeats, their average (avg.) and SD values (error bars) are shown. (C,D) Yeast two-hybrid study of strains bearing prey and bait protein expression vectors as indicated in red and blue on the pie chart (left). Positive protein-protein interaction was assessed through the activation of the lacZ reporter gene, which was demonstrated by the formation of blue colonies on plates containing X-Gal. Photographs (right) of colonies in (C) show blue colour development indicating interaction between EB1 and SKAP (SKAP::EB1), EB1 and phospho-dead SKAP mutant (SKAP(RAA)::EB1). No blue colour development indicates no interaction between EB1 and SKAP (NN) mutant (SKAP(NN)::EB1). Blue colour development is reduced indicating weaker interaction between EB1 and phospho-mimetic SKAP mutant (SKAP(RAE)::EB1). The interaction between SV40-p53 and SV40-Laminin were used as positive (+ve) and negative (-ve) controls, respectively. In (D), photographs (right) of colonies show blue colour development indicating positive interaction between EB3 and SKAP (SKAP::EB3), EB3 and phospho-dead SKAP mutant (SKAP(RAA)::EB3) and no blue colour development indicating no interaction between EB3 and SKAP (NN) mutant (SKAP(NN)::EB3) and EB3 and phospho-mimetic SKAP mutant (SKAP(RAE)::EB3). (E) Sequence alignment using ClustalW2 showing evolutionary conservation of the S/T-X-I/L-P domain of SKAP in mammals (Human: Q9Y448; Mouse: Q9D9Z1; Horse: F6T184; Cattle: E1BJ69; Dog: E2RST7; Elephant: G3TLE9). Yellow and Red highlights mark evolutionarily conserved Aurora-B consensus site and S/T-X-I/L-P motifs, respectively. (F) Summary table of interaction between SKAP mutants with either EB1 or EB3. + and − refer to positive and no interaction, respectively. +++ and + refer to strong and weak interaction, respectively. (G) Graph of blue intensity of yeast colonies show a reduction in interaction between EB1 and SKAP(RAE) mutant compared to EB1 and SKAP. Percentages of blue intensity values were obtained by normalising against intensities of colonies in positive controls (+ve) and are batch controlled. Error bars indicate SD values.
Fig. 3.
Fig. 3.. The ‘SXIP-motif’ of SKAP is required for SKAP localization at spindle microtubules but not kinetochores.
(A) Schematic describing drug treatment regimen: HeLa FRT/TO cell lines were treated with Tetracycline for 24 h and then exposed to MG132 for 90 min prior to fixation. (B) Representative immunofluorescence images of HeLa FRT/TO cell line treated as in (A), expressing either GFP-SKAP(WT) or GFP-SKAP(NN) mutant. Cells were immunostained with α-GFP and α-Tubulin (Tub) antibodies and CREST antisera. Scale bar: 5 µm. Lower panels show magnified images. (C) Graph shows percentage of mitotic HeLa FRT/TO cells expressing either GFP-SKAP (WT) or GFP-SKAP (NN) mutant displaying SKAP localization at kinetochores (KTs), spindle microtubules (Spindle MTs) or Spindle poles. Scoring was based on SKAP enrichment or the lack of SKAP enrichment at specific subcellular sites. n refers to number of cells. Cells were treated as in (A). Error bars indicate SEM values across three independent repeats. (D) Probability density distribution plots for comparing the distribution of average values for instantaneous velocities of EB3 comets in cells expressing EB3-mKate either alone (Control) or together with GFP-SKAP(WT) or GFP-SKAP(NN) mutant. Values were obtained using plus-tip tracker software and outliers greater than 2×SD from the peak average values are excluded in the plot. Curves represent smoothened values of the bar plot values presented. At least four cells and 3300 comets were analyzed for each of the three conditions. Non-overlapping peak values between control and SKAP(WT), and SKAP(WT) and SKAP(NN) signify statistically significant differences (*) as confirmed by p<0.01 using the Wilcoxon rank sum test. Overlapping peak values between SKAP(NN) and Control signify statistically insignificant differences (#) as confirmed by p>0.01 using the Wilcoxon rank sum test.
Fig. 4.
Fig. 4.. SKAP overexpression delays anaphase onset in an ‘SXIP-motif’ dependent manner.
(A) Schematic describing drug treatment regimen: HeLa FRT/TO cells were treated with Tetracycline and synchronised using aphidicolin treatment for 16 h and then released from aphidicolin for 7 h prior to filming. (B) Time-lapse images of HeLa FRT/TO cells expressing GFP-SKAP (WT) or GFP-SKAP (NN) mutant. DIC images (top panels) show rounding up of cells, metaphase plate and anaphase (white arrows). Fluorescent images (bottom panels) show GFP signals. Cells were treated as in (A). Scale bar: 10 µm. (C) Graph of percentage of HeLa FRT/TO cells expressing GFP-SKAP (WT) or GFP-SKAP (NN) mutant, which initiated anaphase within 60 min from NEBD (nuclear envelope break down). NEBD was assessed using loss of exclusion of GFP-SKAP signal in nucleus and anaphase onset was assessed using anaphase cell elongation. Error bars indicate SEM values. *Statistical significance. p-value was calculated using proportion test. n indicates number of cells analysed. (D) Cumulative frequency plots of anaphase times in HeLa FRT/TO parental cells and HeLa FRT/TO cell lines expressing either GFP-SKAP(WT) or GFP-SKAP(NN) mutant. Cells that initiated and exited mitosis within 2 h were included. Average values were obtained from 3 independent experimental repeats of GFP-SKAP expressing cells and 2 independent experimental repeats of HeLa FRT/TO parental cells. Error bars indicate SEM values. (E) Graph of percentage of mitotic cells expressing either GFP-SKAP (WT) or GFP-SKAP (NN) mutant that initiated anaphase in the presence (+) or absence (-) of MPS1 inhibitor (400 nM NMS-P715) during 4 h of time-lapse imaging. Inhibitor was added just before time-lapse imaging session. Error bars show SD values and p-values were obtained using proportion test. *Statistically significant difference.
Fig. 5.
Fig. 5.. Co-depletion of EB1 and EB3 delays anaphase onset more severely than chromosome congression.
(A) Schematic describing siRNA and aphidicolin treatments in HeLaH2B-GFP mCherry-Tubulin cells. Cells were transfected with siRNA twice, at 72 h and 48 h prior to imaging. For synchronization, cells were treated with aphidicolin for 24 h, and then released into drug free medium for 8 h prior to imaging. At the end of imaging session, cell lysates were collected for immunoblotting to assess protein depletion extent. (B) Representative images from time-lapse movies of HeLaH2B-GFP; mCherry-Tubulin cells treated with both EB1 and EB3 or Control siRNA oligos as in (A). Scale bar: 10 µm. (C) Representative immunoblots showing the co-depletion of EB1 and EB3 in lysates collected from time-lapse imaging studies as shown in (B). Lysates of HeLaH2B-GFP; mCherry-Tubulin cells treated with indicated siRNA were processed for immunoblotting with α-γTubulin, α-EB1 and α-EB3 antibodies. (D-E) Cumulative frequency distribution graphs showing the time of chromosome congression (D) and anaphase onset (E) from NEBD in HeLaH2B-GFP; mCherry-Tubulin cells treated with control alone or EB1 and EB3 siRNA oligos. The graphs present the average values of two independent experiments with the error bars showing SEM values. n refers to number of cells. (F) Cartoon illustrating the loss of EB binding with its partners in the presence of excess SKAP (i), but not SKAP (NN) mutant (ii) that is defective for EB interaction. Excess of SKAP-EB interaction results in mitotic arrest, and this model highlights the importance of regulated plus-end complex interactions for controlling the timing of anaphase onset.

Similar articles

Cited by

References

    1. Akhmanova A., Steinmetz M. O. (2008). Tracking the ends: a dynamic protein network controls the fate of microtubule tips. Nat. Rev. Mol. Cell Biol. 9, 309–322. 10.1038/nrm2369 - DOI - PubMed
    1. Akhmanova A., Steinmetz M. O. (2010). Microtubule +TIPs at a glance. J. Cell Sci. 123, 3415–3419. 10.1242/jcs.062414 - DOI - PubMed
    1. Ban R., Matsuzaki H., Akashi T., Sakashita G., Taniguchi H., Park S. Y., Tanaka H., Furukawa K., Urano T. (2009). Mitotic regulation of the stability of microtubule plus-end tracking protein EB3 by ubiquitin ligase SIAH-1 and Aurora mitotic kinases. J. Biol. Chem. 284, 28367–28381. 10.1074/jbc.M109.000273 - DOI - PMC - PubMed
    1. Berrueta L., Tirnauer J. S., Schuyler S. C., Pellman D., Bierer B. E. (1999). The APC-associated protein EB1 associates with components of the dynactin complex and cytoplasmic dynein intermediate chain. Curr. Biol. 9, 425–428. 10.1016/S0960-9822(99)80190-0 - DOI - PubMed
    1. Brüning-Richardson A., Langford K. J., Ruane P., Lee T., Askham J. M., Morrison E. E. (2011). EB1 is required for spindle symmetry in mammalian mitosis. PLoS ONE 6, e28884 10.1371/journal.pone.0028884 - DOI - PMC - PubMed

LinkOut - more resources