. 2017 May:178:1-9.
doi: 10.1016/j.clim.2015.01.002. Epub 2015 Jan 14.

Clonal and constricted T cell repertoire in Common Variable Immune Deficiency

Affiliations

Clonal and constricted T cell repertoire in Common Variable Immune Deficiency

Manish Ramesh et al. Clin Immunol. 2017 May.

Abstract

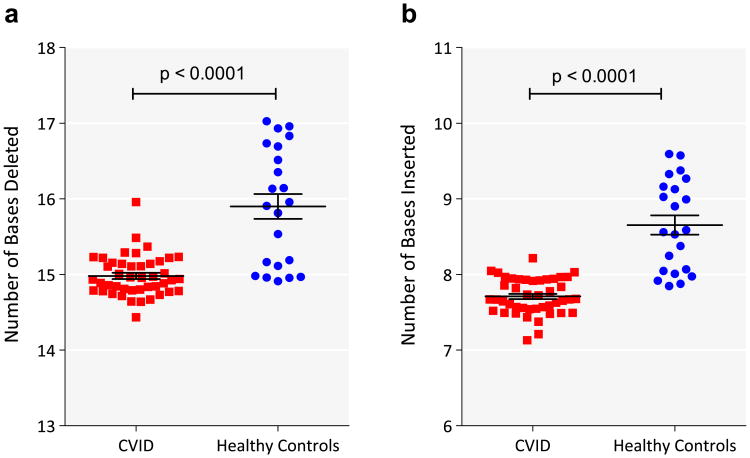
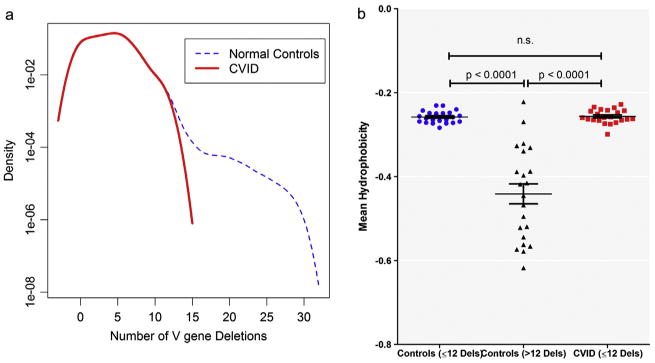
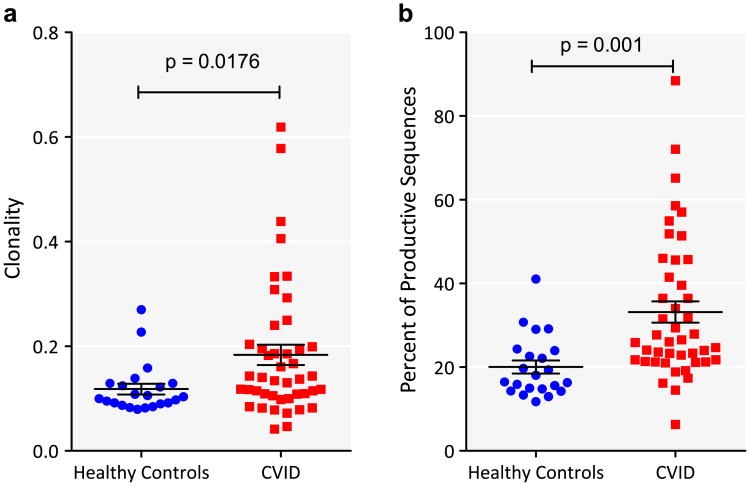
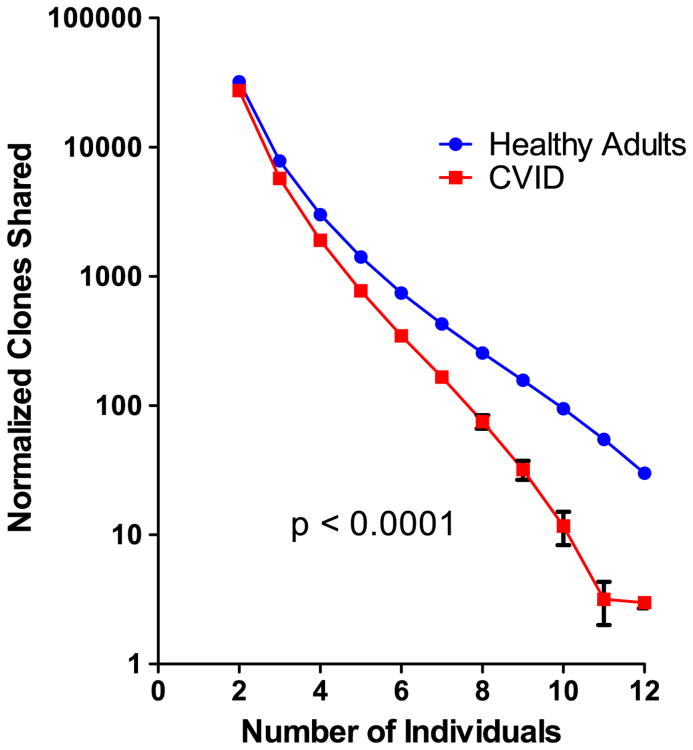
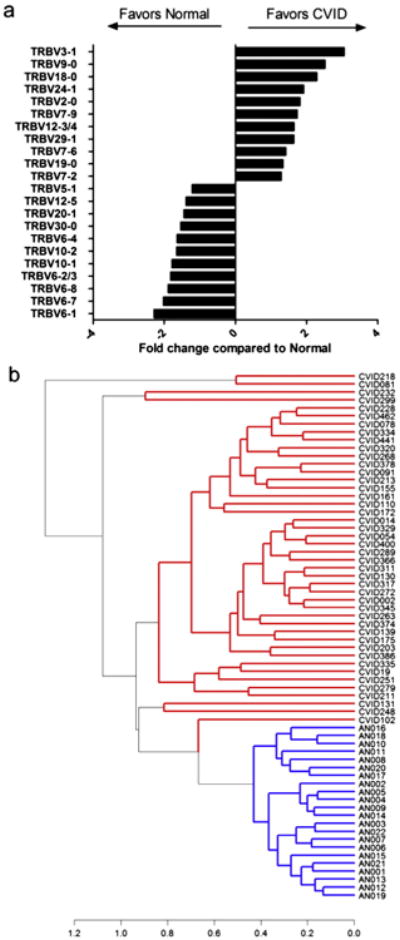
We used high throughput sequencing to examine the structure and composition of the T cell receptor β chain in Common Variable Immune Deficiency (CVID). TCRβ CDR3 regions were amplified and sequenced from genomic DNA of 44 adult CVID subjects and 22 healthy adults, using a high-throughput multiplex PCR. CVID TCRs had significantly less junctional diversity, fewer n-nucleotide insertions and deletions, and completely lacked a population of highly modified TCRs, with 13 or more V-gene nucleotide deletions, seen in healthy controls. The CVID CDR3 sequences were significantly more clonal than control DNA, and displayed unique V gene usage. Despite reduced junctional diversity, increased clonality and similar infectious exposures, DNA of CVID subjects shared fewer TCR sequences as compared to controls. These abnormalities are pervasive, found in out-of-frame sequences and thus independent of selection and were not associated with specific clinical complications. These data support an inherent T cell defect in CVID.

Keywords: Adult; CMV; Clonality; Clone sharing; Common Variable Immune Deficiency; EBV; High throughput sequencing; Junctional diversity; T cell receptor; VDJ recombination.


Conflict of interest statement

Conflict of interest statement: The authors declare that there are no conflicts of interest.

Figures

Figure 1
Figure 1
Fewer VDJ deletions and n-nucleotide insertions in CVID CDR3 sequences compared to normal controls. a) The sum of the numbers of deletions from Vβ, Dβ, and Jβ sequences were calculated for each sequence. The mean number of deletions (in bases) for each patient (red square) or control (blue filled circle) is shown (y-axis). The horizontal bar represents the mean of each group and the whiskers represent the standard error of the mean. b) The sum of the number of insertions between Vβ and Dβ, and Dβ and Jβ sequences were calculated for each sequence. The mean number of insertions (in bases) for each patient (red square) or control (blue filled circle) is shown (y-axis). The horizontal bar represents the mean of each group and the whiskers represent the standard error of the mean. p-Values of t-test are indicated. (For interpretation of the references to color in this figure legend, the reader is referred to the web version of this article.)
Figure 2
Figure 2
CVID TCR sequences lack a unique population of TCRs characterized by more than 12 deletions from the V gene. a) A density curve of V-deletions in all unique clones in healthy controls (blue dashed line) or CVID (red bold line). The number of deletions is displayed on the x-axis while frequency is expressed on a log scale on the y-axis. b) Mean Kyte–Doolittle hydropathy index (y-axis) for control DNA sequences with ≤12 deletions (blue filled circles), >12 deletions (black triangles) and CVID sequences (red squares), all of which had ≤12 Vβ deletions. A negative number indicates hydrophilicity and a positive number indicates hydrophobicity. t-Test p-values are indicated. n.s. denotes statistically not significant. (For interpretation of the references to color in this figure legend, the reader is referred to the web version of this article.)
Figure 3
Figure 3
CVID TCR sequences have increased clonality compared to healthy controls. a) Clonality of CVID (red square) and control DNA (blue filled circle) is shown. Horizontal line represents mean and whiskers represent standard error of mean. The groups were compared by t-test and the p-value is indicated. b) All productive clones were ranked by their normalized copy number. The sum of the copy numbers of the top 1% of clones was calculated. The figure depicts the sum of the copy number as a percent of the normalized copy number of all productive sequences on the y-axis and group on the x-axis (CVID – red square; controls – blue filled circle). The groups were compared by t-test and the p-value is indicated. (For interpretation of the references to color in this figure legend, the reader is referred to the web version of this article.)
Figure 4
Figure 4
Clonality correlates with absolute T cell count in peripheral blood. Clonality is depicted on the y-axis absolute CD3+ T cell count on the x-axis. The linear regression line is shown and coefficient of correlation, r, indicated on the figure. Clonality of control samples and respective laboratory ranges for normal are indicated in the crosshatched area.
Figure 5
Figure 5
CVID TCR sequences share fewer clones compared to normal controls. CVID and control DNA were iteratively sampled, 12 individuals at a time for 100 repeats. The amino acid sequences of CDR3 regions of productive clones were compared separately amongst CVID patients (red squares) or healthy controls (blue filled circles). The number of individuals that share each clone in a sample of DNA was determined. The mean number of clones shared amongst 2 to 12 individuals was then determined. The number of individuals who share a clone is designated on the x-axis. The mean number of clones shared amongst patients or controls is depicted on the y-axis on a log10 scale. Error bars represent the 95% confidence interval. Kolmogorov–Smirnov test p-values are indicated. (For interpretation of the references to color in this figure legend, the reader is referred to the web version of this article.)
Figure 6
Figure 6
CVID DNA contains divergent Vβ families as compared to control DNA. a) The average fraction of sequences utilizing each V gene was calculated for CVID patients and controls. Ratios of CVID:normal were determined for V genes where significant differences were present. Ratios less than 1 are depicted as their negative reciprocal for ease of comparison. b) Non-biased clustering of scaled V gene distribution for the 42 CVID and 22 control subjects was performed using Manhattan distance and complete clustering algorithms. CVID DNA samples, shown in red, are completely segregated from control DNA, shown in blue. Clustering distance is indicated on the x-axis. Sample numbers are indicated on the right prefaced by CVID or AN (adult normal) for controls. (For interpretation of the references to color in this figure legend, the reader is referred to the web version of this article.)

References

    1. Al-Herz W, et al. Primary immunodeficiency diseases: an update on the classification from the International Union of Immunological Societies Expert Committee for Primary Immunodeficiency. Front Immunol. 2014;5:162. - PMC - PubMed
    1. Warnatz K, Voll RE. Pathogenesis of autoimmunity in common variable immunodeficiency. Front Immunol. 2012;3:210. - PMC - PubMed
    1. Chapel H, et al. Common variable immunodeficiency disorders: division into distinct clinical phenotypes. Blood. 2008;112(2):277–286. - PubMed
    1. Resnick ES, et al. Morbidity and mortality in common variable immune deficiency over 4 decades. Blood. 2012;119(7):1650–1657. - PMC - PubMed
    1. Gathmann B, et al. Clinical picture and treatment of 2212 patients with common variable immunodeficiency. J Allergy Clin Immunol. 2014 - PubMed

Publication types

MeSH terms

Substances