. 2015 Mar 13;290(11):7097-113.
doi: 10.1074/jbc.M114.617779. Epub 2015 Jan 16.

Conditional knock-out reveals a requirement for O-linked N-Acetylglucosaminase (O-GlcNAcase) in metabolic homeostasis

Affiliations

Conditional knock-out reveals a requirement for O-linked N-Acetylglucosaminase (O-GlcNAcase) in metabolic homeostasis

Chithra Keembiyehetty et al. J Biol Chem. .

Abstract

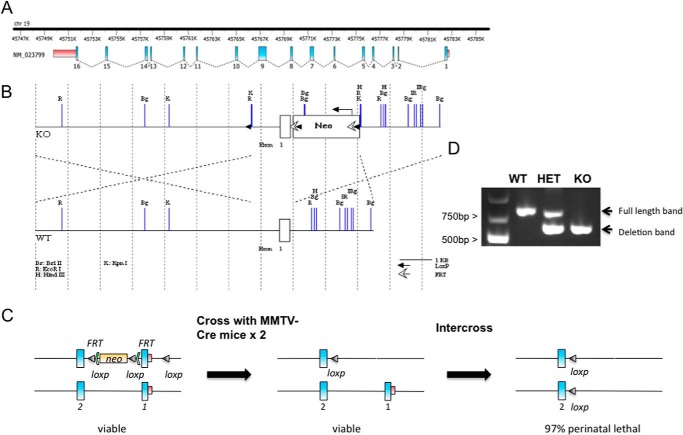
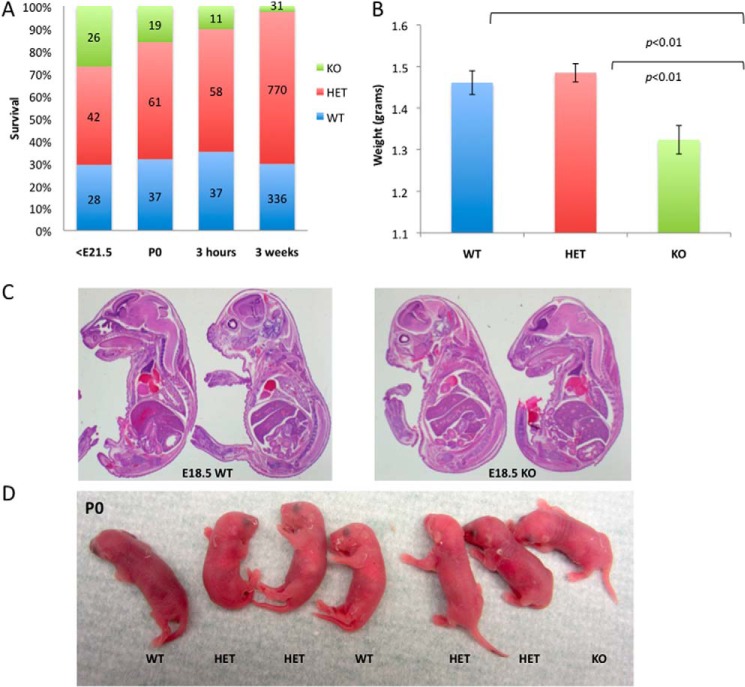
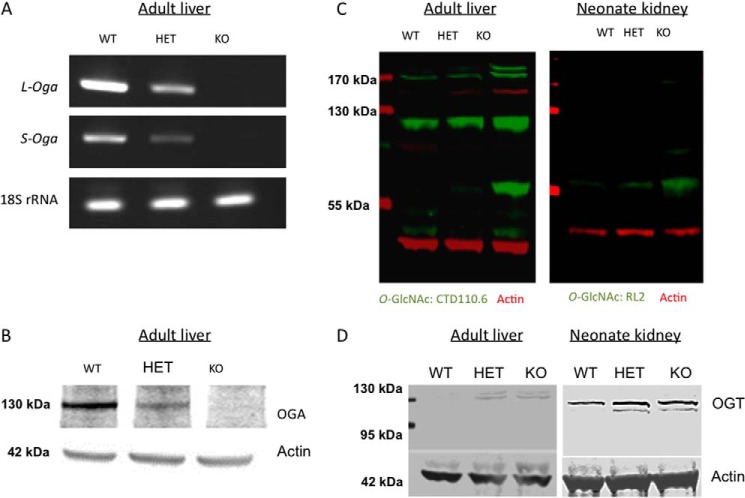
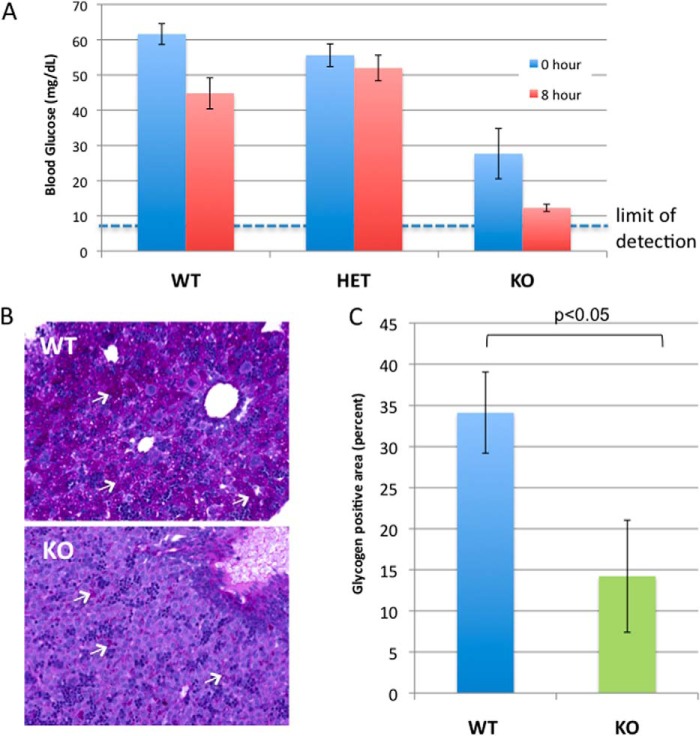
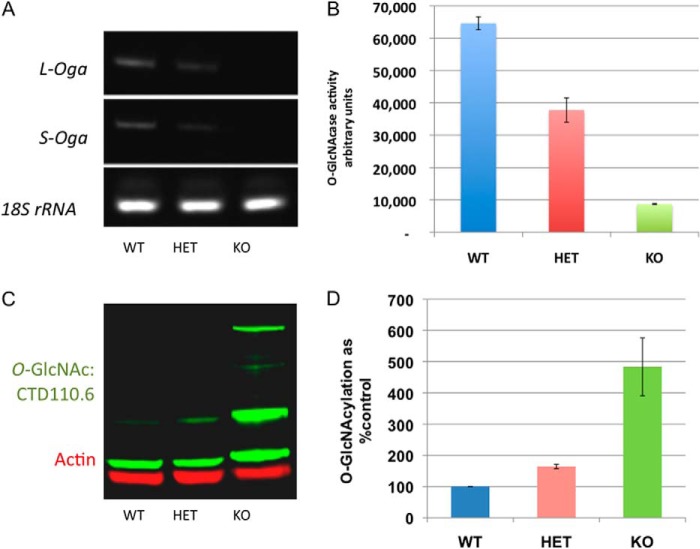
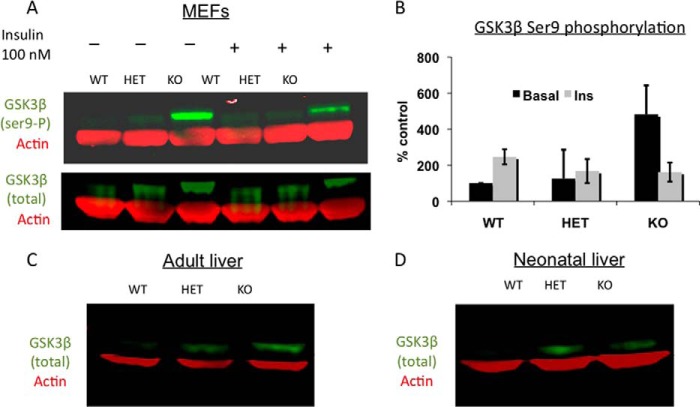
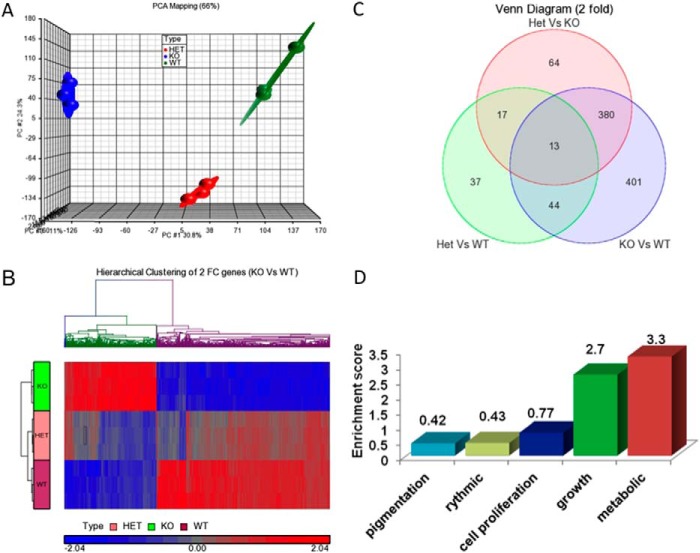
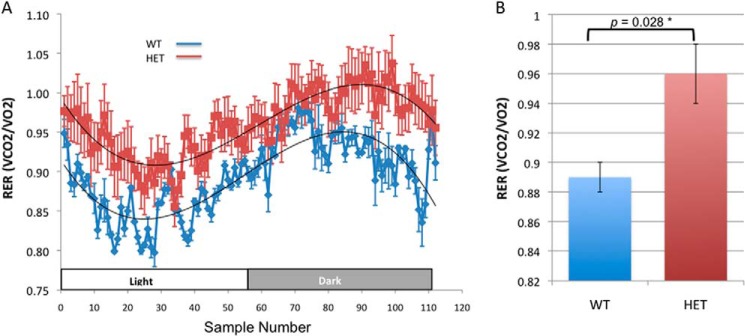
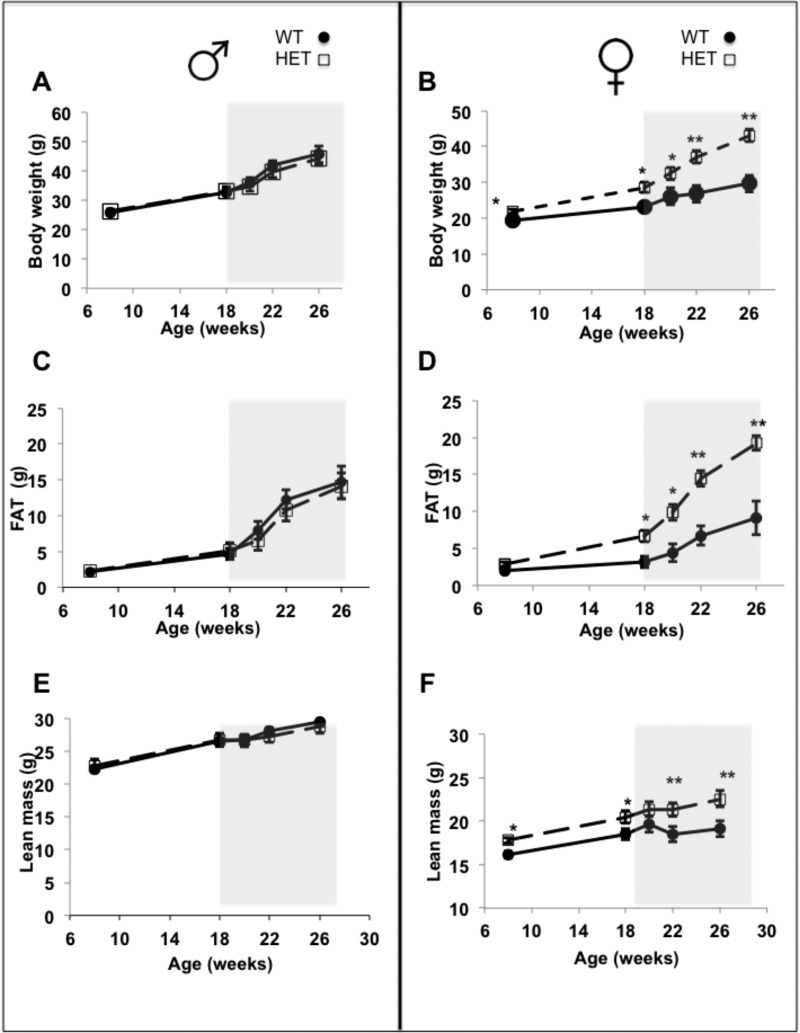
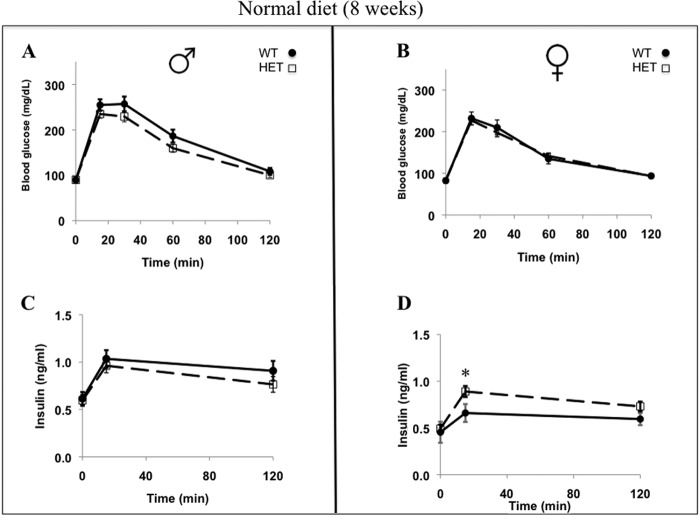
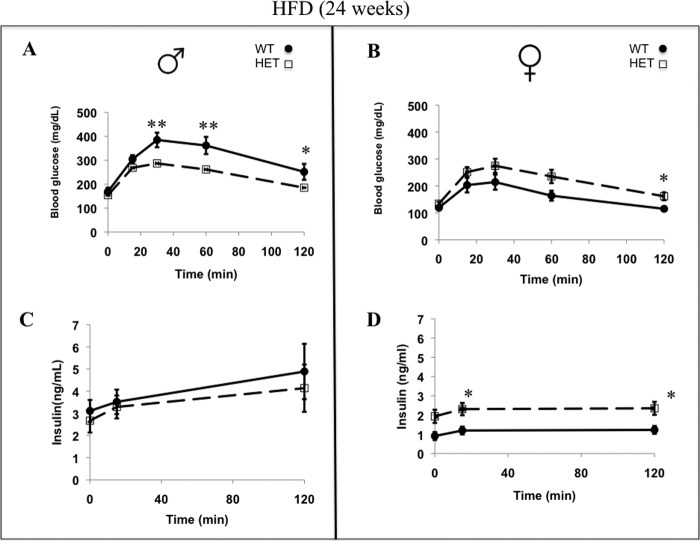
O-GlcNAc cycling is maintained by the reciprocal activities of the O-GlcNAc transferase and the O-GlcNAcase (OGA) enzymes. O-GlcNAc transferase is responsible for O-GlcNAc addition to serine and threonine (Ser/Thr) residues and OGA for its removal. Although the Oga gene (MGEA5) is a documented human diabetes susceptibility locus, its role in maintaining insulin-glucose homeostasis is unclear. Here, we report a conditional disruption of the Oga gene in the mouse. The resulting homozygous Oga null (KO) animals lack OGA enzymatic activity and exhibit elevated levels of the O-GlcNAc modification. The Oga KO animals showed nearly complete perinatal lethality associated with low circulating glucose and low liver glycogen stores. Defective insulin-responsive GSK3β phosphorylation was observed in both heterozygous (HET) and KO Oga animals. Although Oga HET animals were viable, they exhibited alterations in both transcription and metabolism. Transcriptome analysis using mouse embryonic fibroblasts revealed deregulation in the transcripts of both HET and KO animals specifically in genes associated with metabolism and growth. Additionally, metabolic profiling showed increased fat accumulation in HET and KO animals compared with WT, which was increased by a high fat diet. Reduced insulin sensitivity, glucose tolerance, and hyperleptinemia were also observed in HET and KO female mice. Notably, the respiratory exchange ratio of the HET animals was higher than that observed in WT animals, indicating the preferential utilization of glucose as an energy source. These results suggest that the loss of mouse OGA leads to defects in metabolic homeostasis culminating in obesity and insulin resistance.

Keywords: Glycogen Synthase Kinase 3 (GSK-3); Metabolism; Mouse Genetics; O-GlcNAcase; O-GlcNAcylation; O-Linked N-Acetylglucosamine (O-GlcNAc); Perinatal Lethality.


Figures

FIGURE 1.
FIGURE 1.
A, schematic diagram of the mouse Oga gene. B, Cre-loxP insertion strategy targeting Oga deletion at exon 1. C, breeding strategy employed to generate the Oga KO mice. Male chimeric mice bearing a floxed Oga allele were crossed with female MMTV-Cre mice expressing Cre in the oocyte in a two-step breeding strategy to remove both neo and floxed sites. HET Oga animals with a floxed neo cassette were intercrossed with siblings, resulting in Oga KO animals with 3% perinatal survival. D, PCR data confirming the Oga deletion status in HET and KO animals.
FIGURE 2.
FIGURE 2.
Deletion of Oga is perinatal lethal. A, survival of Oga KO animals compared with their HET and WT littermates at indicated time points. Numbers of each genotype are indicated on the graph. B, weight distribution (in grams) of pups of each genotype at birth (WT n = 31, HET n = 52, and KO n = 16). P0 Oga KO animals are significantly smaller than their WT or HET littermates. C, histological examination of hematoxylin and eosin-stained sagittal sections from WT and KO embryos at E18.5 did not reveal any gross developmental defects. D, live pups at P0 (birth). Genotypes are shown below each pup. Note that the Oga KO pup shows normal color and no sign of respiratory distress compared with its WT and KO littermates.
FIGURE 3.
FIGURE 3.
OGA and OGT expression in transgenic tissues. A, mRNA levels of the long and short isoforms of Oga in adult liver tissues from all genotypes. No mRNA transcript is produced in Oga null mice. Ribosomal 18 S rRNA (lower panel) was used as a control. B, Western blots probed with anti-OGA antibody demonstrate the loss of an immunoreactive band at 130 kDa, the expected size of the OGA protein, in KO tissue. This band is observed at intermediate levels in HET tissues. C, Oga deletion exhibited greatly increased O-GlcNAcylated protein levels as detected by anti-O-GlcNAc antibody (CTD110.6 antibody, green channel) in adult liver tissues (left) and newborn kidney (right, RL2 antibody green channel). HET tissues exhibit a slight increase in O-GlcNAcylation as compared with WT. Actin bands (red channel) show similar amounts of protein for all three genotypes. D, Western blot analysis of tissue derived from both adult liver and neonate kidney of HET and KO mice shows increased OGT levels as compared with that observed in tissue from WT mice. Standards on the left apply to both blots because they were derived from a single Western blot.
FIGURE 4.
FIGURE 4.
Glucose homeostasis is impaired in Oga KO animals. A, glucose levels from whole blood was measured for each genotype at birth (0 h) and after an 8-h fast. Data are presented as the mean ± S.E. The glucometer used had a detection limit of 10 mg/dl (dashed line). B, histological analysis of liver sections from P0 Oga WT and KO littermates. Sections were stained with hematoxylin/eosin, and glycogen content (noted with white arrows) was determined by PAS staining. C, graphed are the results of the imaging analysis. Glycogen content of KO livers was found to be significantly reduced compared with WT (p < 0.05). Bars represent the mean ± S.E. A total of four fields were measured for each liver (for each WT and KO n = 5).
FIGURE 5.
FIGURE 5.
Effects of Oga deletion in MEFs. A, semi-quantitative RT-PCRs followed by gel electrophoresis show transcripts levels of long and short Oga isoforms were reduced in HET and absent in KO cells relative to WT. 18 S rRNA gene expression was used as a control. B, O-GlcNAcase activity was measured using the fluorogenic OGA substrate FDGlcNAc in MEF cells. HET cells exhibited intermediate OGA activity using this assay, and very little activity was observed in KO cells. Data are the mean ± S.E. C, representative Western blot showing increased O-GlcNAcylation in Oga KO MEF cells. Blots are probed with CTD110.6 antibody (green channel) and actin (red channel). The immunoblot is representative of what was observed in three independent experiments. D, graph of the quantification of the representative blot in C done over 5 logs on images taken on an Odyssey Infrared Imaging System (LI-COR Biosciences) shows notable increases in O-GlcNAc band intensity in KO cells (normalized to actin levels). Error bars represent ± S.E.
FIGURE 6.
FIGURE 6.
A, Western blots from MEF cells probed with GSK3β Ser(P)-9 (Ser9-P) or total GSK3β (green) and actin (red) antibodies show basal and insulin-mediated GSK3β Ser-9 phosphorylation increased in Oga KO MEF cells compared with WT cells (WT MEFs were from a female and both HET and KO MEFs from a male). B, graph showing both increased basal GSK3β phosphorylation in KO MEFs compared with WT MEFs and the notable insulin (Ins)-dependent reduction in phosphorylation levels observed specifically in KO MEFs. Densitometry data from two independent experiments are represented. Each of the GSK3β species was normalized first to actin alone, and then the ratio of GSK3β Ser(P)-9 to total GSK3β was determined. The WT ratio under basal conditions was set at 100%, and the other ratios are plotted as a percentage of this to evaluate both the GSK3β phosphorylation levels in the mutant lines and to determine phosphorylation changes upon insulin stimulation. Values are means ± S.E. C and D, Western blots showing total GSK3β expression in adults (all females) and newborn livers (WT and KO were each from a male and HET was from a female) corroborated MEF data. GSK3β expression increased in HET and KO mice tissues compared with WT.
FIGURE 7.
FIGURE 7.
A, microarray data quality assessment using principal component analysis (PCA) shows replicate samples clustering in each genotype. B, hierarchical clustering of 838 genes that were found to be differentially expressed by 2-fold in WT versus KO MEFs. Each row represents a single sample in triplicate per genotype, and each column is a gene. C, overlap of statistically significant genes from each comparison are shown in the Venn diagram. The diagram shows the distribution of genes that are differentially expressed by 2-fold in all three groups (p < 0.05% and false discovery ratio of 0.01). D, Gene Ontology enrichment analysis of differentially expressed genes from the KO versus WT shows the high enrichment levels in genes associated with growth and metabolism.
FIGURE 8.
FIGURE 8.
Increases in RER values suggest a global change in metabolism in the HET animals compared with their WT littermates. A, measurement of the VCO2/VO2 ratio in several light/dark cycles was performed after acclimatization (WT n = 4 and HET n = 5 animals). Data are represented as curve fit to the mean. B, HET animals showed consistently higher RER values in both light and dark cycles that reached statistical significance. Increases in total RER measured over 24 h were observed both in male and female HET mice.
FIGURE 9.
FIGURE 9.
Growth curves (A and B), fat (C and D), and lean mass composition (E and F) were determined in males (left) and in females (right) from 8 to 26 weeks of age. Fat and lean mass were measured using an Echo MRI Bioanalyzer. Data are shown as mean ± S.E. using WT (females n = 12 males; n = 15) and HET (females n = 29 males n = 18). One-way ANOVA tests were used to determine statistical significance as follows: *, p < 0.05; **, p < 0.01. The gray boxes indicate the start of the 8-week HFD feeding period.
FIGURE 10.
FIGURE 10.
Glucose tolerance test (A and B) and insulin levels (C and D) of WT and HET mice fed a normal diet at 8 weeks of age (WT (males n = 15; females n = 12) and HET mice (males n = 18; females n = 29)). Data are presented as mean ± S.E., and statistical significance was calculated by one-way ANOVA test and is denoted by the asterisk (p < 0.05). Glucose tolerance tests were performed as described under “Materials and Methods.”
FIGURE 11.
FIGURE 11.
Glucose tolerance test (A and B) and insulin levels (C and D) of WT and HET mice that had been fed a HFD for the previous 4 weeks at 24 weeks of age (WT (males n = 15; females n = 12) and HET mice (males n = 18; females n = 29)). Data are presented as mean ± S.E., and statistical significance was calculated by one-way ANOVA test and is denoted by asterisks (p < 0.05). For glucose tolerance tests, animals were injected with 1 mg/g of body weight, and blood glucose was measured at the indicated time intervals.

References

    1. Butkinaree C., Park K., Hart G. W. (2010) O-Linked β-N-acetylglucosamine (O-GlcNAc): Extensive crosstalk with phosphorylation to regulate signaling and transcription in response to nutrients and stress. Biochim. Biophys. Acta 1800, 96–106 - PMC - PubMed
    1. Ma J., Hart G. W. (2014) O-GlcNAc profiling: from proteins to proteomes. Clin. Proteomics 11, 8. - PMC - PubMed
    1. Bond M. R., Hanover J. A. (2013) O-GlcNAc cycling: a link between metabolism and chronic disease. Annu. Rev. Nutr. 33, 205–229 - PMC - PubMed
    1. Harwood K. R., Hanover J. A. (2014) Nutrient-driven O-GlcNAc cycling–think globally but act locally. J. Cell Sci. 127, 1857–1867 - PMC - PubMed
    1. Lubas W. A., Frank D. W., Krause M., Hanover J. A. (1997) O-Linked GlcNAc transferase is a conserved nucleocytoplasmic protein containing tetratricopeptide repeats. J. Biol. Chem. 272, 9316–9324 - PubMed

Publication types