. 2015 Nov;25(11):4273-83.
doi: 10.1093/cercor/bhu323. Epub 2015 Jan 16.

Attentional Enhancement of Auditory Mismatch Responses: a DCM/MEG Study

Affiliations

Attentional Enhancement of Auditory Mismatch Responses: a DCM/MEG Study

Ryszard Auksztulewicz et al. Cereb Cortex. 2015 Nov.

Abstract

Despite similar behavioral effects, attention and expectation influence evoked responses differently: Attention typically enhances event-related responses, whereas expectation reduces them. This dissociation has been reconciled under predictive coding, where prediction errors are weighted by precision associated with attentional modulation. Here, we tested the predictive coding account of attention and expectation using magnetoencephalography and modeling. Temporal attention and sensory expectation were orthogonally manipulated in an auditory mismatch paradigm, revealing opposing effects on evoked response amplitude. Mismatch negativity (MMN) was enhanced by attention, speaking against its supposedly pre-attentive nature. This interaction effect was modeled in a canonical microcircuit using dynamic causal modeling, comparing models with modulation of extrinsic and intrinsic connectivity at different levels of the auditory hierarchy. While MMN was explained by recursive interplay of sensory predictions and prediction errors, attention was linked to the gain of inhibitory interneurons, consistent with its modulation of sensory precision.

Keywords: attention; dynamic causal modeling; expectation; magnetoencephalography; predictive coding.


Figures

Figure 1.
Figure 1.
Behavioral paradigm. Auditory stimuli were presented early (600 ms after fixation offset) or late (1400 ms) in a given trial, with 50% stimulus presentation likelihood for each of the 2 latencies independently. Across trials, the stimuli formed a roving oddball sequence (panel below) of tones at 6 possible frequencies and with 5–10 repetitions per frequency. Temporal attention was manipulated at the block level, following a visual cue specifying which latency will be probed at the end of each trial for tone omission detection.
Figure 2.
Figure 2.
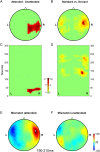
Effects of attention (top row) and expectation (bottom row) on ERF amplitude. (AD) Left column: the topography of significant effects; the main effect of attention thresholded at T = 2.68 (P < 0.005 peak-level, corrected for multiple comparisons at a cluster-level pFWE < 0.05); the main effect of expectation thresholded at F = 10.34 (P < 0.005 peak-level, corrected for multiple comparisons at a cluster-level pFWE < 0.05). Right column: the timing of the significant effects (same thresholding as for the topography plots; x-axis: left-right topography, y-axis : peristimulus time). (E,F) Topography of the mismatch response (auditory standards vs. deviants) for the attended (left) and unattended (right) conditions. Plots show ERF amplitude averaged over 190–210 ms post-stimulus, corresponding to the timing of a significant interaction between attention and expectation (P < 0.005 peak-level, corrected for multiple comparisons at a cluster-level pFWE < 0.05). Asterisk indicates the topography of the significant interaction cluster. Post-hoc paired t-tests revealed that ERF amplitude over right fronto-temporal channels was significantly different between standards and deviants for the attended condition, but not for the unattended condition.
Figure 3.
Figure 3.
Source selection for DCM. Network nodes were selected based on a multiple sparse priors source reconstruction of the mismatch response (deviants vs. standards) using a time window in which there was a significant interaction between attention and expectation. Sources in STG, the right IFG, and the right intraparietal sulcus (IPS) were used to model the observed effects. Additionally, sources in bilateral primary auditory cortices (A1) were included in all models. See main text for details.
Figure 4.
Figure 4.
Dynamic causal modeling: optimizing the extrinsic connectivity structure. (A) All DCMs were based on a canonical microcircuit source architecture. Each source is modeled using 4 neuronal populations (spiny stellate cells in Layer 4, superficial and deep pyramidal cells in Layers 2/3 and 4/5, respectively, and inhibitory interneurons), linked by ordinary differential equations describing their current and voltage dynamics, and differing with respect to their intrinsic connectivity (with other populations; thin arrows, black: excitatory, red: inhibitory) and extrinsic connectivity (with other sources; thick arrows). The ascending extrinsic connections are considered excitatory and represent prediction errors, whereas the descending extrinsic connections are considered inhibitory and represent sensory predictions. Finally, each population is characterized by a gain parameter (inhibitory self-connections) encoding precision. (B) 9 alternative models were fitted to individual subjects' ERFs corresponding to the unattended auditory standards. All models included thalamic auditory input to bilateral A1 and differed with respect to the number of fronto-parietal sources and the extrinsic connectivity between them and the rest of the network. (C) Fixed-effects Bayesian model selection revealed that the model (shaded gray in the left panel) including both fronto-parietal sources (rIF: right inferior frontal gyrus; rIP: right intraparietal sulcus) and bilateral connectivity with the superior temporal gyrus sources (ST) outperformed all other models. (D) Modeling the contextual effects on extrinsic connectivity. 16 alternative models were designed, where each contextual factor (i.e., attention and expectation) could modulate a different subset of extrinsic connections between bilateral A1 and STG and between bilateral STG and the fronto-parietal sources: only feedforward connections (models “F”), only feedback connections (models “B”), both feedforward and feedback connections (models “R”), or no extrinsic connections (models “N”). Models were compared using fixed-effects Bayesian model selection. (E) The winning model had a posterior probability of >99% and allowed for both forward and backward connections to be modulated by expectation, but only the feedback connections to be modulated by attention.
Figure 5.
Figure 5.
Modeling the contextual effects on intrinsic connectivity. (A) Each contextual factor could modulate a different subset of intrinsic connectivity parameters. The null models were equivalent to the winning model in Figure 4E, allowing for only extrinsic connectivity modulation by attention or expectation (models labeled “Null”). In further models, intrinsic modulation by attention (Att) and/or expectation (Exp) was placed in bilateral A1 on either the superficial pyramidal cells (“A1_SP”) or inhibitory interneurons (“A1_II”), in bilateral STG (superficial pyramidal cells: “STG_SP,” inhibitory interneurons: “STG_II”), in the fronto-parietal sources (superficial pyramidal cells: “FP_SP,” inhibitory interneurons: “FP_II”), or at all 3 hierarchical stages (superficial pyramidal cells: “Full_SP,” inhibitory interneurons: “Full_II”). (B) The winning model allowed for an attentional modulation of the gain of inhibitory interneurons in bilateral A1. (C) Posterior mean of parameters encoding the change of activity-dependent gain of inhibitory interneurons due to attention (relative to the unattended baseline; left panel) and the attention-dependent modulation of the extrinsic top-down inhibitory connection from STG to A1. For both left and right A1 sources, the gain of inhibitory interneurons is significantly stronger following attention (>99% posterior probability). The top-down connection is significantly modulated only in the left hemisphere. (D) Model fits of the winning model. Top row: observed responses over 275 MEG channels and 0–300 ms post-stimulus time. Bottom row: responses predicted by the winning model. Columns correspond to mismatch responses for attended and unattended conditions, respectively.
Figure 6.
Figure 6.
Contribution analysis. Changes in A1 source activity as a function of changes in state-dependent gain of inhibitory interneurons (left panel) and superficial pyramidal cells (right panel), averaged across hemispheres. Group posteriors of parameters were obtained from fixed-effects Bayesian parameter averaging across subjects. Gain modulation of inhibitory interneurons leads to an earlier differential response between attended and unattended stimuli, as compared with gain modulation of superficial pyramidal cells.
Figure 7.
Figure 7.
The left panel depicts interactions between (superficial and deep) pyramidal cells with inhibitory interneurons. We have divided the inhibitory interneurons into 3 dominant subtypes (Parvalbumin-positive PV, somatostatin SST, and vasoactive intestinal peptide expressing interneurons, VIP). The intrinsic connectivity is based upon the recent optogenetic studies (Pfeffer et al. 2013), nuanced to fit our purposes. In brief, we have assumed that PV interneurons are densely and reciprocally connected to the pyramidal cells, particularly through perisomatic compartments, whereas SST cells form synapses on their dendrites. The right panel shows a simplified architecture implicit in our dynamic causal models. Here, we have absorbed the recurrent inhibitory (PV/pyramidal cell) dynamics into an inhibitory recurrent connection, whereas the SST/VIP interneurons provide (dendritic) inhibitory drive. This allows us to map the ING and PING models onto the canonical microcircuits used in DCM. In this setting, the PING model emphasizes recurrent interactions among PV cells as modeled by the inhibitory recurrent connections on superficial pyramidal cells. In contrast, the ING model corresponds to the influence of (SST/VIP) inhibitory interneurons on pyramidal cells.

References

    1. Arnal LH, Giraud AL. 2012. Cortical oscillations and sensory predictions. Trends Cogn Sci. 16:390–398. - PubMed
    1. Bastos AM, Usrey WM, Adams RA, Mangun GR, Fries P, Friston KJ. 2012. Canonical microcircuits for predictive coding. Neuron. 76:695–711. - PMC - PubMed
    1. Brown HR, Friston KJ. 2012. Dynamic causal modeling of precision and synaptic gain in visual perception—an EEG study. Neuroimage. 63:223–231. - PMC - PubMed
    1. Brown HR, Friston KJ. 2013. The functional anatomy of attention: a DCM study. Front Hum Neurosci. 7:784. - PMC - PubMed
    1. Chaumon M, Kveraga K, Barrett LF, Bar M. 2013. Visual predictions in the orbitofrontal cortex rely on associative content. Cereb Cortex 2411:2899–2907. - PMC - PubMed

Publication types