

doi: 10.1038/ncomms6890.
Biological interpretation of genome-wide association studies using predicted gene functions
Collaborators,
Affiliations
- PMID: 25597830
- PMCID: PMC4420238
- DOI: 10.1038/ncomms6890
Item in Clipboard
Biological interpretation of genome-wide association studies using predicted gene functions
Nat Commun.
.
Abstract
The main challenge for gaining biological insights from genetic associations is identifying which genes and pathways explain the associations. Here we present DEPICT, an integrative tool that employs predicted gene functions to systematically prioritize the most likely causal genes at associated loci, highlight enriched pathways and identify tissues/cell types where genes from associated loci are highly expressed. DEPICT is not limited to genes with established functions and prioritizes relevant gene sets for many phenotypes.
Conflict of interest statement
Figures
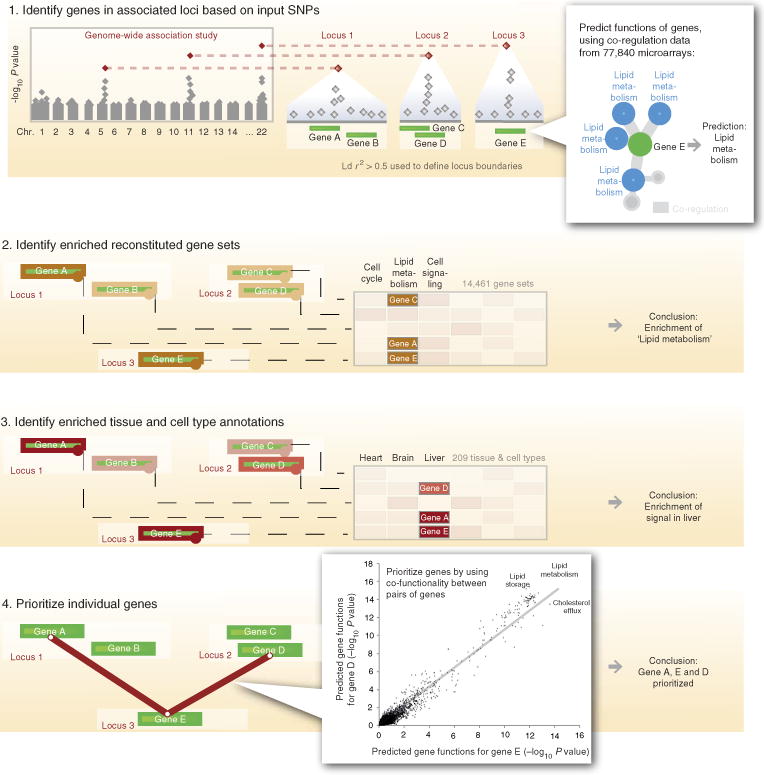
DEPICT is designed to identify likely causal genes, functional or phenotypic gene sets that are enriched in genes within associated loci, and tissues or cell types that are implicated by the associated loci. DEPICT takes as input a set of trait-associated SNPs and uses them to identify independently associated loci that may comprise up to several genes. DEPICT uses co-regulation data from 77,840 microarrays to predict genes’ biological functions across 14,461 gene sets representing a wide spectrum of biological annotations and to construct 14,461 ‘reconstituted’ gene sets. DEPICT then uses this information to identify reconstituted gene sets that enrich for genes in the associated loci, and to prioritize genes at associated loci, by identifying genes in different loci that have similar predicted functions. Finally, DEPICT relies on 37,427 human gene expression microarrays to assess whether genes in associated loci are highly expressed in any of 209 tissue/cell type annotations.
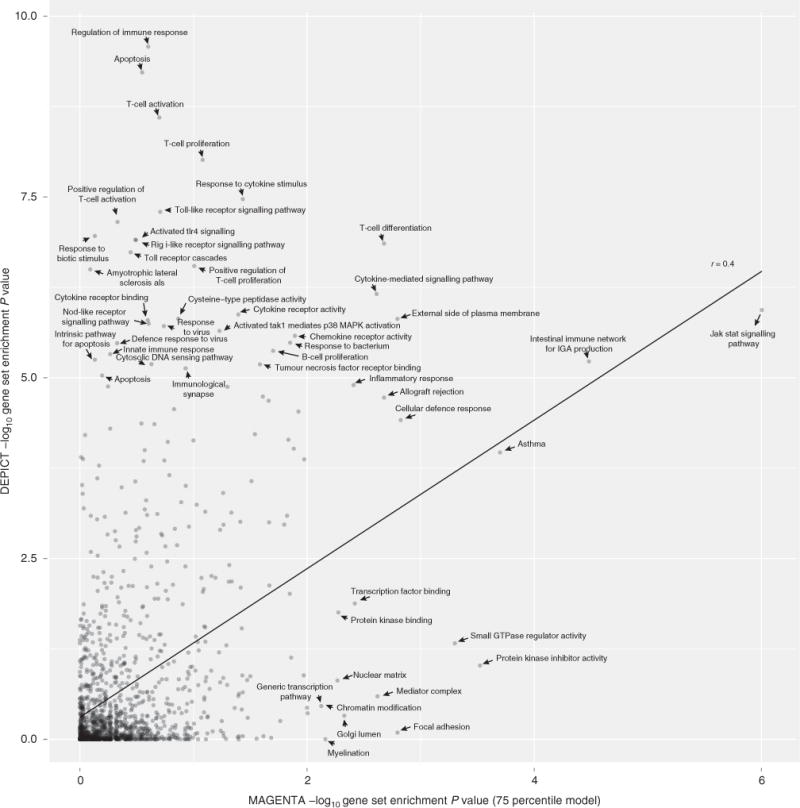
Comparison of DEPICT, which was run with 63 genome-wide significant Crohn’s disease SNPs as input, and MAGENTA, which was run using the complete list of Crohn’s disease summary statistics (downloaded from www.ibdgenetics.org ). DEPICT was run using 1,280 reconstituted gene sets, and MAGENTA was run using the predefined versions of the same 1,280 gene sets. Both methods were run with default settings and non-adjusted enrichment P values are plotted.
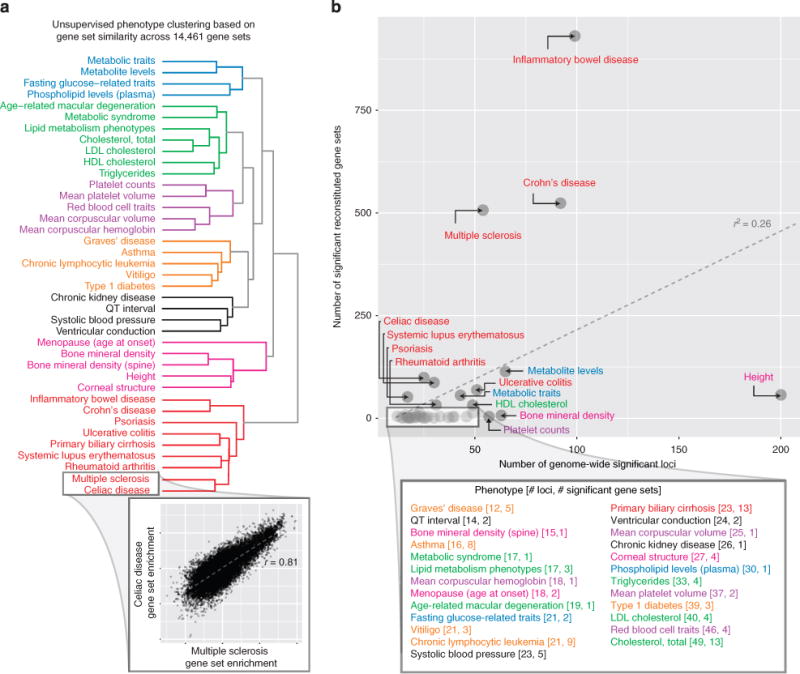
DEPICT identified at least one significant reconstituted gene set for 39 traits and diseases from the GWAS Catalog (we investigated 61 traits with at least 10 independent genome-wide significant loci). (a) Unsupervised clustering of the 39 phenotypes based on their gene set enrichment scores across all reconstituted gene sets yielded 7 clusters of phenotypes (roughly corresponding to metabolic, lipids, haematological, autoimmune, blood pressure/cardiac conduction, growth/bone/menopause and a second autoimmune cluster), which indicates that DEPICT is able to identify phenotypic-specific and biologically relevant gene sets for a wide range of phenotypes. The inset shows that the multiple sclerosis and coeliac disease gene set enrichment scores are highly correlated and therefore were clustered within the same clade. (b) The number of genome-wide significant loci for a given phenotype was positive correlated with the number of significant (FDR<0.05) reconstituted gene sets for that phenotype (Pearson r2 = 0.26, t-test P value = 6.86 × 10⁻⁵).
References
Publication types
MeSH terms
Grants and funding
- R01 DK075787/DK/NIDDK NIH HHS/United States
- U01 GM092691/GM/NIGMS NIH HHS/United States
- MR/N01104X/1/MRC_/Medical Research Council/United Kingdom
- ImNIH/Intramural NIH HHS/United States
- 098395/WT_/Wellcome Trust/United Kingdom
- R01 AR063759/AR/NIAMS NIH HHS/United States
- P30 DK020572/DK/NIDDK NIH HHS/United States
- R01 HL117078/HL/NHLBI NIH HHS/United States
- P30 CA071789/CA/NCI NIH HHS/United States
- G1001799/MRC_/Medical Research Council/United Kingdom
- CZB/4/672/CSO_/Chief Scientist Office/United Kingdom
- 2R01DK075787/DK/NIDDK NIH HHS/United States
- UH2 AR067677/AR/NIAMS NIH HHS/United States
- MR/K006584/1/MRC_/Medical Research Council/United Kingdom
- MR/K013351/1/MRC_/Medical Research Council/United Kingdom
LinkOut - more resources
Full Text Sources
Other Literature Sources
