. 2015 Jan 19:6:5969.
doi: 10.1038/ncomms6969.

Novel variation and de novo mutation rates in population-wide de novo assembled Danish trios

Affiliations

Novel variation and de novo mutation rates in population-wide de novo assembled Danish trios

Søren Besenbacher et al. Nat Commun. .

Abstract

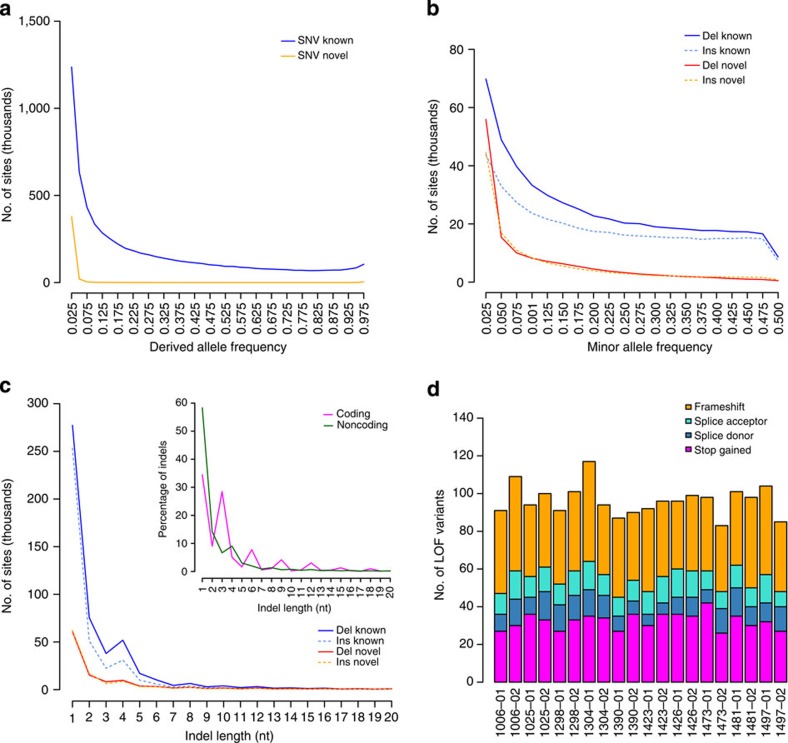
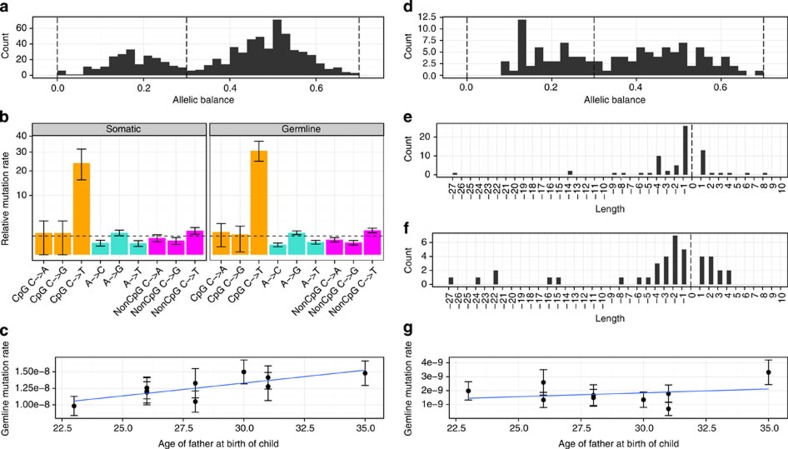
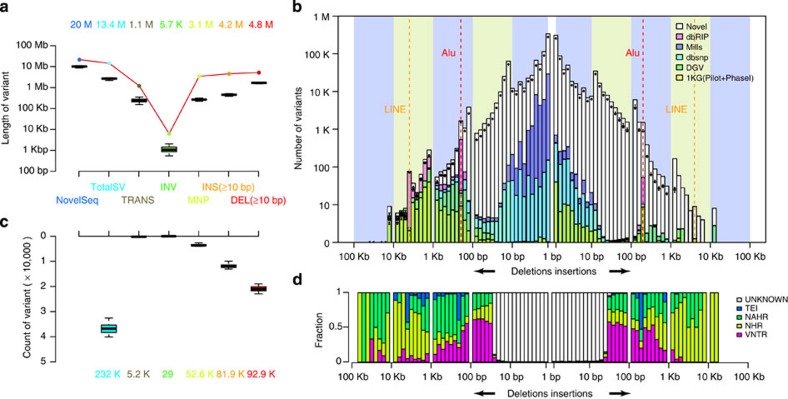
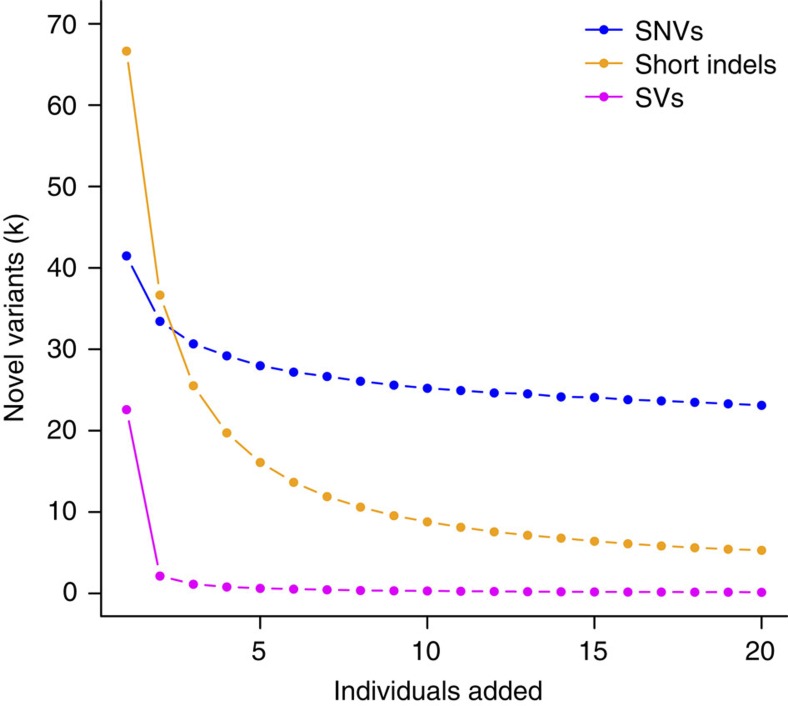
Building a population-specific catalogue of single nucleotide variants (SNVs), indels and structural variants (SVs) with frequencies, termed a national pan-genome, is critical for further advancing clinical and public health genetics in large cohorts. Here we report a Danish pan-genome obtained from sequencing 10 trios to high depth (50 × ). We report 536k novel SNVs and 283k novel short indels from mapping approaches and develop a population-wide de novo assembly approach to identify 132k novel indels larger than 10 nucleotides with low false discovery rates. We identify a higher proportion of indels and SVs than previous efforts showing the merits of high coverage and de novo assembly approaches. In addition, we use trio information to identify de novo mutations and use a probabilistic method to provide direct estimates of 1.27e-8 and 1.5e-9 per nucleotide per generation for SNVs and indels, respectively.


Figures

Figure 1
Figure 1. Allele frequencies and loss of function (LOF) mutations.
(a) Derived allele frequencies of bi-allelic known (n=6.69M, blue) and novel (n=415k, orange) SNVs with genotype information in all 20 parents. Fixed variants are excluded. (b) Folded minor allele frequencies of known deletions (n=510k, solid blue), known insertions (n=383k, dashed turquoise), novel deletions (n=136k, solid red) and novel insertions (n=126k, dashed orange) with regard to the reference genome. Only bi-allelic and non-fixed sites with genotype information in the 20 parents are included (for derived allele frequencies, see Supplementary Fig. 1). (c) Size distribution of bi-allelic and non-fixed indels (n=1.19M) and indels in coding regions only (n=1392, insert), legend as in b, for insert coding indels (purple) and non-coding (green). (d) Estimated number of LOF variants for each parent (n=20), in total 10.6% of the mutations was in olfactory genes and 4.1% in zinc finger proteins. Stop gains (magenta), splice donor (blue), splice acceptor (turquoise) and indel frameshift (orange).
Figure 2
Figure 2. De novo events in the trios.
(a) Allele balance of detected de novo SNVs (n=730). Variants with low allele balance (<0.3) are considered to be somatic mutations while variants with high allele balance (>0.3) are considered to be germline mutations. (b) Mutational context of somatic (n=222) and germline (n=508) de novo SNVs, assuming that there are no strand differences (that is, G->T mutations are considered equal to C->A mutations). Both somatic and germline mutations follow the same pattern of increased frequency of transitions versus transversions and an extremely high transition rate in CpG sites. Orange: CpG mutations, turquoise: mutations at A or T site and magenta: non-CpG mutations at C or G site. Error bars represent s.e.m. (c) Germline SNVs increase significantly with paternal age. The blue line is a linear fit to the age of the father at the child’s birth and germline SNV mutation rate, and the error bars represent s.e.m. (d) Allele balance of detected de novo indels (n=121). (e,f) The indel length distribution indicates that short deletions are more common than short insertions in both germline (n=70) (e) and somatic tissue (n=51) (f). (g) Germline indel rate show no compelling correlation with paternal age, the blue line is a linear fit to the age of the father at the child’s birth and germline indel mutation rate, and the error bars represent s.e.m.
Figure 3
Figure 3. Structural variants and novel sequences identified in the de novo assemblies of 10 trios.
(a) Length of the variants present in the individual assemblies (n=30), the total length is given by the coloured numbers. The lower and upper hinges of the boxes correspond to the 25th and 75th percentiles and the whiskers represent the 1.5 × inter-quartile range (IQR) extending from the hinges. See Supplementary Fig. 10 for definitions of different types of structural variants. (b) Same as a but count of variants instead, individual counts are shown as box plots and total count by coloured numbers. (c) Length distribution and novelty of the variants (n=232k, 50% reciprocal overlap). The box plots indicate the number of variants per individual (n=30) at a certain length range; see box plot definition in a. Red dashed line: Alu peak at 300–400 bp. Orange dashed line: LINE peak at 6–7 kbp. (d) Variant mechanism. The y-axis indicates the proportion of variants annotated with different mechanisms corresponding to the length range in c. NAHR, non-allelic homologous recombination (green); NHR, non-homologous rearrangement (yellow); TEI, transposable element insertion (blue); unknown (white); VNTR: variable number of tandem repeats (magenta).
Figure 4
Figure 4. Number of novel variants per sample.
Number of novel variants identified from adding additional unrelated individuals (n=20). The visualized data is the average of 1,000 random samples of the individual order. Blue, SNVs; magenta, SVs >50 bp; orange, short indels.

References

    1. Abecasis G. R. et al.. A map of human genome variation from population-scale sequencing. Nature 467, 1061–1073 (2010). - PMC - PubMed
    1. Abecasis G. R. et al.. An integrated map of genetic variation from 1,092 human genomes. Nature 491, 56–65 (2012). - PMC - PubMed
    1. Lam H. Y. K. et al.. Nucleotide-resolution analysis of structural variants using BreakSeq and a breakpoint library. Nat. Biotechnol. 28, 47–55 (2010). - PMC - PubMed
    1. Montgomery S. B. et al.. The origin, evolution, and functional impact of short insertion-deletion variants identified in 179 human genomes. Genome Res. 23, 749–761 (2013). - PMC - PubMed
    1. Mills R. E. et al.. Mapping copy number variation by population-scale genome sequencing. Nature 470, 59–65 (2011). - PMC - PubMed

Publication types