Clinical Trial
. 2015 Mar;56(3):722-736.
doi: 10.1194/jlr.P056002. Epub 2015 Jan 17.

Biomarkers of NAFLD progression: a lipidomics approach to an epidemic

Affiliations
Clinical Trial

Biomarkers of NAFLD progression: a lipidomics approach to an epidemic

D Lee Gorden et al. J Lipid Res. 2015 Mar.

Abstract

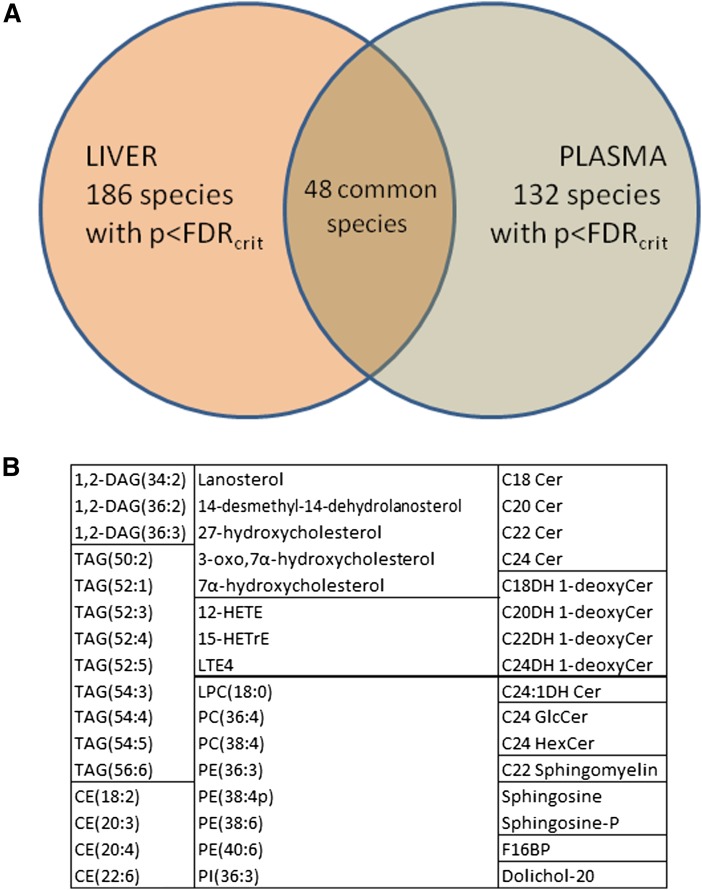
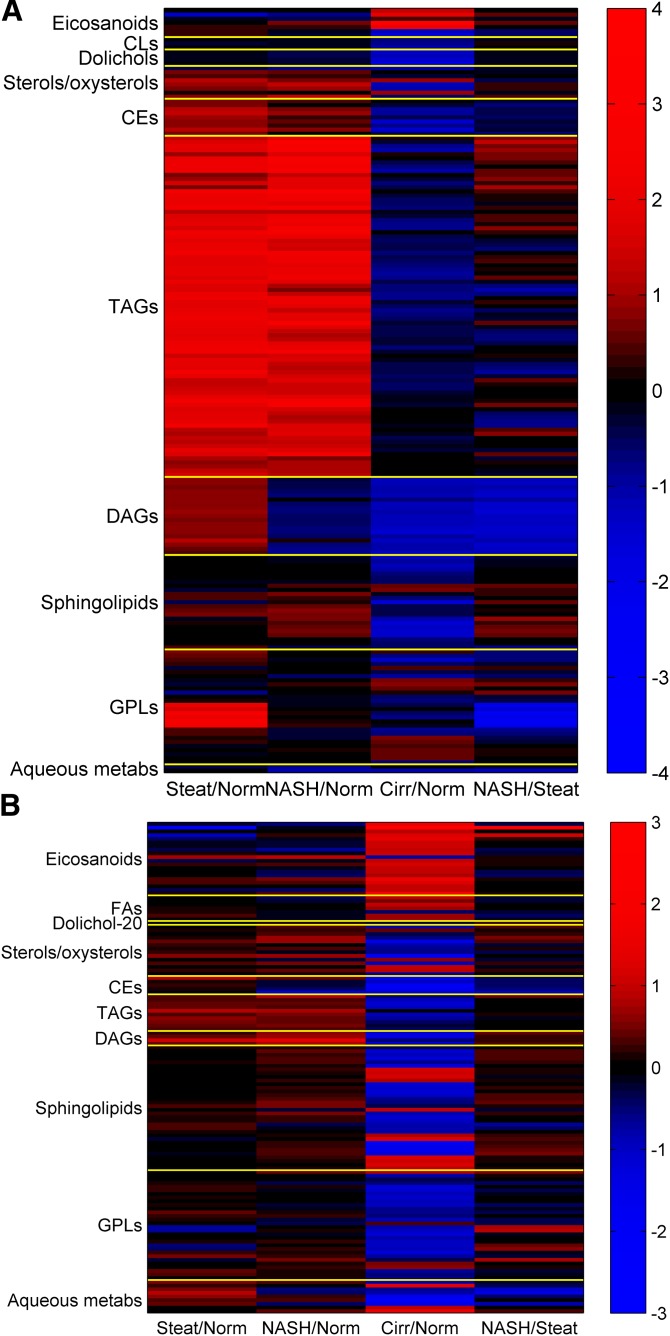
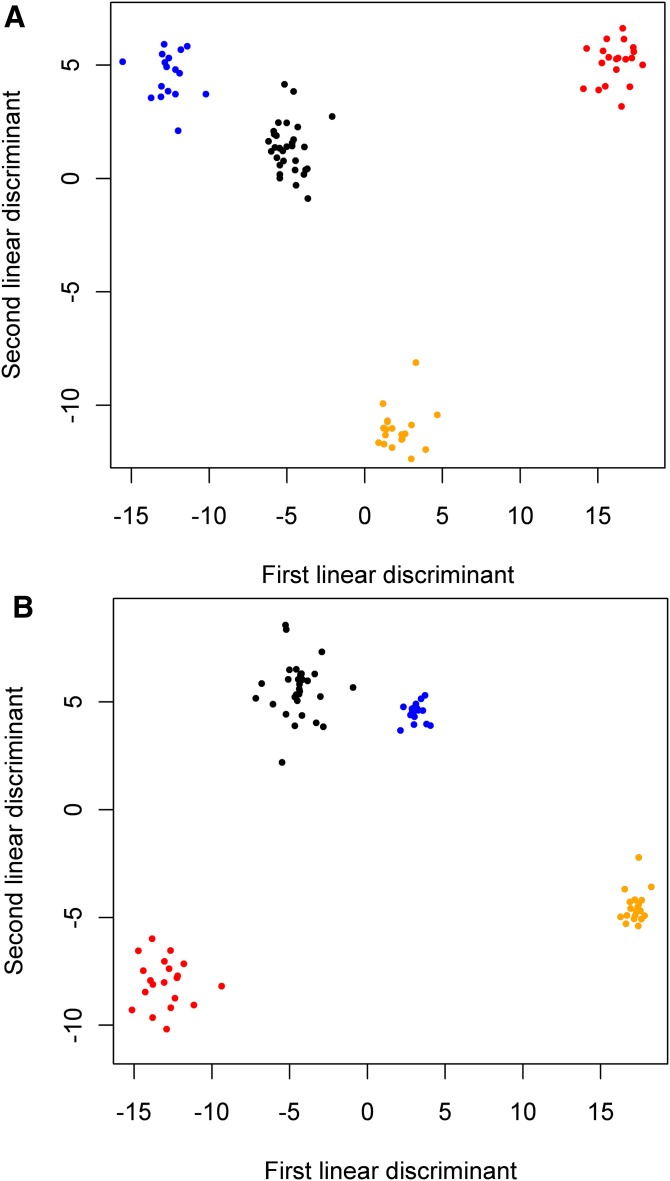
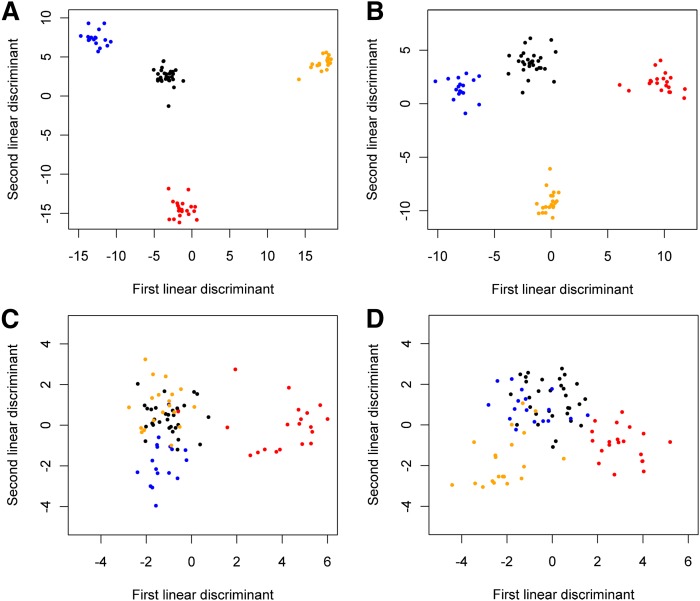
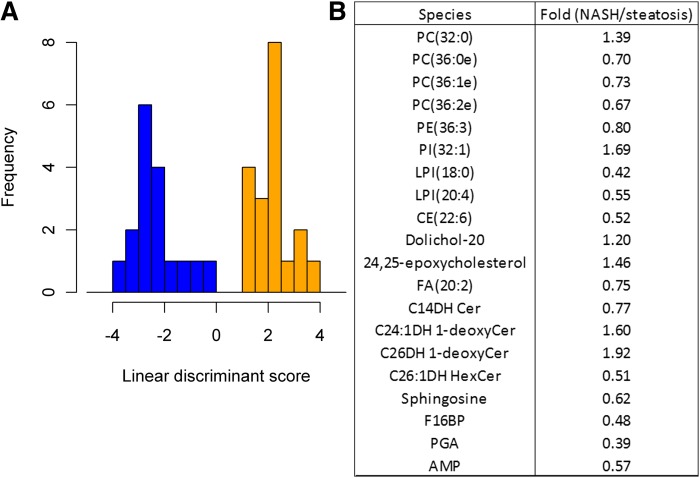
The spectrum of nonalcoholic fatty liver disease (NAFLD) includes steatosis, nonalcoholic steatohepatitis (NASH), and cirrhosis. Recognition and timely diagnosis of these different stages, particularly NASH, is important for both potential reversibility and limitation of complications. Liver biopsy remains the clinical standard for definitive diagnosis. Diagnostic tools minimizing the need for invasive procedures or that add information to histologic data are important in novel management strategies for the growing epidemic of NAFLD. We describe an "omics" approach to detecting a reproducible signature of lipid metabolites, aqueous intracellular metabolites, SNPs, and mRNA transcripts in a double-blinded study of patients with different stages of NAFLD that involves profiling liver biopsies, plasma, and urine samples. Using linear discriminant analysis, a panel of 20 plasma metabolites that includes glycerophospholipids, sphingolipids, sterols, and various aqueous small molecular weight components involved in cellular metabolic pathways, can be used to differentiate between NASH and steatosis. This identification of differential biomolecular signatures has the potential to improve clinical diagnosis and facilitate therapeutic intervention of NAFLD.

Keywords: diagnostic tools; mass spectrometry; nonalcoholic fatty liver disease; nonalcoholic steatohepatitis; phospholipids; sphingolipids.


Figures

Fig. 1.
Fig. 1.
Common analytes between liver and plasma. A: Venn diagram of species with FDR-adjusted significant P values overlapping in the liver and plasma. B: Listing of common analytes indicates major species in several lipid classes. DAGs, TAGs, CEs, and GPLs listed are almost all polyunsaturated while sphingolipids are primarily longer chain species.
Fig. 2.
Fig. 2.
Fold changes (log2) for species with FDR-adjusted significant P values in liver and plasma. A: Fold changes (log2) for species with FDR-adjusted significant P values in liver. A complete listing of the fold change values depicted above by individual species is found in supplementary Data File 1. B: Fold changes (log2) for species with FDR-adjusted significant P values in plasma. A complete listing of the fold change values depicted above by individual species is found in supplementary Data File 1.
Fig. 3.
Fig. 3.
LDA on plasma (A) and liver species (B) with top 80 ANOVA scores classified samples by disease status. Species used in LDA are listed in bold in supplementary Data File 1. In liver (B), the clusters for steatosis and steatohepatitis are noticeably tighter than for normal and cirrhosis. Blue, steatosis; black, normal; orange, steatohepatitis; red, cirrhosis.
Fig. 4.
Fig. 4.
Lipid classes in plasma distinguished between histological states by LDA. A: Sphingolipids best discriminated between histological states via LDA. B: GPLs with similarly strong discrimination between histological states. C: LDA on eicosanoids shows cirrhosis separating from other categories but normal, steatosis, and steatohepatitis clusters are merged. D: LDA on neutral lipids does not show a strong separation between disease stages. Blue, steatosis; orange, steatohepatitis; red, cirrhosis; black, normal.
Fig. 5.
Fig. 5.
Analysis of the results from LDA. A: Histogram of LDA results from the 20 plasma metabolites having the most statistically significant differences between NASH and steatotic samples as demonstrated by P values. When these species are used for classification, the two disease states are clearly distinguished. Blue, steatosis; orange, steatohepatitis. B: The list of 20 species used in (A) shows that a diverse spectrum of lipids and aqueous metabolites make up the signature distinguishing steatosis and NASH.
Fig. 6.
Fig. 6.
Comparison of log2 (fold-expression) levels of transcripts for genes related to ECM interaction between progressive disease states, Steatosis/normal (Norm), NASH/steatosis (Steat), and Cirrhosis (Cirr)/NASH. Differential expression of transcripts for several collagen genes is present in the transition between steatosis and NASH and intensifies in cirrhosis. Genes listed are curated from ECM receptor interaction module feeding the focal adhesion network in WikiPathways. When more than one transcript for a gene was detected, the one with the highest average abundance was used. Color key: values shaded red correspond to >1.5-fold differences, blue for <0.67-fold, and gray for transcripts not detected in the array. All genes had P < 0.05 by ANOVA analysis except LAMB1, LAMB3 (P = 0.058), COL4A6, and COMP.

References

    1. Williams C. D., Stengel J., Asike M. I., Torres D. M., Shaw J., Contreras M., Landt C. L., Harrison S. A. 2011. Prevalence of nonalcoholic fatty liver disease and nonalcoholic steatohepatitis among a largely middle-aged population utilizing ultrasound and liver biopsy: a prospective study. Gastroenterology. 140: 124–131. - PubMed
    1. Safar Zadeh E., Lungu A. O., Cochran E. K., Brown R. J., Ghany M. G., Heller T., Kleiner D. E., Gorden P. 2013. The liver diseases of lipodystrophy: the long-term effect of leptin treatment. J. Hepatol. 59: 131–137. - PMC - PubMed
    1. Cohen J. C., Horton J. D., Hobbs H. H. 2011. Human fatty liver disease: old questions and new insights. Science. 332: 1519–1523. - PMC - PubMed
    1. Gan L., Chitturi S., Farrell G. C. 2011. Mechanisms and implications of age-related changes in the liver: nonalcoholic fatty liver disease in the elderly. Curr. Gerontol. Geriatr. Res. 2011: 831536. - PMC - PubMed
    1. Caldwell S., Argo C. 2010. The natural history of non-alcoholic fatty liver disease. Dig. Dis. 28: 162–168. - PubMed

Publication types