. 2015 Mar;56(3):599-611.
doi: 10.1194/jlr.M056069. Epub 2015 Jan 17.

A lipidomic screen of hyperglycemia-treated HRECs links 12/15-Lipoxygenase to microvascular dysfunction during diabetic retinopathy via NADPH oxidase

Affiliations

A lipidomic screen of hyperglycemia-treated HRECs links 12/15-Lipoxygenase to microvascular dysfunction during diabetic retinopathy via NADPH oxidase

Ahmed S Ibrahim et al. J Lipid Res. 2015 Mar.

Abstract

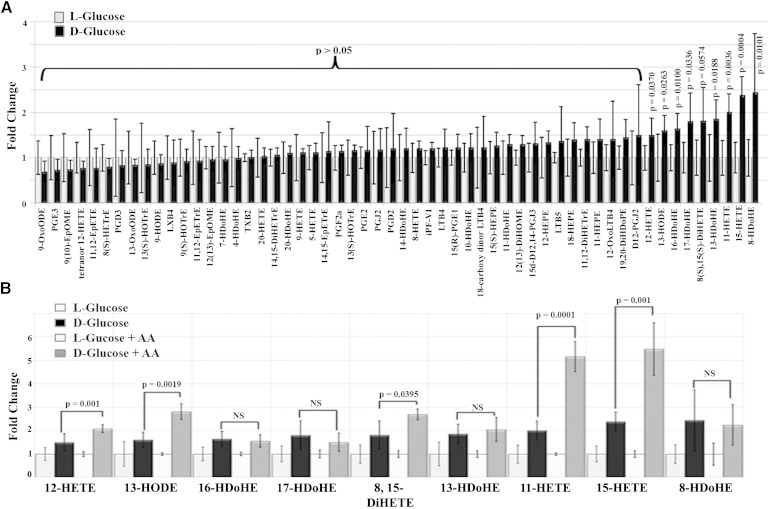
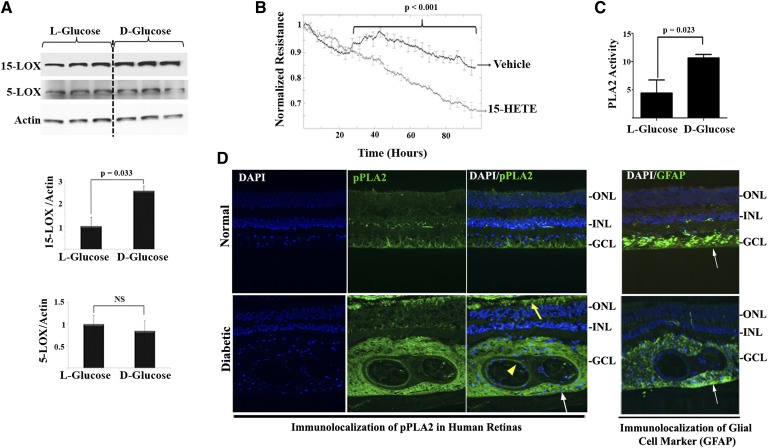
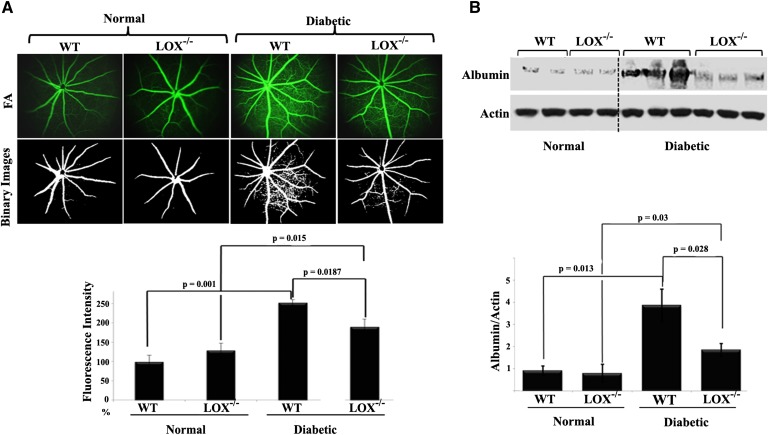
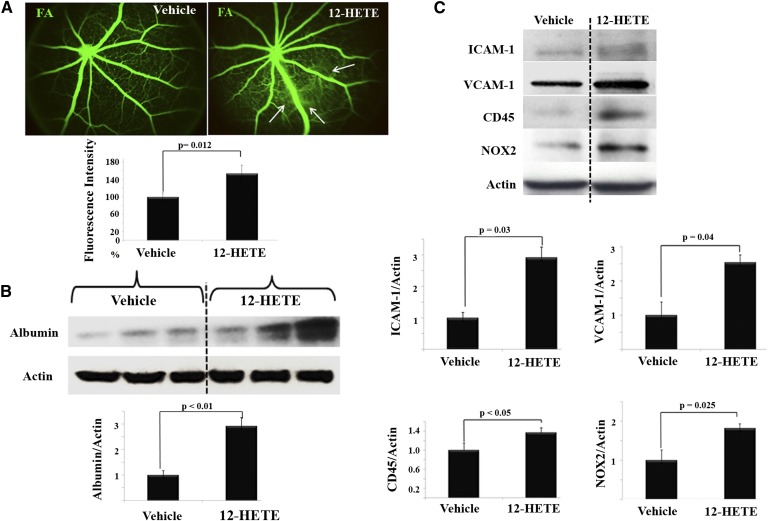
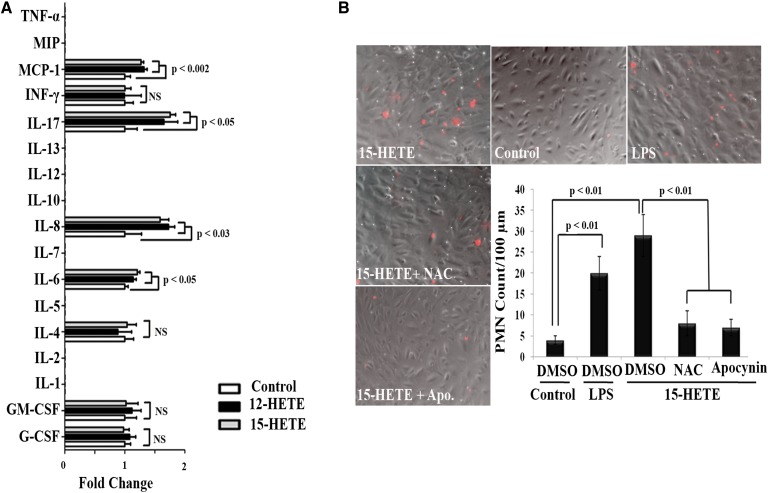
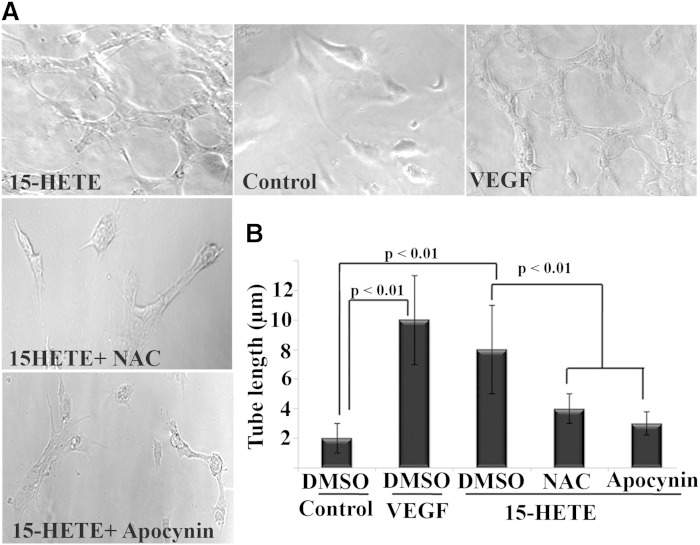
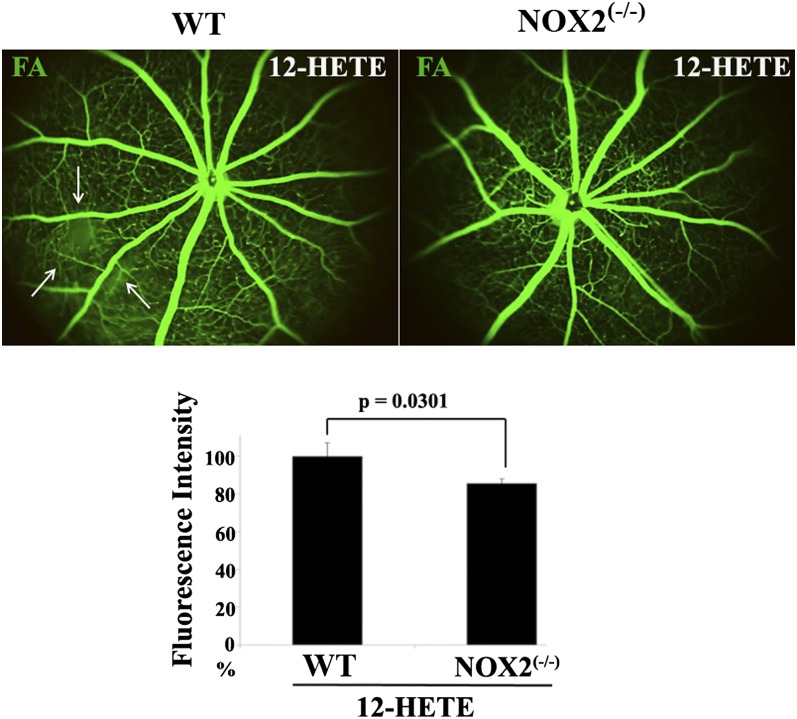
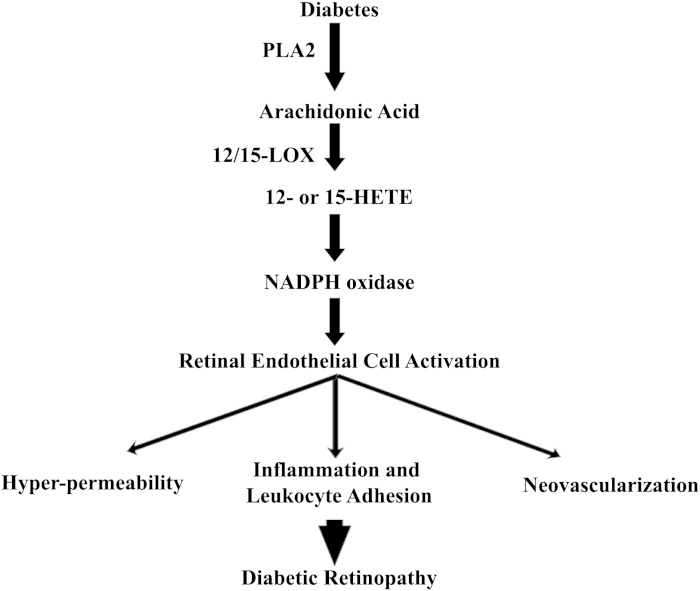
Retinal hyperpermeability and subsequent macular edema is a cardinal feature of early diabetic retinopathy (DR). Here, we investigated the role of bioactive lipid metabolites, in particular 12/15-lipoxygenase (LOX)-derived metabolites, in this process. LC/MS lipidomic screen of human retinal endothelial cells (HRECs) demonstrated that 15-HETE was the only significantly increased metabolite (2.4 ± 0.4-fold, P = 0.0004) by high glucose (30 mM) treatment. In the presence of arachidonic acid, additional eicosanoids generated by 12/15-LOX, including 12- and 11-HETEs, were significantly increased. Fluorescein angiography and retinal albumin leakage showed a significant decrease in retinal hyperpermeability in streptozotocin-induced diabetic mice lacking 12/15-LOX compared with diabetic WT mice. Our previous studies demonstrated the potential role of NADPH oxidase in mediating the permeability effect of 12- and 15-HETEs, therefore we tested the impact of intraocular injection of 12-HETE in mice lacking the catalytic subunit of NADPH oxidase (NOX2). The permeability effect of 12-HETE was significantly reduced in NOX2(-/-) mice compared with the WT mice. In vitro experiments also showed that 15-HETE induced HREC migration and tube formation in a NOX-dependent manner. Taken together our data suggest that 12/15-LOX is implicated in DR via a NOX-dependent mechanism.

Keywords: 12- and 15-HETEs; bioactive lipids; diabetic retinopathy; lipoxygenase; reduced nicotinamide adenine dinucleotide phosphate oxidase; retinal inflammation; retinal vascular leakage.


Figures

Fig. 1.
Fig. 1.
Characterizing the effect of hyperglycemia on altering the bioactive-lipid profile in HRECs using LC/MS. A: Fold change in the lipidomic profile of HRECs under hyperglycemia, D-glucose (30 mM) for 5 days, compared with normo-osmotic control, D-glucose (5 mM) plus L-glucose (25 mM). B: Fold change of upregulated metabolites detected in the previous screen in the presence or absence of exogenous AA (20 μM) under hyperglycemia compared with the corresponding controls, D-glucose (5 mM) plus L-glucose (25 mM), with or without AA (20 μM). Data shown are the mean ± SD of three independent experiments. DiH, dihydroxy; DoHE, docosahexaenoic acid; DoPE, docosapentaenoic acid; EDE, eicosadienoic acid; Ep, epoxy; EPE, eicosapentaenoic acid; ETE, eicosatetraenoic acid; ETrE, eicosatrienoic acid; H, hydroxyl; IP, isoprostane; LT, leukotriene; LX, lipoxin; ODE, ​octadecadienoic acid; OME, ​octadecenoic acid; OTrE, octadecatrienoic acid; PG, prostaglandin; TX, thromboxane.
Fig. 2.
Fig. 2.
Hyperglycemia induced 15-LOX protein expression as well as PLA2 activity. A: HRECs were treated with HG, D-glucose (30 mM), or normo-osmotic control for 5 days. Western blot was performed as described in the Research Design and Methods using 15-LOX, 5-LOX, and actin antibodies followed by densitometric analysis. Ratio of the band intensity of 15-LOX or 5-LOX relative to the actin was reported as fold increase in relation to normo-osmotic control (L-glucose), which was arbitrarily set at 1.0. B: HRECs were treated with 15-HETE or vehicle and the change in the resistance was monitored as described in Research Design and Methods using ECIS. Normalized TER for 15-HETE treatment was compared with vehicle-treated endothelial monolayer. C: Treatment of HRECs with D-glucose (30 mM) for 5 days stimulated the activity of PLA2 compared with normo-osmotic control. Data shown are the mean ± SD of three independent experiments. D: In vivo detection of phosphorylated PLA2 (pPLA2) (active form) in serial sections from human diabetic or normal retinas around blood vessel regions (yellow arrowhead), perivascular in the area of glial cells, detected by its marker, glial fibrillary acidic protein (GFAP) (white arrows), as well as in the outer segment of the photoreceptors (yellow arrow).
Fig. 3.
Fig. 3.
Evolving role of 12/15-LOX in compromising retinal barrier function during diabetes. A: Fluorescein angiography (FA) of normal WT, normal 12/15-LOX−/−, diabetic WT, and diabetic 12/15-LOX−/− mice together with their binary images. Data are representative pictures taken at constant interval of every mouse studied in each group. The fluorescence intensity of FA per mouse retina was calculated by the ImageJ software after conversion to binary images then normalized to that of normal WT, which was arbitrarily set at 100. B: Western blot of total retinal albumin among the studied groups followed by densitometric analysis. Ratios of albumin band intensities relative to the actin for each group were compared with normal WT control, which was arbitrarily set at 1.0. Data shown for the comparison are the mean ± SD of four to six mice studied in each group.
Fig. 4.
Fig. 4.
Direct effects of 12/15-LOX-derived metabolites on retinal vasculature. A: Fluorescein angiography (FA) of normal WT mice injected intravitreally with vehicle, as a control, or 12-HETE. One week later, FA was performed to evaluate changes of retinal vasculature. The relative fluorescence intensity of FA per mouse retina was calculated by the ImageJ software then normalized as a percentage to that of vehicle-injected control, which was arbitrarily set at 100%. B: Western blot of total retinal albumin among the studied groups followed by densitometric analysis. Ratio of the albumin band intensity relative to actin for the 12-HETE-injected group was compared with the vehicle-injected control, which was arbitrarily set at 1.0. C: Western blot analysis of retinal ICAM-1, VCAM-1, CD45, and NOX2 after intraocular injection with either 12-HETE (0.1 µM), or vehicle followed by densitometric analysis. Ratios of band intensities of ICAM-1, VCAM-1, CD45, and NOX2, respectively, relative to the actin for 12-HETE-injected group were compared with the vehicle-injected control, which was arbitrarily set at 1.0. Data shown for the comparison are the mean ± SD and representative of four to six mice studied in each group.
Fig. 5.
Fig. 5.
12-HETE or 15-HETE activates HRECs for leukocyte adhesion in a NOX-dependent manner. A: Multiplex analysis of cytokine and chemokine production in conditioned media of HRECs treated with vehicle or 12- or 15-HETE (0.1 μM), n = 4. B: Reduction of 15-HETE-induced leukocyte adhesion by inhibiting ROS derived from NOX. HRECs were seeded in 24-well plates and treated with 15-HETE (0.1 μM, 24 h) or vehicle, in the presence or absence of apocynin (30 μM) or NAC (50 μM). Representative photomicrographs for adherent leukocytes among studied groups; vehicle-treated control, lipopolysaccharide as a positive control, 15-HETE, 15-HETE + apocynin, and 15-HETE + NAC, were taken and quantified for adherent leukocytes. Quantitative data for adherent leukocytes (labeled with red fluorescence dye) were expressed as the mean number of adherent cells per 100 μm ± SD. Numbers represent the average of three independent experiments.
Fig. 6.
Fig. 6.
15-HETE promotes angiogenesis of HRECs through NOX. A: Representative photomicrographs for capillary tube formation among studied groups; vehicle-treated control, VEGF as a positive control, 15-HETE, 15-HETE + apocynin, and 15-HETE + NAC. B: Quantitative data for endothelial cell tube formation expressed as the mean length of formed tube microns ± SD. HRECs were seeded in 96-well plates containing matrigel, and treated with 15-HETE (0.1 μM, 24 h) or vehicle, in the presence or absence of apocynin (30 μM) or NAC (50 μM). Numbers represent average data from three separate experiments.
Fig. 7.
Fig. 7.
15-HETE induces HREC migration via NOX-dependent pathway. A: Real-time measurement of HREC migration under 15-HETE treatment in the presence of apocynin (Apo.) (30 μM) or DMSO using ECIS. The migration velocity was calculated by dividing the total distance that HRECs moved on the radius of the electrode, which is 125 μm the time required for recovering 1 nF capacitance, the confluence point, then normalized as a percentage relative to the migration rate obtained from vehicle-treated cells, which was arbitrarily set at 100%. B–D: Inhibition of 15-HETE-induced HREC migration by NOX2 siRNA. Cells were transfected with siRNA or scrambled siRNA for 24 h and then treated with 15-HETE for 15 min before wound induction. B: Fluorescent detection of transfection control duplex siRNA (TYE 563 fluorescently labeled) in living HRECs 24 h posttransfection. C: Measurement of NOX2 expression relative to actin by Western blot after transfection with NOX2 siRNA. D: Real-time measurement of HREC migration under 15-HETE treatment in the presence of NOX2 siRNA or scrambled siRNA using ECIS. Relative migration velocity of 15-HETE-treated HRECs in the presence or absence of NOX2 siRNA was normalized as a percentage to that of vehicle with scrambled siRNA-treated cells, which was arbitrarily set at 100%. Data shown are the mean ± SD of three independent experiments.
Fig. 8.
Fig. 8.
NOX mediates the in vivo deleterious effect of 12-HETE on retinal vasculature. Fluorescein angiography (FA) of normal WT or NOX2−/− mice injected intravitreally with 12-HETE. The relative fluorescence intensity of FA per mouse retina was calculated by the ImageJ software and normalized as a percentage to 12-HETE-injected WT mice, arbitrarily set at 100%. Data shown are the mean ± SD and representative of four to six mice studied in each group.
Fig. 9.
Fig. 9.
Cascade events involved in the pathogenesis of DR: Hyperglycemia activates the PLA2 to release AA from the retinal cell membrane. AA is then converted to 12- or 15- HETE that generates ROS through NOX, creating a status of oxidative stress. This oxidative stress leads to the activation of retinal endothelial cells through various inflammatory signaling pathways, leading to leukocyte adhesion, hyperpermeability, and ultimately NV (the cardinal signs of DR).

Similar articles

Cited by

References

    1. Fong D. S., Aiello L. P., Ferris F. L., III, Klein R. 2004. Diabetic retinopathy. Diabetes Care. 27: 2540–2553. - PubMed
    1. Frank R. N. 2004. Diabetic retinopathy. N. Engl. J. Med. 350: 48–58. - PubMed
    1. Jeganathan V. S. 2011. Anti-angiogenesis drugs in diabetic retinopathy. Curr. Pharm. Biotechnol. 12: 369–372. - PubMed
    1. Quaggin S. E. 2012. Turning a blind eye to anti-VEGF toxicities. J. Clin. Invest. 122: 3849–3851. - PMC - PubMed
    1. Falavarjani K. G., Nguyen Q. D. 2013. Adverse events and complications associated with intravitreal injection of anti-VEGF agents: a review of literature. Eye (Lond.). 27: 787–794. - PMC - PubMed

Publication types

MeSH terms