Single-cell mass cytometry reveals intracellular survival/proliferative signaling in FLT3-ITD-mutated AML stem/progenitor cells
- PMID: 25598437
- PMCID: PMC4388314
- DOI: 10.1002/cyto.a.22628
Single-cell mass cytometry reveals intracellular survival/proliferative signaling in FLT3-ITD-mutated AML stem/progenitor cells
Abstract
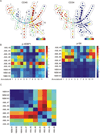
Understanding the unique phenotypes and complex signaling pathways of leukemia stem cells (LSCs) will provide insights and druggable targets that can be used to eradicate acute myeloid leukemia (AML). Current work on AML LSCs is limited by the number of parameters that conventional flow cytometry (FCM) can analyze because of cell autofluorescence and fluorescent dye spectral overlap. Single-cell mass cytometry (CyTOF) substitutes rare earth elements for fluorophores to label antibodies, which allows measurements of up to 120 parameters in single cells without correction for spectral overlap. The aim of this study was the evaluation of intracellular signaling in antigen-defined stem/progenitor cell subsets in primary AML. CyTOF and conventional FCM yielded comparable results on LSC phenotypes defined by CD45, CD34, CD38, CD123, and CD99. Intracellular phosphoprotein responses to ex vivo cell signaling inhibitors and cytokine stimulation were assessed in myeloid leukemia cell lines and one primary AML sample. CyTOF and conventional FCM results were confirmed by western blotting. In the primary AML sample, we investigated the cell responses to ex vivo stimulation with stem cell factor and BEZ235-induced inhibition of PI3K and identified activation patterns in multiple PI3K downstream signaling pathways including p-4EBP1, p-AKT, and p-S6, particularly in CD34(+) subsets. We evaluated multiple signaling pathways in antigen-defined subpopulations in primary AML cells with FLT3-ITD mutations. The data demonstrated the heterogeneity of cell phenotype distribution and distinct patterns of signaling activation across AML samples and between AML and normal samples. The mTOR targets p-4EBP1 and p-S6 were exclusively found in FLT3-ITD stem/progenitor cells, but not in their normal counterparts, suggesting both as novel targets in FLT3 mutated AML. Our data suggest that CyTOF can identify functional signaling pathways in antigen-defined subpopulations in primary AML, which may provide a rationale for designing therapeutics targeting LSC-enriched cell populations.
Keywords: Key terms: acute myeloid leukemia; flow cytometry; leukemia stem cells; mass cytometry; western blotting.
© 2015 International Society for Advancement of Cytometry.
Conflict of interest statement
The authors indicate no potential conflict of interest.
Figures


References
-
- Hope KJ, Jin L, Dick JE. Acute myeloid leukemia originates from a hierarchy of leukemic stem cell classes that differ in self-renewal capacity. Nat Immunol. 2004;5(7):738–743. - PubMed
-
- Huntly BJ, Gilliland DG. Leukaemia stem cells and the evolution of cancer-stem-cell research. Nat Rev Cancer. 2005;5(4):311–321. - PubMed
-
- Lapidot T, Sirard C, Vormoor J, Murdoch B, Hoang T, Caceres-Cortes J, Minden M, Paterson B, Caligiuri MA, Dick JE. A cell initiating human acute myeloid leukaemia after transplantation into SCID mice. Nature. 1994;367(6464):645–648. - PubMed
MeSH terms
Substances
Grants and funding
LinkOut - more resources
Full Text Sources
Other Literature Sources
Medical
Research Materials
Miscellaneous

