. 2014 Apr;51(2):470-482.
doi: 10.1111/1365-2664.12222. Epub 2014 Mar 4.

BEEHAVE: a systems model of honeybee colony dynamics and foraging to explore multifactorial causes of colony failure

Affiliations

BEEHAVE: a systems model of honeybee colony dynamics and foraging to explore multifactorial causes of colony failure

Matthias A Becher et al. J Appl Ecol. 2014 Apr.

Abstract

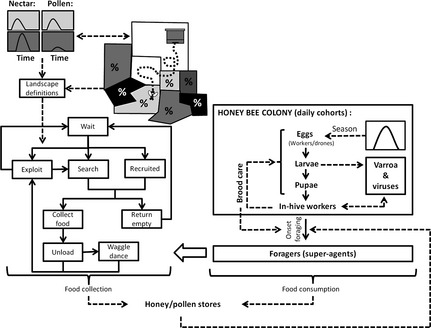
A notable increase in failure of managed European honeybee Apis mellifera L. colonies has been reported in various regions in recent years. Although the underlying causes remain unclear, it is likely that a combination of stressors act together, particularly varroa mites and other pathogens, forage availability and potentially pesticides. It is experimentally challenging to address causality at the colony scale when multiple factors interact. In silico experiments offer a fast and cost-effective way to begin to address these challenges and inform experiments. However, none of the published bee models combine colony dynamics with foraging patterns and varroa dynamics.We have developed a honeybee model, BEEHAVE, which integrates colony dynamics, population dynamics of the varroa mite, epidemiology of varroa-transmitted viruses and allows foragers in an agent-based foraging model to collect food from a representation of a spatially explicit landscape.We describe the model, which is freely available online (www.beehave-model.net). Extensive sensitivity analyses and tests illustrate the model's robustness and realism. Simulation experiments with various combinations of stressors demonstrate, in simplified landscape settings, the model's potential: predicting colony dynamics and potential losses with and without varroa mites under different foraging conditions and under pesticide application. We also show how mitigation measures can be tested.Synthesis and applications. BEEHAVE offers a valuable tool for researchers to design and focus field experiments, for regulators to explore the relative importance of stressors to devise management and policy advice and for beekeepers to understand and predict varroa dynamics and effects of management interventions. We expect that scientists and stakeholders will find a variety of applications for BEEHAVE, stimulating further model development and the possible inclusion of other stressors of potential importance to honeybee colony dynamics.

Keywords: Apis mellifera; Varroa destructor; colony decline; cross-level interactions; feedbacks; foraging; modelling; multi-agent simulation; multiple stressors; predictive systems ecology.


Figures

Figure 1
Figure 1
Overview of the BEEHAVE model structure: Based on the egg‐laying rate and interacting with the varroa and foraging modules, the structure of a single honeybee colony is modelled. A separate landscape module allows the determination of detection probabilities (%) of flower patches by scouting bees and definition of their nectar and pollen flows over the season. This information is then taken into account when foragers collect food in an agent‐based foraging module. Note that the various mortalities implemented in the model are not shown in this figure.
Figure 2
Figure 2
(a) Colony dynamics of BEEHAVE under three sets of conditions: the default setting (continuous line), a setting with favourable, artificial weather data (dashed line) and a setting with ideal food supply that requires no foraging (dotted line) (mean ± SD; n = 10) in comparison with data from literature (data redrawn from Schmickl & Crailsheim 2007). Under ideal food supply, the model colonies peak at the end of August (125 000 workers) and contain about 80 000 bees at the end of the year (y‐axis truncated for clarity). Error bars are shown for every second day. (b) Numbers of worker brood cells, and honey and pollen stores under the BEEHAVE default setting, and numbers of brood cells under ‘ideal’ conditions (mean ± SD; n = 10). Note that pollen stores are shown as increased by a factor of 10 for clarity in the figure. Empirical brood data redrawn from Imdorf, Ruoff and Fluri (2008) (squares: fig. 2 (‘control’), n = 8; circles: fig. 14 (‘carnica’), n = 54). Error bars are shown for every fifth day.
Figure 3
Figure 3
Modelled average age of first foraging (AFF) of workers and average life span (mean ± SD; n = 10 simulations, under default setting) depending on their hatching date, in comparison with empirical data (redrawn from Neukirch 1982, fig. 1). Error bars are shown for every fifth day.
Figure 4
Figure 4
Simulation of a feeder experiment by Seeley, Camazine and Sneyd (1991) on 19th June: Two feeders are set up 400 m north and south of the colony with sugar concentrations of 0·75 and 2·5 mol L−1, respectively. After 4 h, the two feeders are switched. The number of visits at each feeder relative to the maximum number of visits over time is shown for BEEHAVE simulations compared with the redrawn empirical data. Simulations are based on 10 replicates with the number of visits being averaged for each 30 min time slot.
Figure 5
Figure 5
(a) Modelled dynamics of the number of varroa mites transmitting deformed wing virus in a colony and the proportion of mites that are uninfected (mean ± SD; n = 10) when 10 virus‐free and 10 virus‐carrying mites were introduced to the colony at the beginning of each simulation (scenario 2). Only colonies that remained alive were included in the calculation of the mean. Error bars are shown for every tenth day. (b) Honeybee colony dynamics in the presence of virus‐carrying varroa mites (with and without acaricide treatment) and without mites (mean (±SD for varroa and untreated); n = 10). The dotted and grey lines overlap because of acaricide‐treated colonies have similar dynamics to those without varroa. Error bars are shown for every 10th day.
Figure 6
Figure 6
(a) The consequences of doubling forager mortality at a forage patch in different months for a 30 days period (x‐axis) were explored via simulation and compared with an untreated control. Impact of increased forager mortality on modelled colony size is shown (mean ± SD; n = 20) after one or 5 years, if a single food patch was present. The patch provided food constantly throughout the year, as either a relatively high food flow or a relatively low food flow. The mean number of workers is based on surviving colonies only (i.e. excluding dead colonies). (b) Number of colonies dying during each year when limited by forage availability (low food flow scenario) and when doubled forager mortality is imposed for 1 month of each year (timing on x‐axis). Results are shown for 20 replicates, so colonies were lost when exposed in May (50%), June (85%), July (70%), August (30%) and September (15%) and in the control (5%). No colony losses occurred from January to April. No losses occurred under the high food flow scenario, regardless of exposure date.

References

    1. Becher, M.A. , Osborne, J.L. , Thorbek, P. , Kennedy, P.J. & Grimm, V. (2013) Towards a systems approach for understanding honeybee decline: a stocktaking and synthesis of existing models. Journal of Applied Ecology, 50, 868–880. - PMC - PubMed
    1. Blacquière, T. , Smagghe, G. , Van Gestel, C.A. & Mommaerts, V. (2012) Neonicotinoids in bees: a review on concentrations, side‐effects and risk assessment. Ecotoxicology, 21, 973–992. - PMC - PubMed
    1. Boot, W.J. , Schoenmaker, J. , Calis, J.N.M. & Beetsma, J. (1995) Invasion of Varroa jacobsoni into drone brood cells of the honey bee, Apis mellifera . Apidologie, 26, 109–118.
    1. Bühlmann, G. (1985) Assessing population dynamics in a honeybee colony. Mitteilungen der Deutschen Gesellschaft fuer Allgemeine und Angewandte Entomologie, 4, 312–316.
    1. Chen, Y.P. , Pettis, J.S. , Collins, A. & Feldlaufer, M.F. (2006) Prevalence and transmission of honeybee viruses. Applied and Environmental Microbiology, 72, 606–611. - PMC - PubMed

LinkOut - more resources