

Physical Activity, Mediterranean Diet and Biomarkers-Assessed Risk of Alzheimer's: A Multi-Modality Brain Imaging Study
- PMID: 25599008
- PMCID: PMC4294269
- DOI: 10.4236/ami.2014.44006
Physical Activity, Mediterranean Diet and Biomarkers-Assessed Risk of Alzheimer's: A Multi-Modality Brain Imaging Study
Abstract
Increased physical activity and higher adherence to a Mediterranean-type diet (MeDi) have been independently associated with reduced risk of Alzheimer's disease (AD). Their association has not been investigated with the use of biomarkers. This study examines whether, among cognitively normal (NL) individuals, those who are less physically active and show lower MeDi adherence have brain biomarker abnormalities consistent with AD.
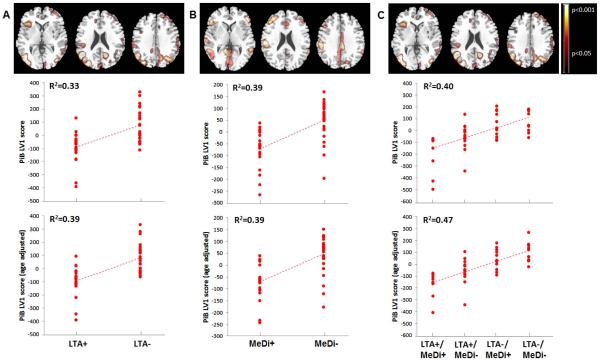
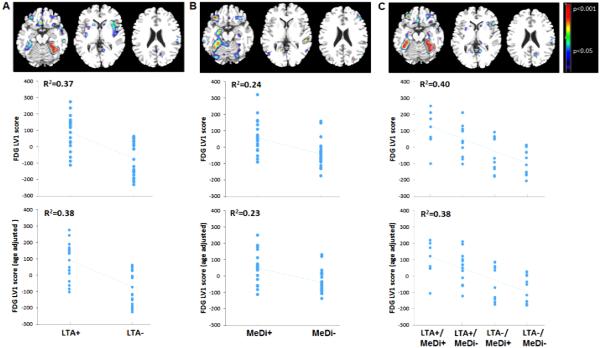
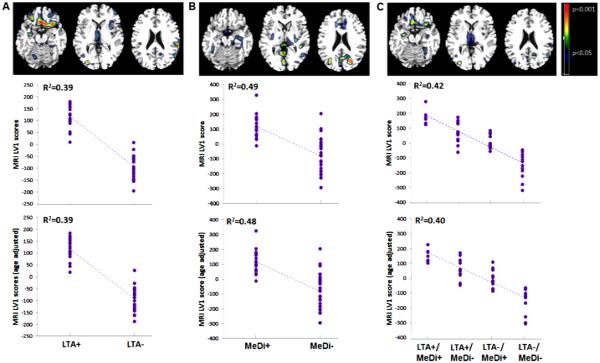
Methods: Forty-five NL individuals (age 54 ± 11, 71% women) with complete leisure time physical activity (LTA), dietary information, and cross-sectional 3D T1-weigthed MRI, 11C-Pittsburgh Compound B (PiB) and 18F-fluorodeoxyglucose (FDG) Positron Emission Tomography (PET) scans were examined. Voxel-wise multivariate partial least square (PLS) regression was used to examine the effects of LTA, MeDi and their interaction on brain biomarkers. Age, gender, ethnicity, education, caloric intake, BMI, family history of AD, Apolipoprotein E (APOE) genotype, presence of hypertension and insulin resistance were examined as confounds. Subjects were dichotomized into more and less physically active (LTA+ vs. LTA-; n = 21 vs. 24), and into higher vs. lower MeDi adherence groups (n = 18 vs. 27) using published scoring methods. Spatial patterns of brain biomarkers that represented the optimal association between the images and the groups were generated for all modalities using voxel-wise multivariate Partial Least Squares (PLS) regression.
Results: Groups were comparable for clinical and neuropsychological measures. Independent effects of LTA and MeDi factors were observed in AD-vulnerable brain regions for all modalities (p < 0.001). Increased AD-burden (in particular higher Aβ load and lower glucose metabolism) were observed in LTA- compared to LTA+ subjects, and in MeDi- as compared to MeDi+ subjects. A gradient effect was observed for all modalities so that LTA-/MeDi- subjects had the highest and LTA+/MeDi+ subjects had the lowest AD-burden (p < 0.001), although the LTA × MeDi interaction was significant only for FDG measures (p < 0.03). Adjusting for covariates did not attenuate these relationships.
Conclusion: Lower physical activity and MeDi adherence were associated with increased brain AD-burden among NL individuals, indicating that lifestyle factors may modulate AD risk. Studies with larger samples and longitudinal evaluations are needed to determine the predictive power of the observed associations.
Keywords: Alzheimer’s Disease; Amyloid; Brain Aging; Early Detection; Glucose Metabolism; MRI; Mediterranean Diet; PET Imaging; Physical activity.
Figures
References
-
- Barnes DE, Yaffe K. The Projected Effect of Risk Factor Reduction on Alzheimer’s Disease Prevalence. The Lancet Neurology. 2011;10:819–828. http://dx.doi.org/10.1016/S1474-4422(11)70072-2. - DOI - PMC - PubMed
-
- Sperling RA, Karlawish J, Johnson KA. Preclinical Alzheimer Disease—The Challenges Ahead. Nature Reviews Neurology. 2013;9:54–58. http://dx.doi.org/10.1038/nrneurol.2012.241. - DOI - PMC - PubMed
-
- Jack CR, Jr., Knopman DS, Jagust WJ, et al. Hypothetical Model of Dynamic Biomarkers of the Alzheimer’s Pathological Cascade. The Lancet Neurology. 2010;9:119–128. http://dx.doi.org/10.1016/S1474-4422(09)70299-6. - DOI - PMC - PubMed
-
- Gu Y, Scarmeas N. Dietary Patterns in Alzheimer’s Disease and Cognitive Aging. Current Alzheimer Research. 2011;8:510–519. http://dx.doi.org/10.2174/156720511796391836. - DOI - PMC - PubMed
-
- Scarmeas N, Stern Y, Mayeux R, Manly JJ, Schupf N, Luchsinger JA. Mediterranean Diet and Mild Cognitive Impairment. Archives of Neurology. 2009;66:216–225. http://dx.doi.org/10.1001/archneurol.2008.536. - DOI - PMC - PubMed
Grants and funding
LinkOut - more resources
Full Text Sources
Other Literature Sources
Miscellaneous