. 2014 Jul 1;1(3-4):147-157.
doi: 10.1080/2326263X.2014.954183.

Neural correlates of learning in an electrocorticographic motor-imagery brain-computer interface

Affiliations

Neural correlates of learning in an electrocorticographic motor-imagery brain-computer interface

Tim M Blakely et al. Brain Comput Interfaces (Abingdon). .

Abstract

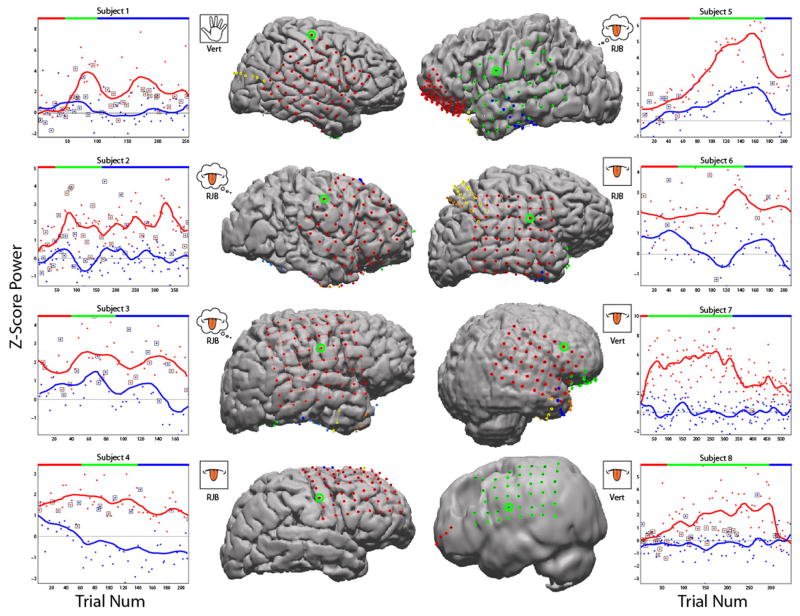
Human subjects can learn to control a one-dimensional electrocorticographic (ECoG) brain-computer interface (BCI) using modulation of primary motor (M1) high-gamma activity (signal power in the 75-200 Hz range). However, the stability and dynamics of the signals over the course of new BCI skill acquisition have not been investigated. In this study, we report 3 characteristic periods in evolution of the high-gamma control signal during BCI training: initial, low task accuracy with corresponding low power modulation in the gamma spectrum, followed by a second period of improved task accuracy with increasing average power separation between activity and rest, and a final period of high task accuracy with stable (or decreasing) power separation and decreasing trial-to-trial variance. These findings may have implications in the design and implementation of BCI control algorithms.

Keywords: Brain-Computer Interface (BCI); Brain-Machine Interface (BMI); electrocorticography (ECoG); high gamma; motor imagery; motor learning.


Figures

Figure 1
Figure 1
Two experimental designs were implemented: the Right Justified Box Task and the 1D Vertical Box Task. The subject observed a computer screen placed comfortably in front of them. A) For both tasks, there were four periods for each trial: a 1 second rest period where the screen was blank, a 1 second target presentation, a period of feedback where the subject had control over the direction of the cursor’s trajectory, and a 1 second reward period after the trial. The RJB task’s feedback period remained constant at 3 seconds, whereas the Vertical Box task’s x-position was fixed, lending to a variable period of feedback. Both tests required the user to perform motor movement or imagery to drive the cursor upwards, and for the user to remain at rest to allow the cursor to fall. B) Time-frequency plots of the control electrode activity for two individual runs relative to the preceding rest period, showing typical active (up direction) trial (top plot) vs. a typical passive (down direction) trial (bottom plot). Increases in high frequency power are shown in red, with decreases illustrated at blue. For up trials where the subjects performed motor movement or imagery, a broad, high frequency (70 Hz+) increase in power can be seen in the control frequency range (dotted box), which drives the cursor upwards. For down targets, there is no increase in the control range and the cursor falls.
Figure 2
Figure 2
Periods of identification, amplification and refinement were marked according to inflection points of the power difference between up and down targets. The first inflection point (first local maximum of the derivative) denoted the end of the identification period while the last inflection point (local minima of the derivative) of the difference defined the refinement period.
Figure 3
Figure 3
Subjects learned to use the BCI system over a period of many trials. A) The control electrode for this subject is highlighted in the green circle and was driven by overt tongue movement. Note that the poor resolution of sulci/gyri was due to a low resolution MRI. B) Mean powers for each trial were calculated in the control range (80–98Hz for Subject 7) and plotted as red points for active/up targets, and blue points for down, with a smoothed mean trace through each type. Three distinct periods of learning can be seen: a period of identification where the mean powers begin to separate between up and down targets (red, top of graph), a period of amplification where the power steadily increases (green), followed by a period of refinement where the difference between the two cases diminishes without a corresponding loss in accuracy (blue). Squares indicate missed targets. C) Taking the difference between the up and down targets illustrates the three stages well. There was a maximal difference of 6 standard deviations, ending the training at a difference of 3 standard deviations.
Figure 4
Figure 4
Cumulative Distribution Function (CDF) generation for Subject 2. A) Log of high gamma in the control range (varied per-subject, but generally 80–100Hz) for a single active trial in red, and rest trial in blue. B) Cumulative histogram of the high gamma power for one active and one rest trial. C) CDF for a single active (red) and rest (blue) trial. A rightward shift in the CDF indicates a higher mean log power for the active target. D) CDF for each of six 18-trial runs. The initial run show low separation in the CDFs for each trial. Runs 2–4 show increasing separation, with runs 5 and 6 showing constant or decreasing separation without a corresponding loss in accuracy, suggested by the decreasing variability in CDF for runs 5 and 6.
Figure 5
Figure 5
Eight subjects underwent on-line BCI training using either hand or tongue control signals with overt (boxed) or imagined (bubble) movement. The type of task is shown underneath the modality. Control electrodes are highlighted in green. All subjects show all three periods, denoted along the top of each graph: identification (red), amplification (green), and refinement (blue). Squares denote missed trials.
Figure 6
Figure 6
Subject 4 performed exceptionally well at the RJB task and performed the same task with additional targets. The subject modulated the control signal in order to reach targets that were not at the extreme top or bottom of the screen. For three targets (top graph), the same pattern of learning can be observed. The mean power and one standard deviation of all trials are shown for the top target (red), middle target (green) and bottom target (blue). Run accuracies are indicated as a percentage underneath each run.

References

    1. Rao RPN. Brain-computer Interfacing: An Introduction. Cambridge University Press; 2013.
    1. Yoo S-S, Fairneny T, Chen N-K, Choo S-E, Panych LP, Park H, et al. Brain-computer interface using fMRI: spatial navigation by thoughts. Neuroreport. 2004 Jul 19;15(10):1591–5. - PubMed
    1. Weiskopf N, Mathiak K, Bock SW, Scharnowski F, Veit R, Grodd W, et al. Principles of a brain-computer interface (BCI) based on real-time functional magnetic resonance imaging (fMRI) IEEE Trans Biomed Eng. 2004 Jun;51(6):966–70. - PubMed
    1. Mellinger J, Schalk G, Braun C, Preissl H, Rosenstiel W, Birbaumer N, et al. An MEG-based brain-computer interface (BCI) Neuroimage. 2007 Jul 1;36(3):581–93. - PMC - PubMed
    1. Schwartz AB, Cui XT, Weber DJ, Moran DW. Brain-controlled interfaces: movement restoration with neural prosthetics. Neuron. 2006 Oct 5;52(1):205–20. - PubMed

LinkOut - more resources