. 2015 Feb;21(2):132-9.
doi: 10.1038/nm.3781. Epub 2015 Jan 19.

B cell follicle sanctuary permits persistent productive simian immunodeficiency virus infection in elite controllers

Affiliations

B cell follicle sanctuary permits persistent productive simian immunodeficiency virus infection in elite controllers

Yoshinori Fukazawa et al. Nat Med. 2015 Feb.

Abstract

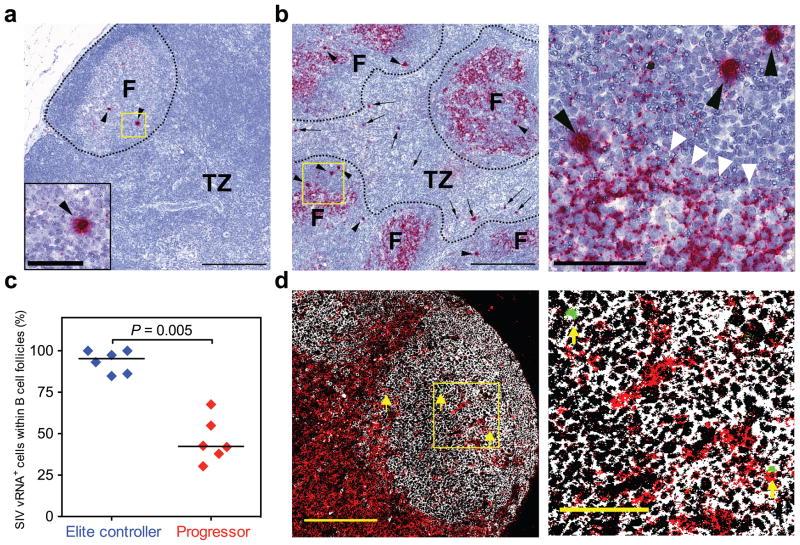
Chronic-phase HIV and simian immunodeficiency virus (SIV) replication is reduced by as much as 10,000-fold in elite controllers (ECs) compared with typical progressors (TPs), but sufficient viral replication persists in EC tissues to allow viral sequence evolution and induce excess immune activation. Here we show that productive SIV infection in rhesus monkey ECs, but not TPs, is markedly restricted to CD4(+) follicular helper T (TFH) cells, suggesting that these EC monkeys' highly effective SIV-specific CD8(+) T cells can effectively clear productive SIV infection from extrafollicular sites, but their relative exclusion from B cell follicles prevents their elimination of productively infected TFH cells. CD8(+) lymphocyte depletion in EC monkeys resulted in a dramatic re-distribution of productive SIV infection to non-TFH cells, with restriction of productive infection to TFH cells resuming upon CD8(+) T cell recovery. Thus, B cell follicles constitute 'sanctuaries' for persistent SIV replication in the presence of potent anti-viral CD8(+) T cell responses, potentially complicating efforts to cure HIV infection with therapeutic vaccination or T cell immunotherapy.


Conflict of interest statement

COMPETING FINANCIAL INTERESTS: The authors declare no competing financial interests.

Figures

Figure 1
Figure 1. Levels of productive SIV infection within CD4+ memory T cell subsets differ in chronic phase attenuated vs. wildtype (WT) SIVmac239 infection
(a) Plasma viral load profiles of representative SIVmac239 and SIVmac239Δnef infections. (b,c) Detection of replication-competent SIV within PD-1/CD200-defined, CD4+ memory T cell populations (TFH vs. non-TFH; 104 sorted cells, isolated as shown in Suppl. Fig. 1) obtained at the designated time points post-infection from Rh27617 (b; WT SIVmac239) and Rh25653 (c; SIVmac239Δnef) after 17 days of co-culture with CEMx174 cells (using flow cytometric analysis of intracellular SIV-Gag p27 to demonstrate CEMx174 cell infection; %Gag+ cell shown). See Suppl. Fig. 3 for similar analysis of Rh26310 (WT SIVmac239) and Rh25714 (SIVmac239Δnef).
Figure 2
Figure 2. The distribution of productive WT SIV infection within CD4+ memory T cell subsets in LN correlates with immune control
(a) Representative flow cytometric profiles showing the typical frequencies (%) of PD-1/CD200-defined subsets within the (CD95high) CD4+ memory T cell populations in LNs of SIV-, elite controller (EC), semi-controller (Semi), progressor (Prog) and cART-suppressed SIV-infected (cART) monkeys (see Suppl. Tables 1 and 2). (b) Relative frequencies of CD4+ TFH (CD200high/PD-1high) within the total CD4+ memory T cell populations in LN of the designated monkey groups (black bars indicate the median value for each group). The Kruskal-Wallis test was used to determine the significance of overall differences in %CD4+ TFH among these monkey groups (p value shown), and if this p value was <0.05, the Wilcoxon rank-sum test was used to perform pair-wise analysis (brackets indicate p<0.05). (c,d) Detection of replication-competent SIVmac239 from sorted PD-1/CD200-defined CD4+ memory T cell subsets of LNs from semi-controller and EC monkeys after 13 days of CEMx174 cell co-culture with 105 sorted LN cells, and from progressor monkeys after 17 days of CEMx174 cell co-culture with 104 sorted LN cells (note: fewer sorted CD4+ memory T cells were available in progressor monkeys due to CD4+ T cell depletion). Representative results are shown in (c), with plasma viral load (in SIV RNA copies/ml) at the time of biopsy shown in parenthesis under the monkey identification numbers, and all analyses are shown in (d) with light colored lines delineating individual monkeys and bold diamond symbols delineating log median values of each group. The Friedman test was used to determine the significance of overall differences in detection of replication-competent SIV among the PD-1/CD200-defined CD4+ memory T cell subsets (p values shown), and the Wilcoxon signed-rank test was used to perform pair-wise analysis when the Friedman p value was <0.05 (brackets indicate Wilcoxon signed-rank p<0.05). (e,f) Comparison of cell-associated SIV RNA (e) and DNA (f) levels in the same LN CD4+ memory T cell subsets, with statistical analysis as described in (d).
Figure 3
Figure 3. Productive SIV infection is anatomically restricted to B cell follicles in EC, but not progressor, monkeys
(a,b) Representative SIV (red) in situ hybridization (RNAscope) images from an EC monkey (a; Rh24827) vs. a chronically SIV-infected progressor (b; Rh-P383) with the yellow boxes indicating areas shown at higher magnification in either an insert (a; lower left) or a separate image at right (b). B cell follicles (F) are demarcated with dashed lines. Black arrows indicate all SIV RNA+ lymphoid cells outside of follicles within the paracortical T cell zone (TZ), while arrowheads point to all SIV RNA+ lymphoid cells within B cell follicles (note intense cell-centric SIV RNA signal within a single cell, consistent with productive infection), which are distinct from the well-characterized “lattice-like” filamentous pattern of extracellular FDC-bound virus that is also present within follicles (white arrowheads). Black scale bars = 100μm and 60μm in low and high magnification images, respectively. (c) Quantification of the percentage of total SIV RNA+ cells within the LN of EC vs. progressor monkeys that are within B cell follicles (bars indicate median values). The Wilcoxon rank-sum test was used to determine the significance of differences in this percentage (p value shown). (d) Representative confocal micrograph of a LN section from an EC monkey (Rh24827) showing conventional in situ hybridization for SIV RNA (green) in combination with anti-CD20 (white) and anti-CD8 (red) antibody staining with the yellow box in the low magnification image (left) indicating the area shown at higher magnification at right. Yellow arrows indicate all productively SIV-infected cells in the image. Yellow scale bars = 200μm and 60μm in low and high magnification images, respectively.
Figure 4
Figure 4. The restriction of productive SIV infection in CD4+ TFH in EC LNs is lost with in vivo CD8+ lymphocyte depletion
(a,b,c) Effect of CD8+ lymphocyte depletion on plasma viral load and on frequencies of total CD3+, CD8+ T cells (a), SIV-specific CD8+ T cells (b), by intracellular cytokine analysis, and total CD3CD8+ NK cells (c) in peripheral blood and LN of EC monkeys. (d) Detection of replication-competent SIV from the designated sorted LN CD4+ memory T cell populations (105 cells co-cultured with CEMx174 for 17 days) from a representative EC monkey (Rh26623) before and after anti-CD8 antibody treatment. (e,f) Quantitative analysis of the distribution of replication-competent SIV by CEMx174 co-culture analysis (e; 105 sorted LN cells; 17 to 22 days) and cell-associated SIV RNA and DNA levels by RT-PCR/PCR (f) among LN (PD-1/CD200-defined) CD4+ memory T cell subsets before and after anti-CD8 antibody treatment of seven EC (see Suppl. Table 1) with light colored lines delineating individual monkeys and bold diamond symbols delineating log median values of each group. Note that one monkey, Rh27033, was taken to necropsy at day 10 post-depletion, so n = 6 at later time points. Statistical analysis was performed as described in Figure 2d (brackets indicate Wilcoxon signed-rank p<0.05).
Figure 5
Figure 5. The restriction of productive SIV infection in CD4+ TFH in EC LNs is not affected by activation of extra-follicular CD4+ memory T cells with IL-7 administration
Three EC monkeys that had recovered both CD8+ T cell counts and CD8+ T cell-mediated SIV control (plasma viral load <100 copies/ml) 5–6 months after anti-CD8 antibody treatment were treated with recombinant rhesus IL-7 to activate extra-follicular CD4+ memory T cells. (a) Comparison of the induction of the proliferation marker Ki-67 on LN non-TFH (PD-1−/dim/CD200−/dim) CD4+ memory T cells from these 3 EC monkeys after CD8+ lymphocyte depletion (black lines) vs. after IL-7 treatment (red lines; Δ%Ki-67 = post-treatment %Ki-67+ - baseline %Ki-67+). (b) Comparison of plasma viral load after CD8+ lymphocyte depletion vs. after IL-7 treatment. (c) Detection of replication-competent SIV by CEMx174 co-culture analysis (105 sorted LN cells; 22 to 36 days) from sorted LN (PD-1/CD200-defined) CD4+ memory T subsets of all 3 IL-7-treated EC monkeys 10 days after IL-7 treatment (the peak of non-TFH CD4+ memory T cell proliferation). Note that in contrast to CD8+ lymphocyte depletion (Fig. 4), induction of proliferation in extra-follicular CD4+ memory T cells by IL-7 did not abrogate the restriction of productive SIV infection to CD4+ TFH (e.g., did not result in an increase in productive infection of extra-follicular CD4+ memory T cells).
Figure 6
Figure 6. CD4+ TFH contain higher levels of cell-associated SIV RNA than non-TFH CD4+ memory T cells in SIV+ RM with effective suppression of viral replication
(a,b) Comparison of the levels of cell-associated SIV RNA and DNA in sorted CD4+ memory T cell subsets (PD-1 and PD-1dim non-TFH vs. PD-1high TFH; see Suppl. Fig. 1) from LN (a) and spleen (b) of Cohort #1 monkeys, which were chronically SIVmac251-infected prior to cART treatment and were assayed 4–6 months after cART initiation when plasma viral loads were ≤60 copies/ml (see Suppl. Table 2). (c) Comparison of the levels of cell-associated SIV RNA and DNA in sorted CD4+ memory T cell subsets (Tcm and TTr/EM vs. TFH; see Suppl. Fig. 8) from LN of Cohort #2 monkeys, which were treated with cART 42 days post-infection with SIVmac239 and were assayed 6 months after cART initiation when plasma viral loads were ≤50 copies/ml (Suppl. Table 2). Light colored lines delineate individual monkeys and bold diamond symbols delineate log median values of each group. Statistical analysis was performed as described in Fig. 2d (brackets indicate Wilcoxon signed-rank p<0.05).

Comment in

References

    1. Kirchhoff F. Immune evasion and counteraction of restriction factors by HIV-1 and other primate lentiviruses. Cell Host Microbe. 2010;8:55–67. - PubMed
    1. Picker LJ, Hansen SG, Lifson JD. New paradigms for HIV/AIDS vaccine development. Annu Rev Med. 2012;63:95–111. - PMC - PubMed
    1. Okoye AA, Picker LJ. CD4(+) T-cell depletion in HIV infection: mechanisms of immunological failure. Immunol Rev. 2013;254:54–64. - PMC - PubMed
    1. Deeks SG, Walker BD. Human immunodeficiency virus controllers: mechanisms of durable virus control in the absence of antiretroviral therapy. Immunity. 2007;27:406–416. - PubMed
    1. Mudd PA, Watkins DI. Understanding animal models of elite control: windows on effective immune responses against immunodeficiency viruses. Curr Opin HIV AIDS. 2011;6:197–201. - PMC - PubMed

Publication types

MeSH terms