

Psychiatric genome-wide association study analyses implicate neuronal, immune and histone pathways
- PMID: 25599223
- PMCID: PMC4378867
- DOI: 10.1038/nn.3922
Psychiatric genome-wide association study analyses implicate neuronal, immune and histone pathways
Erratum in
-
Corrigendum: Psychiatric genome-wide association study analyses implicate neuronal, immune and histone pathways.Nat Neurosci. 2015 Jun;18(6):926. doi: 10.1038/nn0615-926c. Nat Neurosci. 2015. PMID: 26007216 No abstract available.
-
Corrigendum: Psychiatric genome-wide association study analyses implicate neuronal, immune and histone pathways.Nat Neurosci. 2015 Dec;18(12):1861. doi: 10.1038/nn1215-1861c. Nat Neurosci. 2015. PMID: 26605885 No abstract available.
Abstract
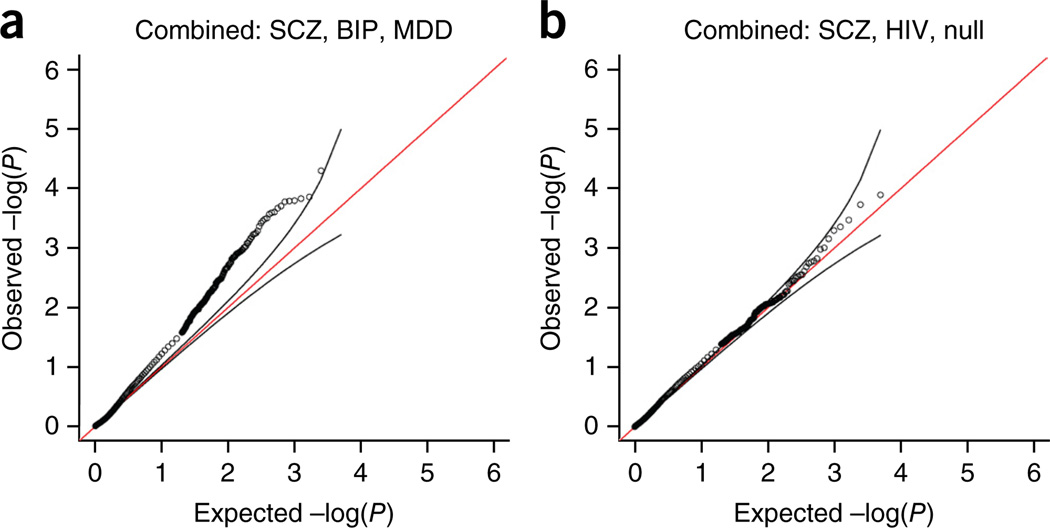
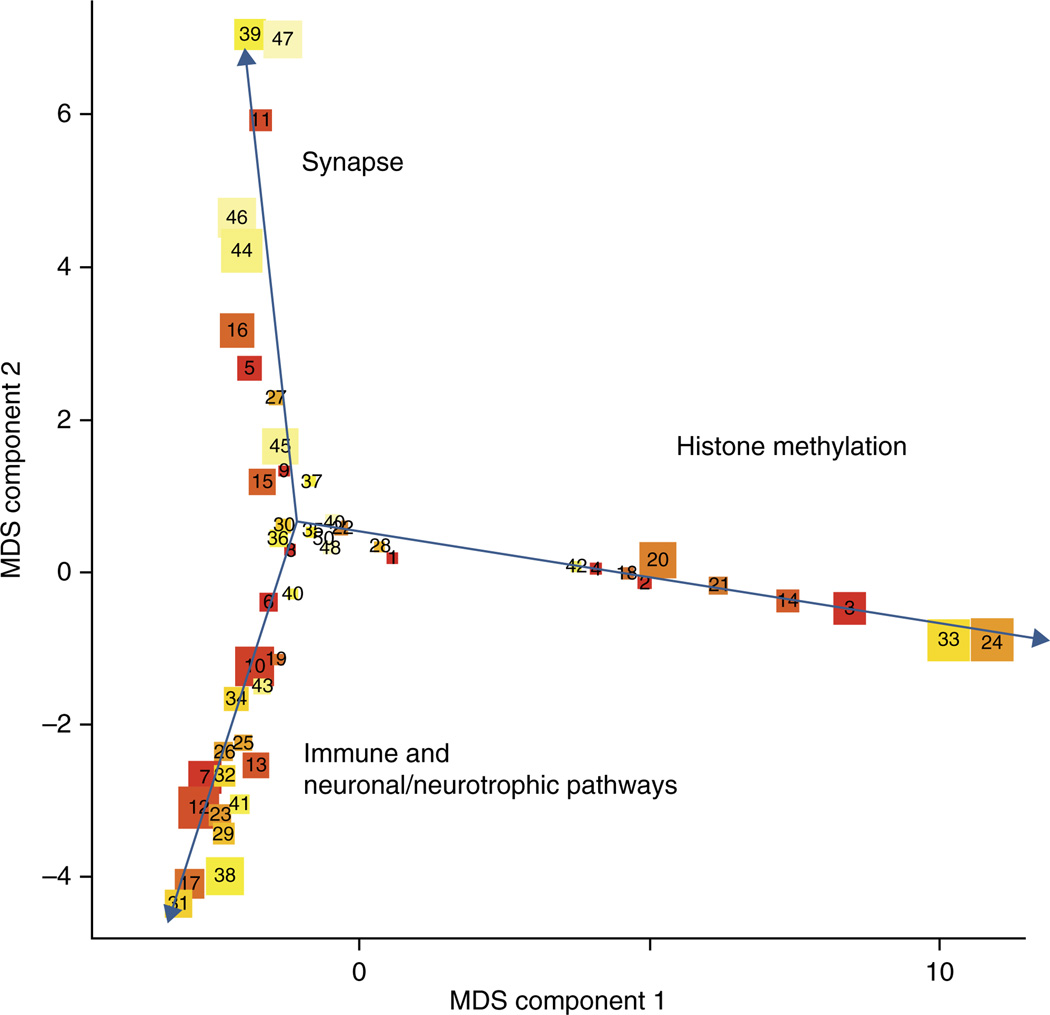
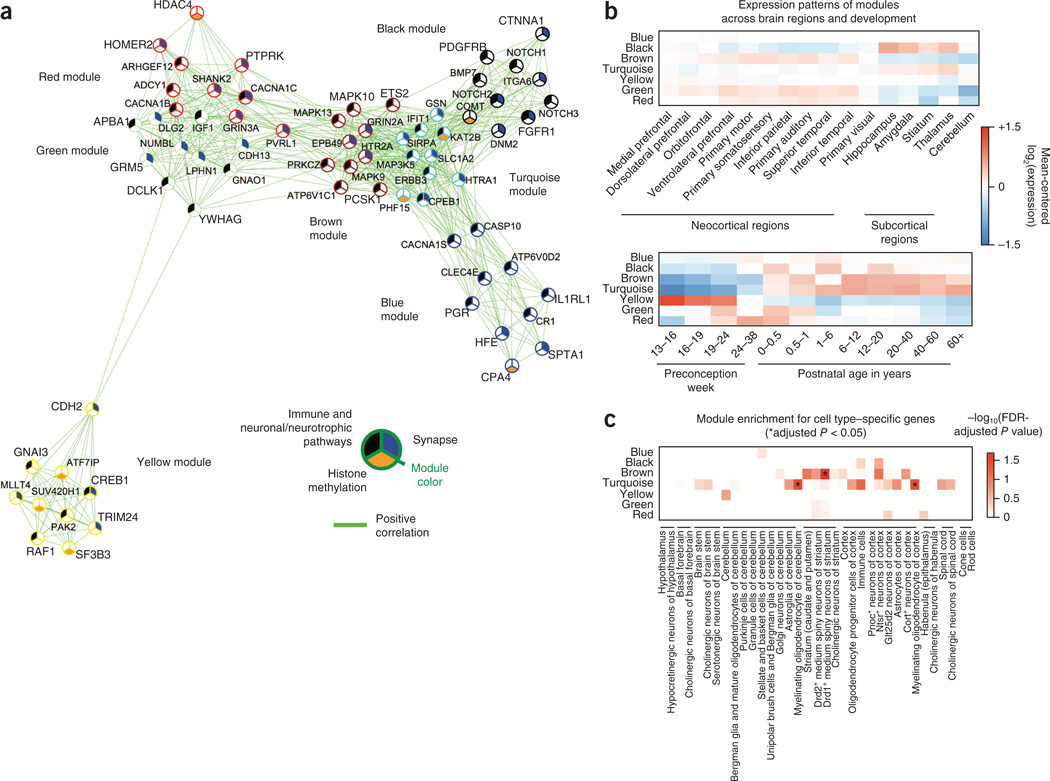
Genome-wide association studies (GWAS) of psychiatric disorders have identified multiple genetic associations with such disorders, but better methods are needed to derive the underlying biological mechanisms that these signals indicate. We sought to identify biological pathways in GWAS data from over 60,000 participants from the Psychiatric Genomics Consortium. We developed an analysis framework to rank pathways that requires only summary statistics. We combined this score across disorders to find common pathways across three adult psychiatric disorders: schizophrenia, major depression and bipolar disorder. Histone methylation processes showed the strongest association, and we also found statistically significant evidence for associations with multiple immune and neuronal signaling pathways and with the postsynaptic density. Our study indicates that risk variants for psychiatric disorders aggregate in particular biological pathways and that these pathways are frequently shared between disorders. Our results confirm known mechanisms and suggest several novel insights into the etiology of psychiatric disorders.
Figures

References
-
- Mirnics K, Middleton FA, Marquez A, Lewis DA, Levitt P. Molecular characterization of schizophrenia viewed by microarray analysis of gene expression in prefrontal cortex. Neuron. 2000;28:53–67. - PubMed
-
- Nam D, Kim SY. Gene-set approach for expression pattern analysis. Brief. Bioinform. 2008;9:189–197. - PubMed
Publication types
MeSH terms
Substances
Grants and funding
- R01 CA082659/CA/NCI NIH HHS/United States
- D43 TW009114/TW/FIC NIH HHS/United States
- G1000708/MRC_/Medical Research Council/United Kingdom
- R01 MH100027/MH/NIMH NIH HHS/United States
- R15 CA170091/CA/NCI NIH HHS/United States
- R01 GM047845/GM/NIGMS NIH HHS/United States
- R01 MH104261/MH/NIMH NIH HHS/United States
- K99MH101367/MH/NIMH NIH HHS/United States
- R01 MH085548/MH/NIMH NIH HHS/United States
- G0800509/MRC_/Medical Research Council/United Kingdom
- R25 MH060482/MH/NIMH NIH HHS/United States
- G0300189/MRC_/Medical Research Council/United Kingdom
- U01 MH085520/MH/NIMH NIH HHS/United States
- K24 MH094614/MH/NIMH NIH HHS/United States
- K99 MH101367/MH/NIMH NIH HHS/United States
- R01 MH063480/MH/NIMH NIH HHS/United States
- R01 MH094293/MH/NIMH NIH HHS/United States
- U01 MH094432/MH/NIMH NIH HHS/United States
- MR/L010305/1/MRC_/Medical Research Council/United Kingdom
LinkOut - more resources
Full Text Sources
Other Literature Sources
Medical
