

Detecting Functional Connectivity During Audiovisual Integration with MEG: A Comparison of Connectivity Metrics
- PMID: 25599264
- PMCID: PMC4533088
- DOI: 10.1089/brain.2014.0296
Detecting Functional Connectivity During Audiovisual Integration with MEG: A Comparison of Connectivity Metrics
Abstract
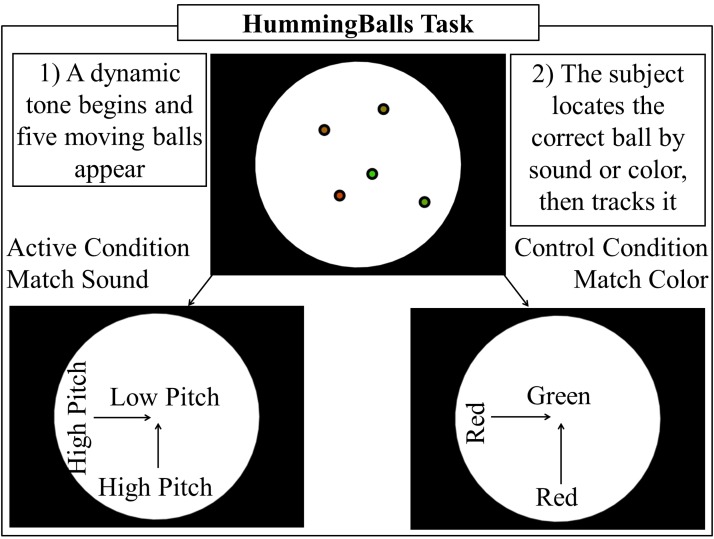
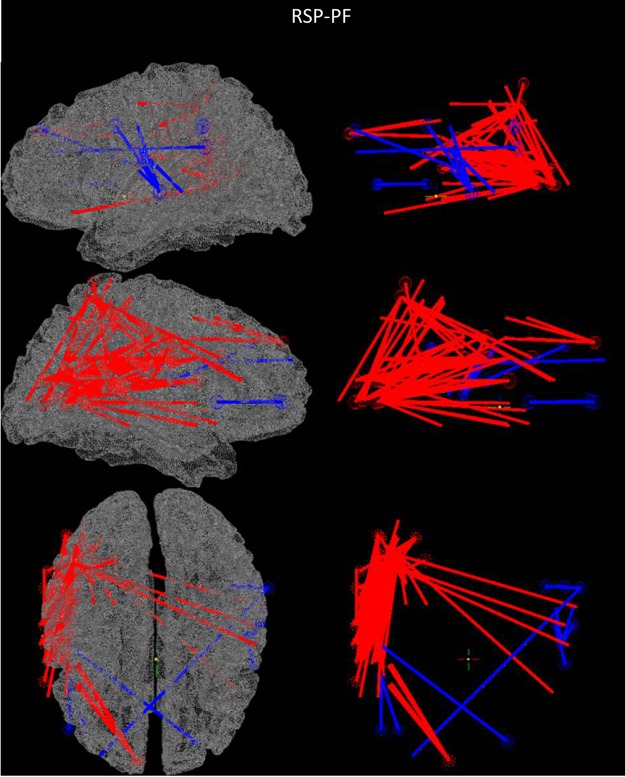
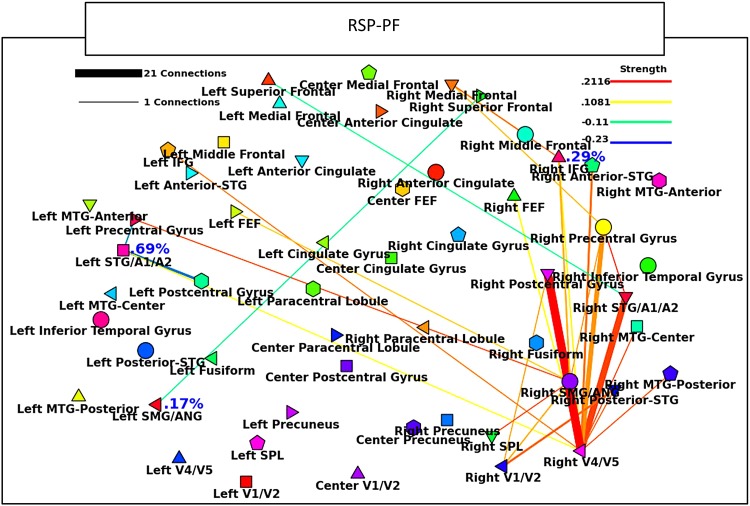
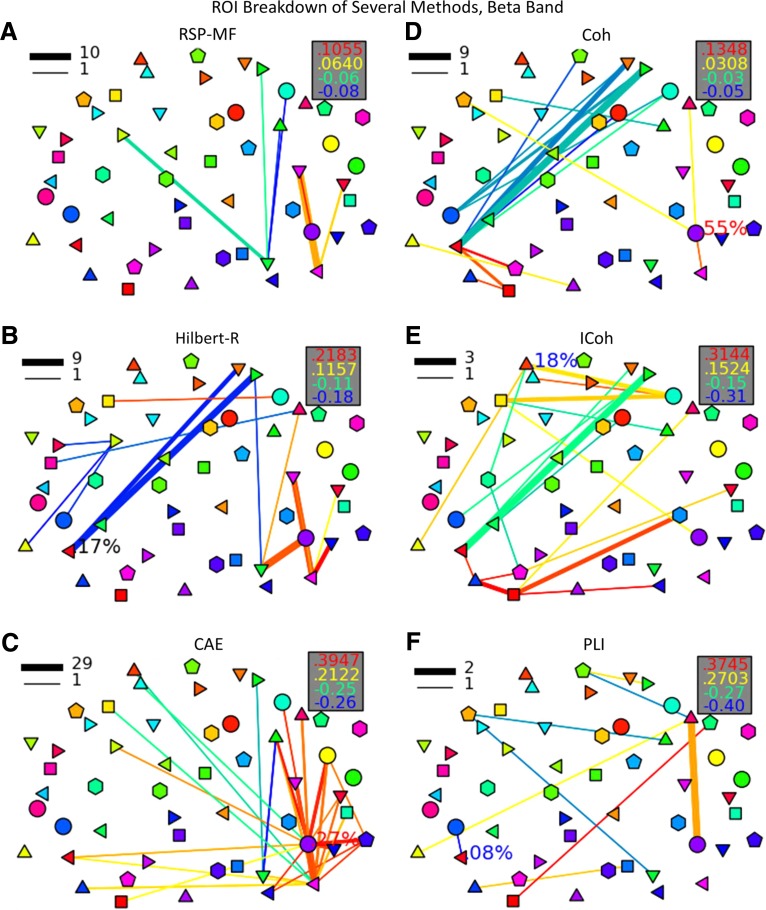
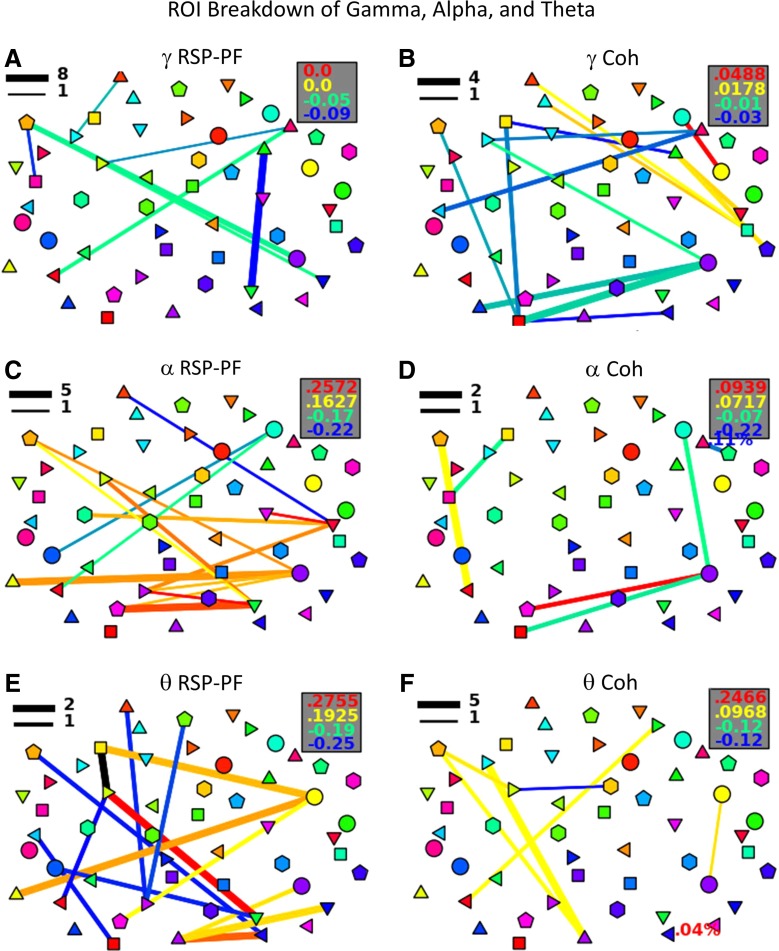
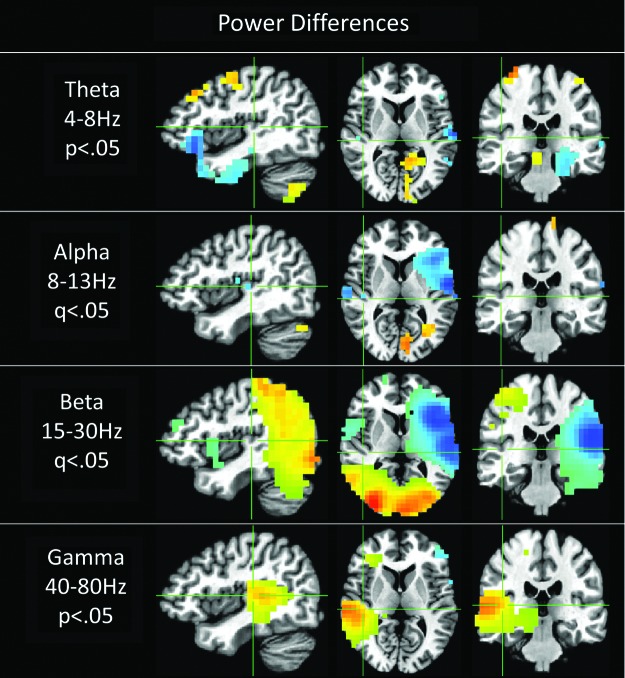
In typical magnetoencephalography and/or electroencephalography functional connectivity analysis, researchers select one of several methods that measure a relationship between regions to determine connectivity, such as coherence, power correlations, and others. However, it is largely unknown if some are more suited than others for various types of investigations. In this study, the authors investigate seven connectivity metrics to evaluate which, if any, are sensitive to audiovisual integration by contrasting connectivity when tracking an audiovisual object versus connectivity when tracking a visual object uncorrelated with the auditory stimulus. The authors are able to assess the metrics' performances at detecting audiovisual integration by investigating connectivity between auditory and visual areas. Critically, the authors perform their investigation on a whole-cortex all-to-all mapping, avoiding confounds introduced in seed selection. The authors find that amplitude-based connectivity measures in the beta band detect strong connections between visual and auditory areas during audiovisual integration, specifically between V4/V5 and auditory cortices in the right hemisphere. Conversely, phase-based connectivity measures in the beta band as well as phase and power measures in alpha, gamma, and theta do not show connectivity between audiovisual areas. The authors postulate that while beta power correlations detect audiovisual integration in the current experimental context, it may not always be the best measure to detect connectivity. Instead, it is likely that the brain utilizes a variety of mechanisms in neuronal communication that may produce differential types of temporal relationships.
Keywords: MEG; all-to-all; audiovisual integration; beta; coherence; functional connectivity; multimodal; oscillation.
Figures
References
-
- Alais D, Newell FN, Mamassian P. 2010. Multisensory Processing in review: from physiology to behaviour. Seeing Perceiving 23:3–38 - PubMed
-
- Antiqueira L, Rodrigues FA, van Wijk BC, Costa Lda F, Daffertshofer A. 2010. Estimating complex cortical networks via surface recordings—A critical note. NeuroImage 53:439–449 - PubMed
-
- Bischoff M, Walter B, Blecker CR, Morgen K, Vaitl D, Sammer G. 2007. Utilizing the ventriloquism-effect to investigate audio-visual binding. Neuropsychologia 45:578–586 - PubMed
-
- Brett M, Penny W, Kiebel S. 2003. Introduction to random field theory. Human Brain Function 867–879
Publication types
MeSH terms
Grants and funding
LinkOut - more resources
Full Text Sources
Other Literature Sources
Molecular Biology Databases
