Clinical Trial
. 2015 Mar;47(3):226-34.
doi: 10.1038/ng.3189. Epub 2015 Jan 19.

Genetic architecture of artemisinin-resistant Plasmodium falciparum

Affiliations
Clinical Trial

Genetic architecture of artemisinin-resistant Plasmodium falciparum

Olivo Miotto et al. Nat Genet. 2015 Mar.

Abstract

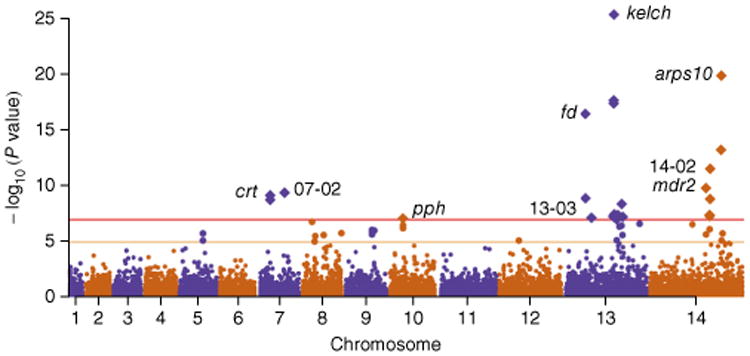
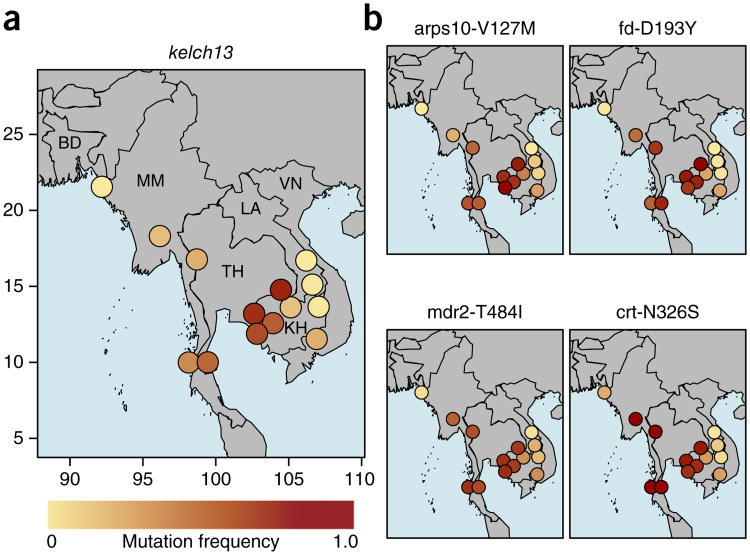
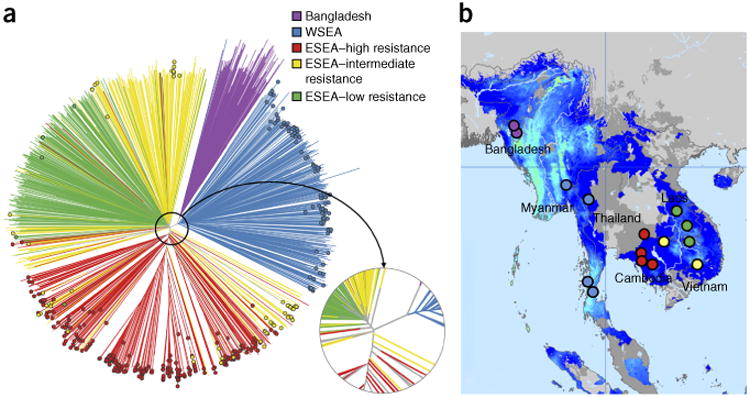
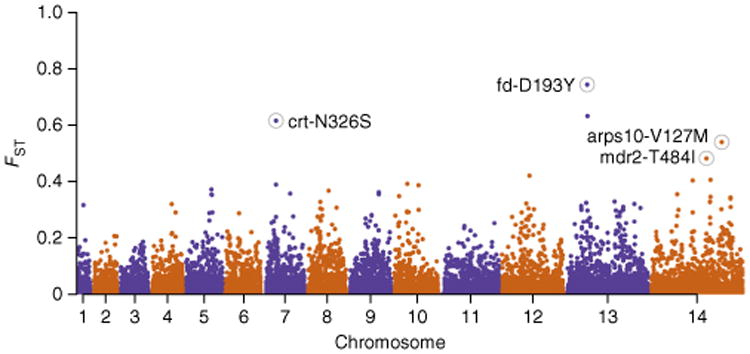
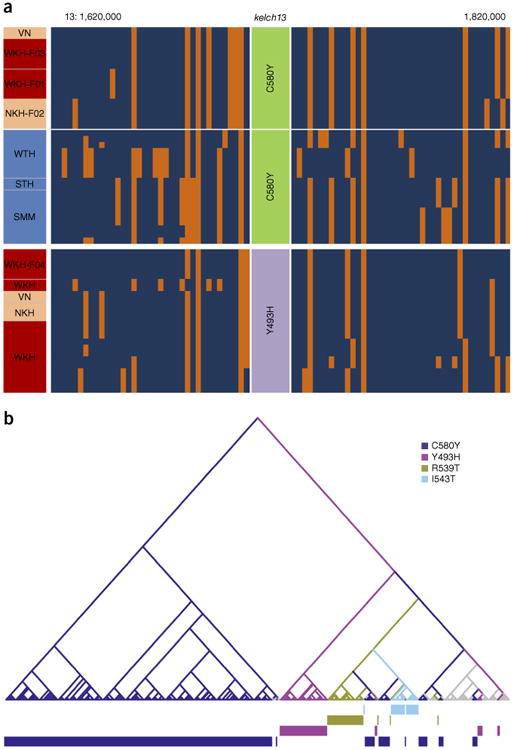
We report a large multicenter genome-wide association study of Plasmodium falciparum resistance to artemisinin, the frontline antimalarial drug. Across 15 locations in Southeast Asia, we identified at least 20 mutations in kelch13 (PF3D7_1343700) affecting the encoded propeller and BTB/POZ domains, which were associated with a slow parasite clearance rate after treatment with artemisinin derivatives. Nonsynonymous polymorphisms in fd (ferredoxin), arps10 (apicoplast ribosomal protein S10), mdr2 (multidrug resistance protein 2) and crt (chloroquine resistance transporter) also showed strong associations with artemisinin resistance. Analysis of the fine structure of the parasite population showed that the fd, arps10, mdr2 and crt polymorphisms are markers of a genetic background on which kelch13 mutations are particularly likely to arise and that they correlate with the contemporary geographical boundaries and population frequencies of artemisinin resistance. These findings indicate that the risk of new resistance-causing mutations emerging is determined by specific predisposing genetic factors in the underlying parasite population.


Figures

Figure 1
Figure 1
Manhattan plot showing the significance of SNP association in the GWAS. Each point represents 1 of the 18,322 SNPs with MAF > 0.01 in a set of 1,063 samples, colored according to chromosome. The x axis represents genomic location, and the y axis represents the P value for the SNP's association calculated using a linear mixed model (Online Methods). SNPs with P ≤ 1 × 10⁻⁷ after Bonferroni correction (n = 24; above the horizontal red line) are represented by diamond symbols. The nine loci containing these SNPs are identified in the plot and listed in Table 2. Polymorphisms with association P ≤ 1 × 10⁻⁵ (n = 24) are shown in a larger size between the horizontal orange and red lines and are listed in supplementary table 2.
Figure 2
Figure 2
Distributions of genetic background mutations associated with artemisinin resistance across Southeast Asian sites. Mutant allele frequencies at each site are represented by colored circles, where deeper shades of red denote higher allele frequencies. Country codes correspond to those listed in Table 1. The two Bangladeshi sites, which are relatively close to each other, are combined because of the low sample sizes. (a) Distribution of kelch13 resistance mutations (defined as any nonsynonymous mutation in kelch13 affecting the BTB/POZ or propeller domains). (b) Distribution of four mutations identified as potential background mutations in artemisinin-resistant parasites: arps10-V127M, fd-D193Y, mdr2-T484I and crt-N326S. Representative geographical coordinates are included on the axes in a.
Figure 3
Figure 3
Population structure and distribution of kelch13 mutants in Southeast Asia. (a) Neighbor-joining tree showing population structure across the 15 Asian sampling sites. Branches with colored tip symbols indicate that the samples are kelch13 mutants, whereas those without tip symbols are wild type for kelch13. The circular subpanel shows a magnified view of the major branching points near the tree root. Mixed-infection samples (with a mixture of wild-type and mutant parasites) were omitted. (b) Map of the 15 sites showing the geographical location of samples in the tree. Bangladeshi (purple) and Thailand-Myanmar border region (WSEA; blue) samples form separate branches, whereas the lower Mekong region (ESEA) samples divide into two major groups, separating samples in high-resistance areas (red) from those in low-resistance areas (green); parasites in intermediate-resistance areas (yellow) are split between these two groups. Map colors indicate the endemicity of P. falciparum in 2010: light blue, high; darker blue, low; gray, absent (the map was adapted from http://www.map.ox.ac.uk/).
Figure 4
Figure 4
Genome-wide analysis of SNP differentiation between resistant and non-resistant geographical compartments. We selected two pairs of geographical compartments, each consisting of a resistant and a proximal non-resistant compartment: Bangladesh versus WSEA and high-resistance versus low-resistance sites in ESEA. For each pair, we estimated FST at every SNP across the genome and computed the mean of the two SNP estimates. In this Manhattan plot, mean FST is plotted at the corresponding genomic position. Polymorphisms at four loci associated with the artemisinin resistance genetic background are among the highest scorers and are highlighted by labeled circles.
Figure 5
Figure 5
Analyses of the haplotypes surrounding kelch13 in resistant mutants. (a) Haplotype diagram. Each vertical column represents a SNP (MAF ≥ 0.1 in our data set; within 100 kb on either side of the kelch13 gene), and each horizontal line represents a sample; at the intersection, the color represents the genotyped allele in the sample: blue, reference; orange, alternative. Haplotypes are shown for a selection of samples carrying the mutations k13-C580Y (top) and k13-Y493H (bottom), organized by geographical compartment, as shown in the left-hand column (blue, WSEA; red, ESEA high resistance; pink, ESEA intermediate resistance). The samples' regions or founder populations are indicated. (b) Tree based on the LCHLs for samples containing kelch13 mutations: samples with long shared haplotypes cluster closely. Tips represent samples and have been colored by the alteration present in the sample. Internal branches have been colored by the most frequent alteration present in the subtrees to which they lead. The bars at the bottom offer visual aid for tracking how different mutations cluster and segregate across the tree. Branches have been colored by the most frequent mutation present in the subtree they subtend. Colored bars at the bottom show which alteration corresponds to the tree tip directly above. Details of the method are discussed in the Online Methods.

Similar articles

Cited by

References

    1. Dondorp AM, et al. The threat of artemisinin-resistant malaria. N Engl J Med. 2011;365:1073–1075. - PMC - PubMed
    1. Dondorp AM, et al. Artemisinin resistance in Plasmodium falciparum malaria. N Engl J Med. 2009;361:455–467. - PMC - PubMed
    1. Phyo AP, et al. Emergence of artemisinin-resistant malaria on the western border of Thailand: a longitudinal study. Lancet. 2012;379:1960–1966. - PMC - PubMed
    1. Hien TT, et al. In vivo susceptibility of Plasmodium falciparum to artesunate in Binh Phuoc Province, Vietnam. Malar J. 2012;11:355. - PMC - PubMed
    1. Kyaw MP, et al. Reduced susceptibility of Plasmodium falciparum to artesunate in southern Myanmar. PLoS ONE. 2013;8:e57689. - PMC - PubMed

Publication types

MeSH terms