Meta-Analysis
. 2015 Mar;47(3):199-208.
doi: 10.1038/ng.3192. Epub 2015 Jan 19.

The landscape of long noncoding RNAs in the human transcriptome

Affiliations
Meta-Analysis

The landscape of long noncoding RNAs in the human transcriptome

Matthew K Iyer et al. Nat Genet. 2015 Mar.

Abstract

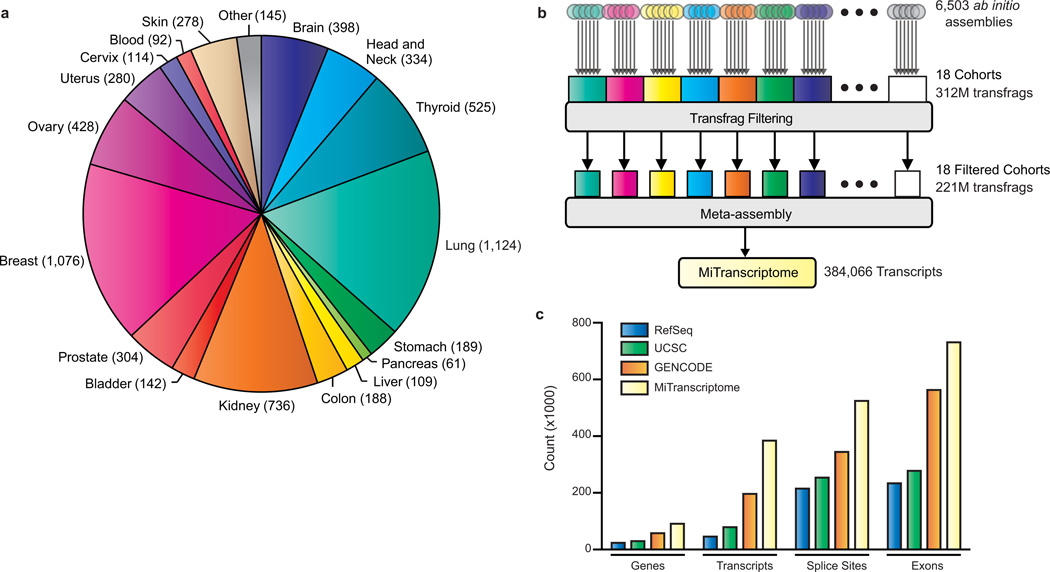
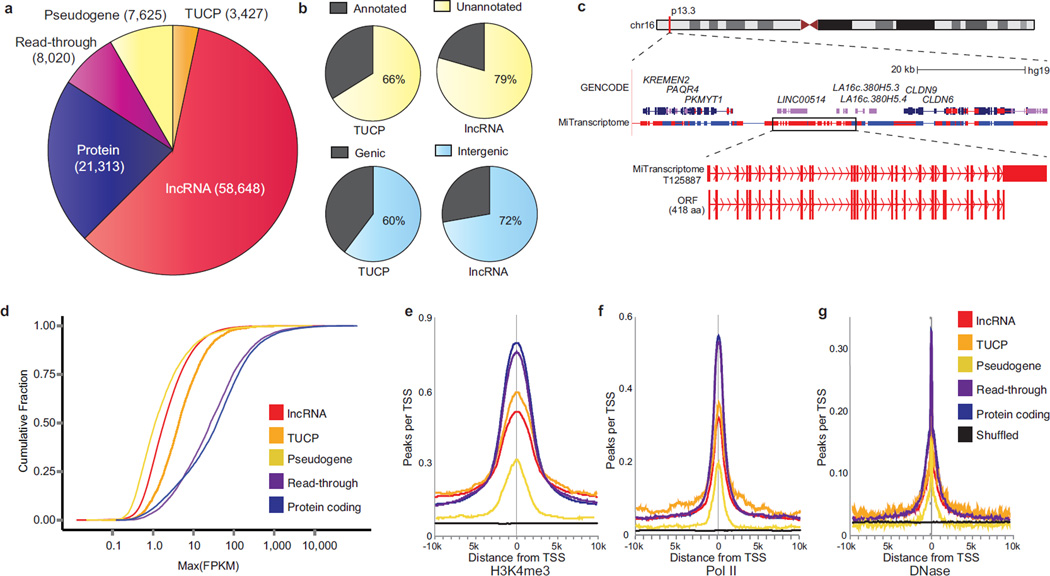
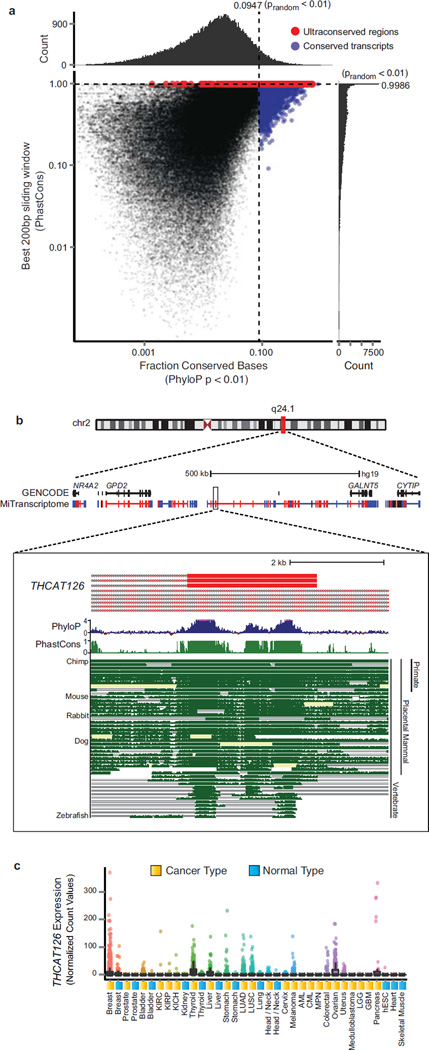
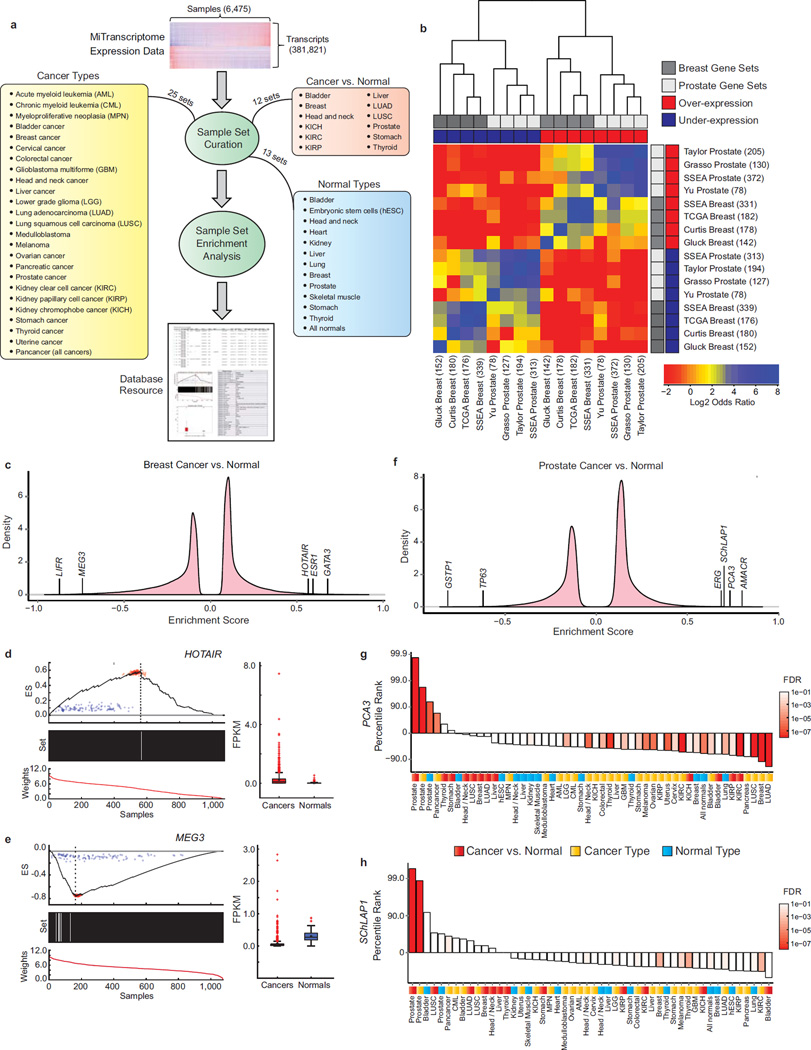
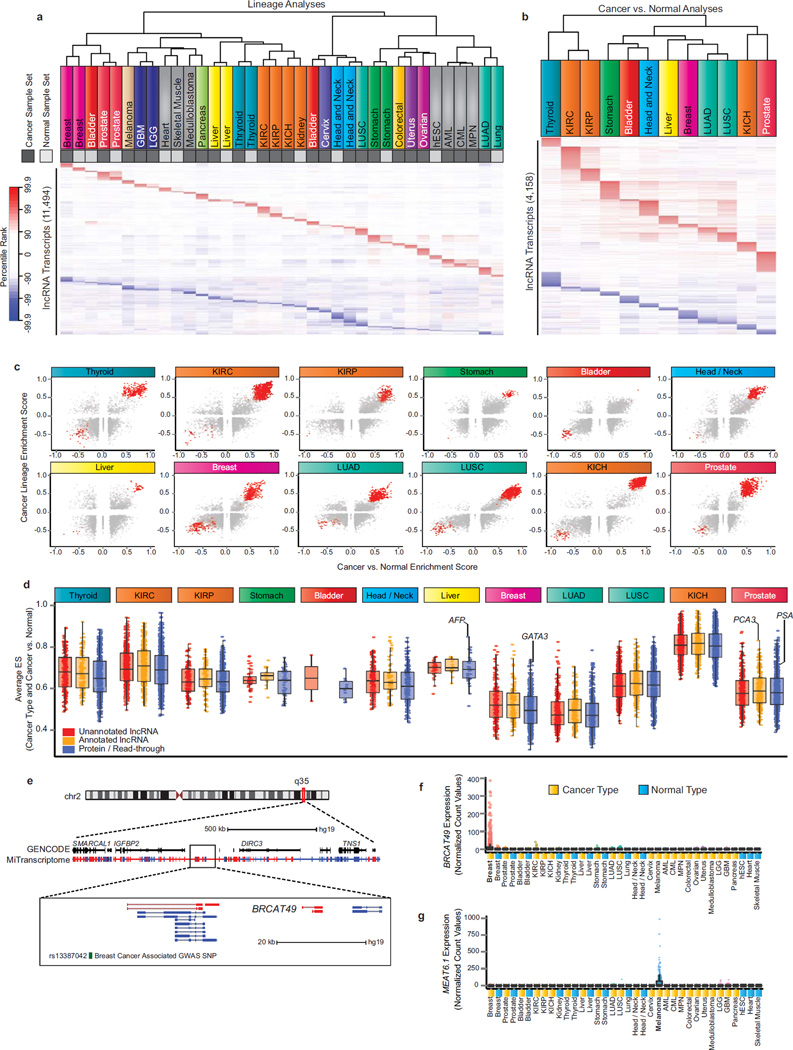
Long noncoding RNAs (lncRNAs) are emerging as important regulators of tissue physiology and disease processes including cancer. To delineate genome-wide lncRNA expression, we curated 7,256 RNA sequencing (RNA-seq) libraries from tumors, normal tissues and cell lines comprising over 43 Tb of sequence from 25 independent studies. We applied ab initio assembly methodology to this data set, yielding a consensus human transcriptome of 91,013 expressed genes. Over 68% (58,648) of genes were classified as lncRNAs, of which 79% were previously unannotated. About 1% (597) of the lncRNAs harbored ultraconserved elements, and 7% (3,900) overlapped disease-associated SNPs. To prioritize lineage-specific, disease-associated lncRNA expression, we employed non-parametric differential expression testing and nominated 7,942 lineage- or cancer-associated lncRNA genes. The lncRNA landscape characterized here may shed light on normal biology and cancer pathogenesis and may be valuable for future biomarker development.


Figures

Figure 1
Figure 1. Ab initio transcriptome assembly reveals an expansive landscape of human transcription
(a) Pie chart showing composition and cohort sizes for transcriptome reconstruction. The 6,503 RNA-Seq libraries were categorized into 18 cohorts by organ system. Organ systems with relatively few libraries were grouped together as ‘other’. (b) Workflow diagram for transcriptome reconstruction. Ab initio assembly was carried out on each RNA-Seq library yielding transcript fragments (transfrags) predictions that may represent full or partial length transcripts. Ab initio assemblies were grouped by cohort and filtered to remove unreliable transfrags. Meta-assembly was performed on filtered transfrags for each cohort. Finally, transcripts from individual cohorts were merged to produce a consensus MiTranscriptome assembly. (c) Bar chart comparing exons, splice sites, transcripts, and genes in the MiTranscriptome assembly with the RefSeq (Dec, 2013), UCSC (Dec, 2013) and GENCODE (release 19) catalogs.
Figure 2
Figure 2. Characterization of the MiTranscriptome assembly
(a) Pie chart of composition and quantities of lncRNA, transcripts of unknown coding potential (TUCP), expressed pseudogene, read-through, and protein-coding genes in the MiTranscriptome assembly. (b) Pie charts of number of lncRNAs and TUCP genes (top) unannotated versus annotated relative to reference catalogs and (bottom) intragenic versus intergenic. (c) Genomic view of the chromosome 16p13.3 locus. Protein coding genes (PKMYT1 to CLDN9) border an intergenic region containing GENCODE lncRNA genes LINC00514 and LA16c.380H5. MiTranscriptome transcripts encompassing these genes are shown in a dense view, and (bottom) an individual isoform containing a 29-exon, 418aa ORF is highlighted. This ORF spans multiple GENCODE lncRNAs. (d) Empirical cumulative distribution plot comparing the maximum expression (FPKM) of the major isoform of each gene across gene categories. (e, f, and g) Plots of aggregated ENCODE ChIP-Seq data from 13 cell lines at 10kb intervals surrounding expressed transcription start sites (FPKM > 0.1) for (e) H3K4me3, (f) RNA polymerase II (Pol II), and (g) DNase hypersensitivity.
Figure 3
Figure 3. Analysis of conservation in lncRNAs
(a) Scatter plot with marginal histograms depicting the distribution of full transcript conservation levels (x axis) and maximal 200bp window conservation levels (y axis) for lncRNA and TUCP transcripts. Full transcript conservation levels were measured using the fraction of conserved bases (PhyloP p < 0.01). Sliding window conservation levels were measured using the average PhastCons score across 200bp regions along the transcript. Blue points indicate transcripts that were conserved relative to random non-transcribed intergenic control regions (false positive rate < 0.01). Red points indicate transcripts with 200bp windows that meet the criteria for ‘ultraconserved’ regions. Marginal histograms depict the distribution of scores along both axes. Scores of zero were omitted from the plot. (b) Genomic view of chromosome 2q24.1 locus. Protein coding genes GALNT5 and GPD2 flank an intergenic region with no annotated transcripts. MiTranscriptome transcripts are shown in a dense view populating this intergenic space. Blue and red color represents positive and negative strand transcripts, respectively (color scheme applies to all subsequent genomic views). Most zoomed view (bottom) depicts a highly conserved exon from the lncRNA THCAT126. Multiz alignment of 46 vertebrate species depicted as well as the per base PhyloP and PhastCons conservation score. (c) Expression data for THCAT126 across all MiTranscriptome cancer and normal tissue type cohorts.
Figure 4
Figure 4. Methodology for discovering cancer-associated lncRNAs
(a) Samples were grouped into 50 different sample sets in three categories: (1) cancer type, (2) normal type, and (3) cancer versus normal. Enrichment testing was performed using SSEA, and significant transcripts were imported into an online resource. (b) Heatmap showing concordance of SSEA algorithm with prostate and breast cancer gene signatures obtained from the Oncomine database. The top 1% over-expressed and under-expressed genes from each analysis were compared using Fisher’s Exact Tests. (c) Enrichment score density plots for breast cancers versus normal samples. (d and e) Enrichment and expression plots for lncRNAs (d) HOTAIR and (e) MEG3. Subplots include: (top) running ES across all samples (dotted line: max/min ES, red points: Poisson resamplings of fragment counts, blue points: random permutations of the sample labels). (middle) Black bars (cancers) or white bars (normals). (bottom) Rank-ordered normalized expression values. Adjacent boxplots (interquartile range and median shown by box and whiskers) depict transcript expression (FPKM) in cancers and normals. 967 and 109 patients in the breast cancer and normal groups, respectively. (f) Enrichment score density plots for prostate cancers versus normal samples. (g and h) Bar plots of percentile ranks for prostate cancer-specific lncRNAs (g) PCA3 and (h) SChLAP1 across Cancer vs. Normal (red), Cancer Type (gold) and Normal Type (blue) sample sets. Bar colors depict statistical significance (FDR).
Figure 5
Figure 5. Discovery of lineage-associated and cancer-associated lncRNAs in the MiTranscriptome compendia
(a) Heatmap of lineage-specific lncRNAs. Each column represents a sample set from one of 25 cancer (dark grey) and normal (light grey) lineages and each row represents an individual lncRNA transcript. All transcripts were statistically significant (FDR < 1e-7) and ranked in the top 1% most positively or negatively enriched transcripts within at least one sample set. The heatmap color spectrum corresponds to percentile ranks, with under-expressed transcripts (blue) and over-expressed transcripts (red). (b) Heatmap of cancer-specific lncRNAs nominated by SSEA Cancer vs. Normal analysis of 12 cancer types (columns). All transcripts were statistically significant (FDR < 1e-3) and ranked in the top 1% most positively or negatively enriched transcripts within at least one sample set. (c) Scatter plots showing enrichment score for Cancer vs. Normal (x axis) and Cancer Lineage (y axis) for all lineage-specific and cancer-associated lncRNA transcripts across 12 cancer types. Red points indicate transcripts meeting the percentile cutoffs for cancer- and lineage-association. (d) Boxplot comparing the performance of cancer- and lineage-associated lncRNAs across 12 cancer types. The average of the lineage and cancer versus normal ES is plotted on the y axis. (e) Genomic view of chromosome 2q35 locus. Most zoomed view (bottom) depicts BRCAT49, a breast lineage and breast cancer specific lncRNA. Breast cancer associated GWAS SNP, rs13387042, is depicted in green. (f) Expression data for BRCAT49 across all MiTranscriptome cancer and normal tissue type cohorts. (g) Expression data for MEAT6 across all MiTranscriptome cancer and normal tissue type cohorts.

References

    1. Ferlay J, et al. Cancer incidence and mortality worldwide: Sources, methods and major patterns in GLOBOCAN 2012. International Journal of Cancer. 2014 - PubMed
    1. Kandoth C, et al. Mutational landscape and significance across 12 major cancer types. Nature. 2013;502:333–339. - PMC - PubMed
    1. Ciriello G, et al. Emerging landscape of oncogenic signatures across human cancers. Nature genetics. 2013;45:1127–1133. - PMC - PubMed
    1. Djebali S, et al. Landscape of transcription in human cells. Nature. 2012;489:101–108. - PMC - PubMed
    1. Ulitsky I, Bartel DP. lincRNAs: genomics, evolution, and mechanisms. Cell. 2013;154:26–46. - PMC - PubMed

Publication types

Substances